. 2015 Mar 3;112(9):2888-93.
doi: 10.1073/pnas.1319378112. Epub 2015 Feb 18.

Gαi/o-coupled receptor signaling restricts pancreatic β-cell expansion

Affiliations

Gαi/o-coupled receptor signaling restricts pancreatic β-cell expansion

Miles Berger et al. Proc Natl Acad Sci U S A. .

Abstract

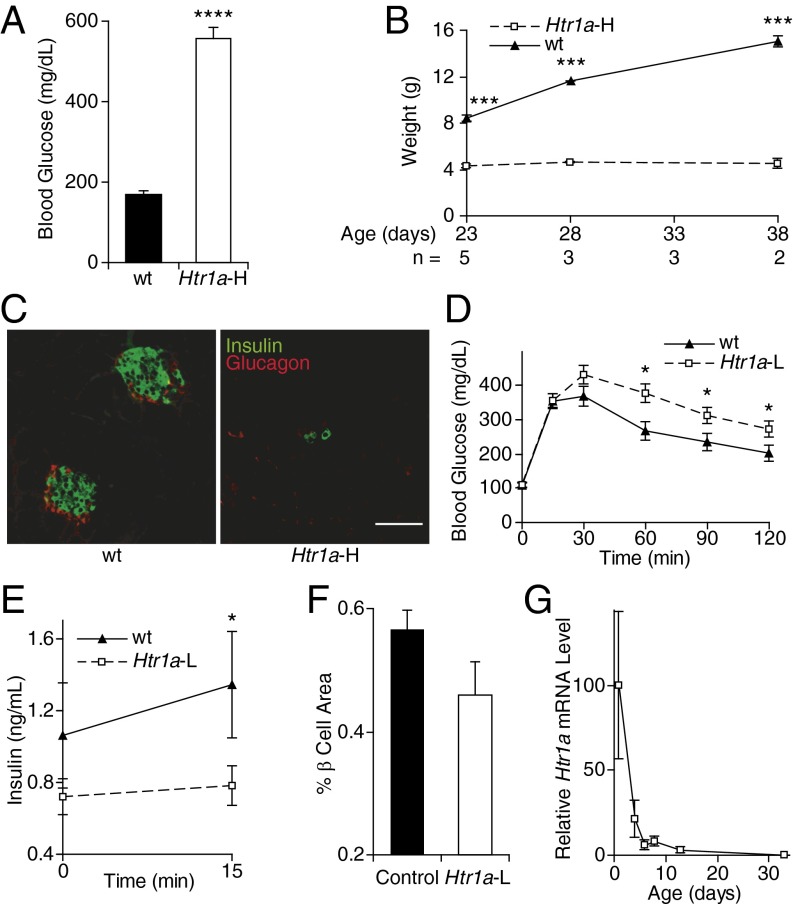
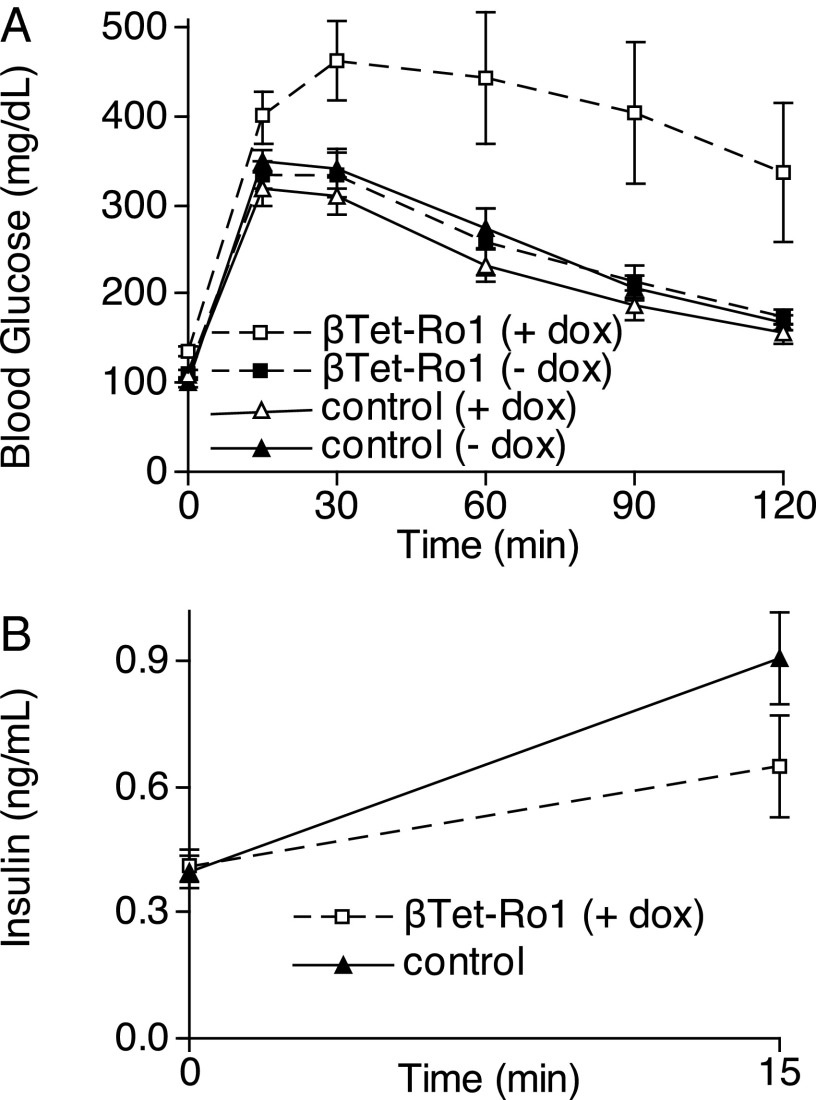
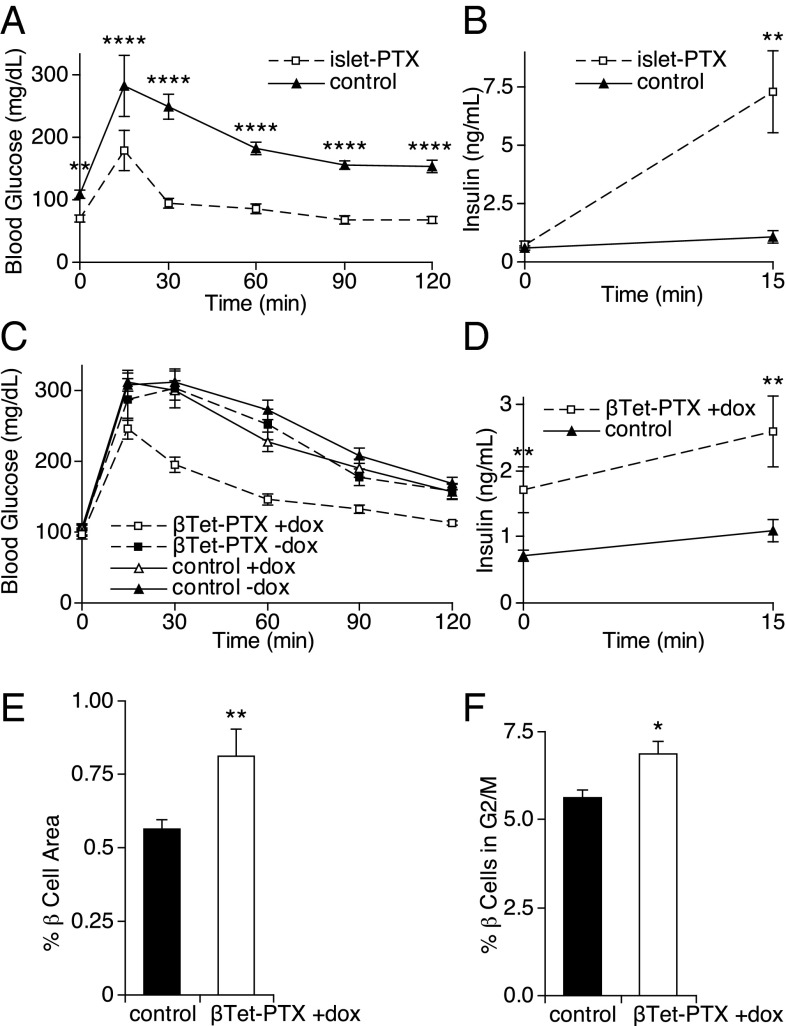
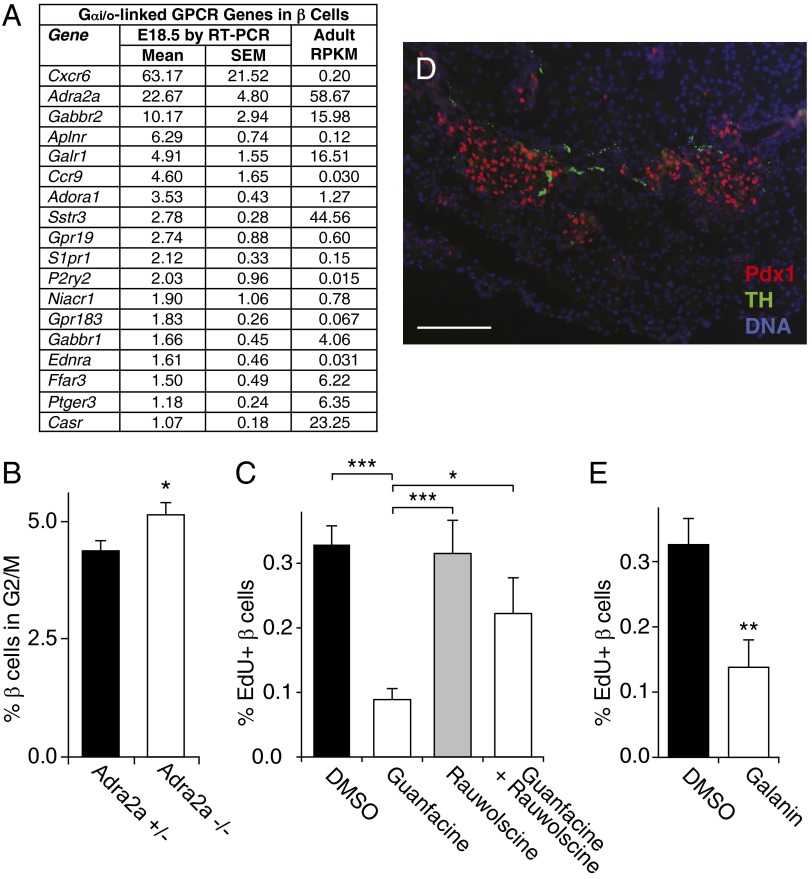
Gi-GPCRs, G protein-coupled receptors that signal via Gα proteins of the i/o class (Gαi/o), acutely regulate cellular behaviors widely in mammalian tissues, but their impact on the development and growth of these tissues is less clear. For example, Gi-GPCRs acutely regulate insulin release from pancreatic β cells, and variants in genes encoding several Gi-GPCRs--including the α-2a adrenergic receptor, ADRA2A--increase the risk of type 2 diabetes mellitus. However, type 2 diabetes also is associated with reduced total β-cell mass, and the role of Gi-GPCRs in establishing β-cell mass is unknown. Therefore, we asked whether Gi-GPCR signaling regulates β-cell mass. Here we show that Gi-GPCRs limit the proliferation of the insulin-producing pancreatic β cells and especially their expansion during the critical perinatal period. Increased Gi-GPCR activity in perinatal β cells decreased β-cell proliferation, reduced adult β-cell mass, and impaired glucose homeostasis. In contrast, Gi-GPCR inhibition enhanced perinatal β-cell proliferation, increased adult β-cell mass, and improved glucose homeostasis. Transcriptome analysis detected the expression of multiple Gi-GPCRs in developing and adult β cells, and gene-deletion experiments identified ADRA2A as a key Gi-GPCR regulator of β-cell replication. These studies link Gi-GPCR signaling to β-cell mass and diabetes risk and identify it as a potential target for therapies to protect and increase β-cell mass in patients with diabetes.

Keywords: G-protein coupled receptors; diabetes mellitus; islet; perinatal; β cell mass.


Conflict of interest statement

The authors declare no conflict of interest.

Figures

Fig. 1.
Fig. 1.
Glucose metabolism in ePet1-Htr1a mice. (A) Blood glucose levels were measured in nonfasting Htr1a-H mice (n = 3) and nontransgenic control littermates (n = 4). (B) Weights of Htr1a-H mice and control littermates are shown. (C) Representative pancreatic sections from an Htr1a-H mouse and a control littermate at age P7 were stained for insulin (green) and glucagon (red). (Scale bar, 50 µm.) (D and E) Blood glucose (n = 19 Htr1a-L and 12 wild-type mice) (D) and plasma insulin (n = 19 Htr1a-L and 13 wild-type mice) (E) levels were measured at the indicated time points following i.p. glucose injection in adult mice. (F) β-Cell area was measured as a percent of total pancreatic area in adult control (n = 17) and Htr1a-L (n = 12) mice. (G) Htr1a mRNA levels were measured in the pancreata of Htr1a-L mice at the ages shown (n = 5–10 mice at each age). All data points represent the mean ± SEM. *P < 0.05, ***P < 0.001, and ****P < 0.0001 vs. wild-type animals by two-tailed Student’s t test.
Fig. 2.
Fig. 2.
Glucose metabolism in βTet-Ro1 mice. (A) Glucose-tolerance tests were performed in adult βTet-Ro1 mice and control littermates whose mothers were treated with or without doxycycline from conception until day P7. (B) Plasma insulin levels were measured before and 15 min after i.p. glucose injection in βTet-Ro1 mice (n = 4) and controls (n = 17). All data points represent the mean ± SEM. See Table S1 for weights and Tables S2 and S3 for statistical analysis of A.
Fig. 3.
Fig. 3.
Blocking Gαi/o signaling with PTX in β-cells. (A) Glucose-tolerance tests were performed in adult islet-PTX (n = 7) and control (n = 7) mice. (B) Plasma insulin levels were measured at the indicated times after i.p. glucose injection in islet-PTX (n = 5) and control (n = 5) mice. (C) Glucose-tolerance tests were performed in adult βTet-PTX mice and control littermates whose mothers were treated with or without doxycycline from conception until day P7. (D) Plasma insulin levels were measured at the indicated times after i.p. glucose injection in βTet-PTX (n = 8) and control (n = 10) mice. (E) β-Cell area was measured as a percent of total pancreatic area in adult βTet-PTX (n = 7) and control (n = 17) mice. (F) Replication rate in β cells from βTet-PTX (n = 6) and control (n = 10) mice at age P1 was measured by determining the percentage of β cells in the G2 and M phases of the cell cycle by flow cytometry. All data points represent the mean ± SEM. *P < 0.05, **P < 0.01, and ****P < 0.0001 vs. control animals by two-tailed Student’s t test. See Tables S4 and S5 for weights for animals in A and C, respectively, and Tables S6 and S7 for statistical analysis of C.
Fig. 4.
Fig. 4.
Inhibition of β-cell proliferation by ADRA2A. (A) mRNA encoding Gi-GPCRs expressed by mouse β cells at E18.5 are listed in order of expression level measured by RT-PCR relative to Actb/1000. The last column shows the expression level in adult mouse β cells as determined by sequencing expressed in RPKM (62). For complete data on expression of GPCR and related mRNAs, see Tables S8, S9, and S10. (B) The replication rate in β cells at day P1 from Adra2a+/− (n = 6) and Adra−/− (n = 6) mice was measured by determining the percentage of β cells in the G2 and M phases of the cell cycle by flow cytometry. (C and E) Adult mouse islets were cultured with the drugs shown and labeled with EdU before harvesting. The replication rate in β cells was calculated as the percent of cells costaining for the β-cell nuclear marker. (D) A pancreatic section from a mouse embryo at E17.5 was stained for tyrosine hydroxylase (TH, green), the β-cell nuclear marker Pdx1 (red), and the nuclear DNA stain DAPI (blue). (Scale bar, 50 µm.) *P < 0.05 and ***P < 0.001 vs. control Adra2a+/− animals (B) or vs. cells treated with guanfacine alone (C) by two-tailed Student’s t test.

References

    1. Wettschureck N, Offermanns S. Mammalian G proteins and their cell type specific functions. Physiol Rev. 2005;85(4):1159–1204. - PubMed
    1. Overington JP, Al-Lazikani B, Hopkins AL. How many drug targets are there? Nat Rev Drug Discov. 2006;5(12):993–996. - PubMed
    1. Ahrén B. Islet G protein-coupled receptors as potential targets for treatment of type 2 diabetes. Nat Rev Drug Discov. 2009;8(5):369–385. - PubMed
    1. Thompson MD, Percy ME, McIntyre Burnham W, Cole DE. G protein-coupled receptors disrupted in human genetic disease. Methods Mol Biol. 2008;448:109–137. - PubMed
    1. Rosengren AH, et al. Overexpression of alpha2A-adrenergic receptors contributes to type 2 diabetes. Science. 2010;327(5962):217–220. - PubMed

Publication types

MeSH terms

Substances