

Photodynamic therapy-mediated cancer vaccination enhances stem-like phenotype and immune escape, which can be blocked by thrombospondin-1 signaling through CD47 receptor protein
- PMID: 25697354
- PMCID: PMC4423687
- DOI: 10.1074/jbc.M114.624965
Photodynamic therapy-mediated cancer vaccination enhances stem-like phenotype and immune escape, which can be blocked by thrombospondin-1 signaling through CD47 receptor protein
Abstract
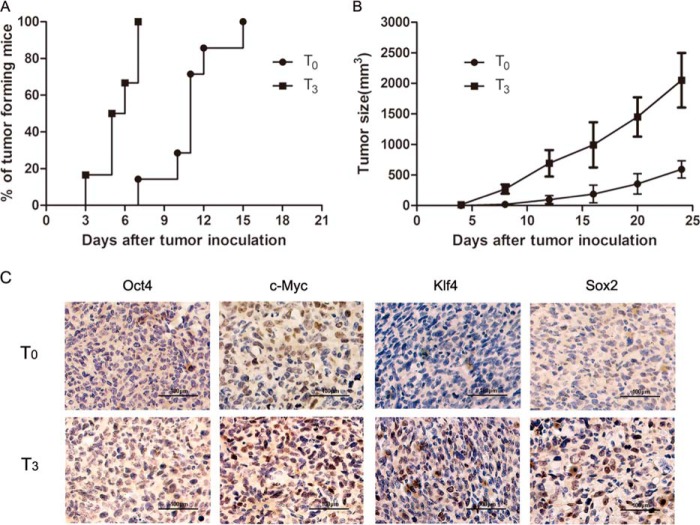
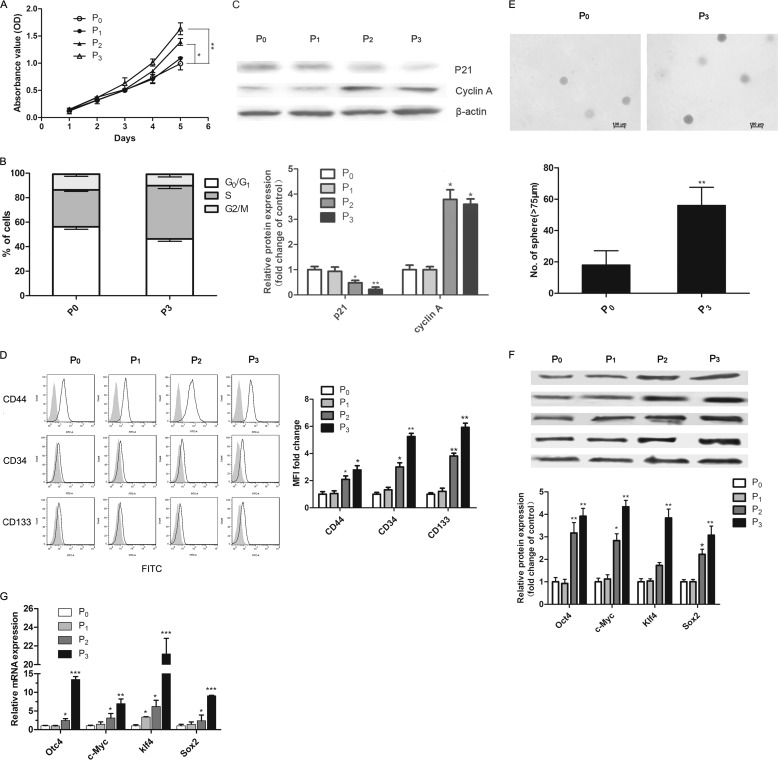
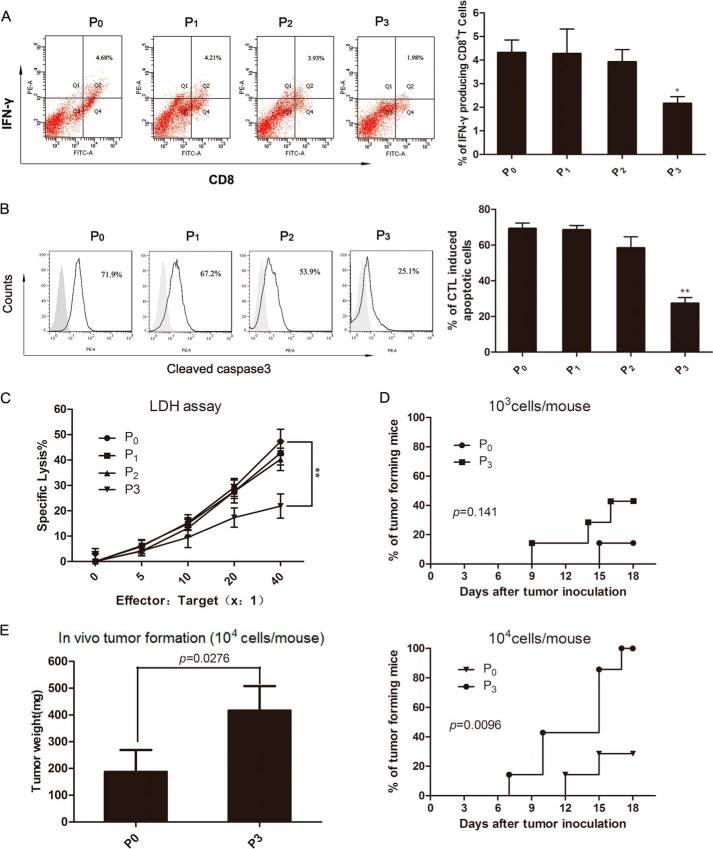
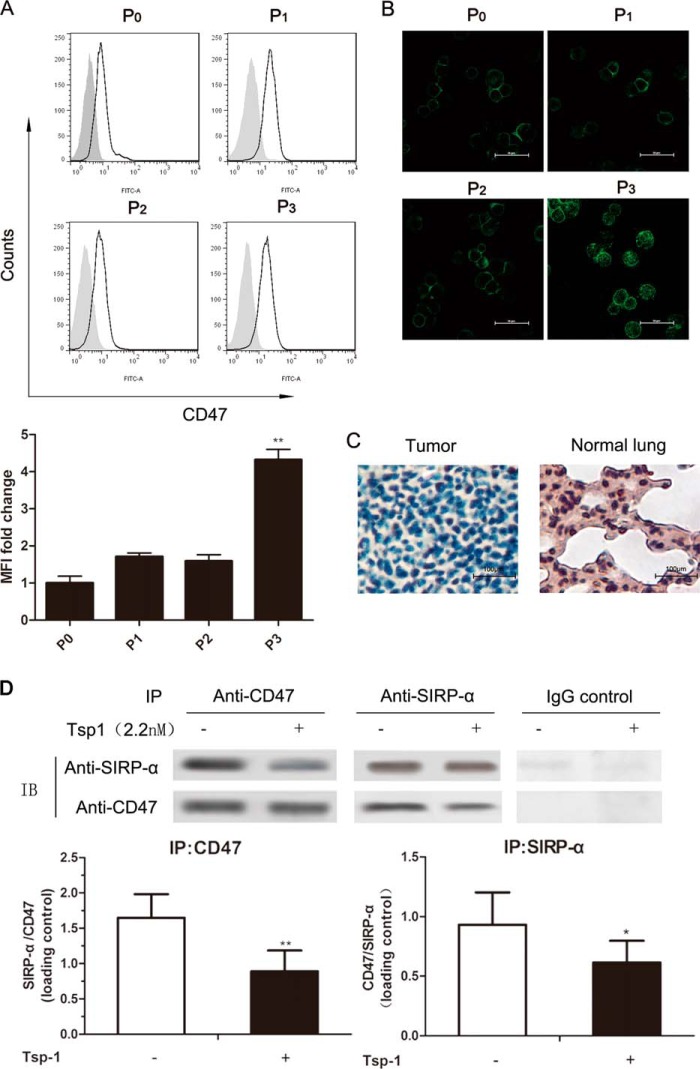
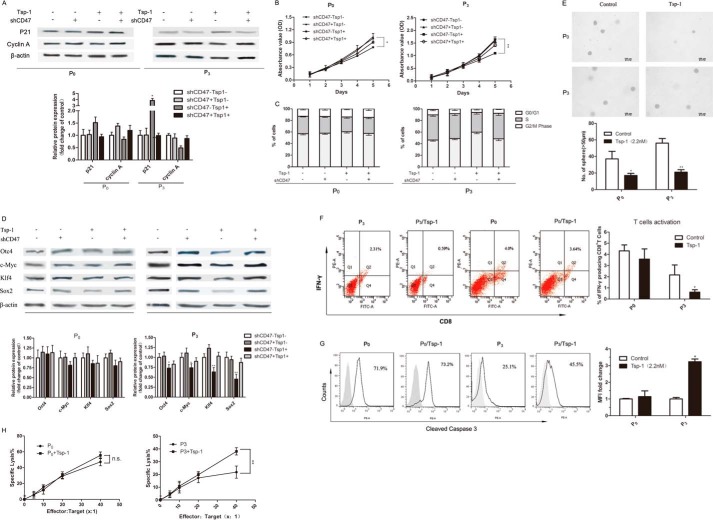
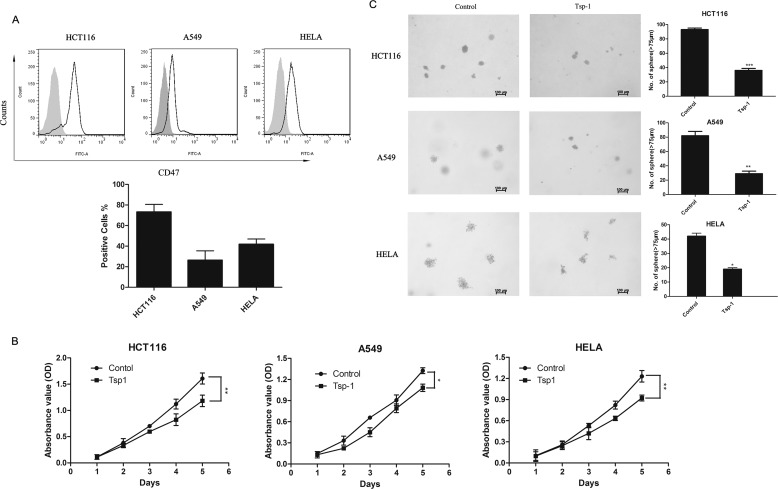
Like most of the strategies for cancer immunotherapy, photodynamic therapy-mediated vaccination has shown poor clinical outcomes in application. The aim of this study is to offer a glimpse at the mechanisms that are responsible for the failure based on cancer immuno-editing theory and to search for a positive solution. In this study we found that tumor cells were able to adapt themselves to the immune pressure exerted by vaccination. The survived tumor cells exhibited enhanced tumorigenic and stem-like phenotypes as well as undermined immunogenicity. Viewed as a whole, immune-selected tumor cells showed more malignant characteristics and the ability of immune escape, which might contribute to the eventual relapse. Thrombospondin-1 signaling via CD47 helped prevent tumor cells from becoming stem-like and rendered them vulnerable to immune attack. These findings prove that the TSP-1/CD47/SIRP-α signal axis is important to the evolution of tumor cells in the microenvironment of immunotherapy and identify thrombospondin-1 as a key signal with therapeutic benefits in overcoming long term relapse, providing new evidence for the clinical promise of cancer vaccination.
Keywords: CD47; Cancer Stem Cells; Immunotherapy; Photodynamic Therapy; Tumor Immunology; Tumor Microenvironment.
© 2015 by The American Society for Biochemistry and Molecular Biology, Inc.
Figures
Similar articles
-
Divergent modulation of normal and neoplastic stem cells by thrombospondin-1 and CD47 signaling.Int J Biochem Cell Biol. 2016 Dec;81(Pt A):184-194. doi: 10.1016/j.biocel.2016.05.005. Epub 2016 May 6. Int J Biochem Cell Biol. 2016. PMID: 27163531 Free PMC article. Review.
-
Inducing Tumor Suppressive Microenvironments through Genome Edited CD47-/- Syngeneic Cell Vaccination.Sci Rep. 2019 Dec 27;9(1):20057. doi: 10.1038/s41598-019-56370-6. Sci Rep. 2019. PMID: 31882679 Free PMC article.
-
Targeting CD47 in Anaplastic Thyroid Carcinoma Enhances Tumor Phagocytosis by Macrophages and Is a Promising Therapeutic Strategy.Thyroid. 2019 Jul;29(7):979-992. doi: 10.1089/thy.2018.0555. Epub 2019 May 10. Thyroid. 2019. PMID: 30938231 Free PMC article.
-
Durable antitumor responses to CD47 blockade require adaptive immune stimulation.Proc Natl Acad Sci U S A. 2016 May 10;113(19):E2646-54. doi: 10.1073/pnas.1604268113. Epub 2016 Apr 18. Proc Natl Acad Sci U S A. 2016. PMID: 27091975 Free PMC article.
-
CD47: role in the immune system and application to cancer therapy.Cell Oncol (Dordr). 2020 Feb;43(1):19-30. doi: 10.1007/s13402-019-00469-5. Epub 2019 Aug 14. Cell Oncol (Dordr). 2020. PMID: 31485984 Review.
Cited by
-
Divergent modulation of normal and neoplastic stem cells by thrombospondin-1 and CD47 signaling.Int J Biochem Cell Biol. 2016 Dec;81(Pt A):184-194. doi: 10.1016/j.biocel.2016.05.005. Epub 2016 May 6. Int J Biochem Cell Biol. 2016. PMID: 27163531 Free PMC article. Review.
-
Enhancing the Efficacy of CAR T Cells in the Tumor Microenvironment of Pancreatic Cancer.Cancers (Basel). 2020 May 28;12(6):1389. doi: 10.3390/cancers12061389. Cancers (Basel). 2020. PMID: 32481570 Free PMC article. Review.
-
Original insights on thrombospondin-1-related antireceptor strategies in cancer.Front Pharmacol. 2015 Oct 29;6:252. doi: 10.3389/fphar.2015.00252. eCollection 2015. Front Pharmacol. 2015. PMID: 26578962 Free PMC article. Review.
-
Non-Cytotoxic Photodynamic Therapy with Talaporfin Sodium Reduces the Expression of CXCR4 and Enhances Chemotherapeutic Efficacy in Undifferentiated Gastric Cancer Cell Line HGC27.Acta Histochem Cytochem. 2025 Apr 26;58(2):69-79. doi: 10.1267/ahc.25-00002. Epub 2025 Apr 9. Acta Histochem Cytochem. 2025. PMID: 40535467 Free PMC article.
-
Current Strategies for Tumor Photodynamic Therapy Combined With Immunotherapy.Front Oncol. 2021 Nov 17;11:738323. doi: 10.3389/fonc.2021.738323. eCollection 2021. Front Oncol. 2021. PMID: 34868932 Free PMC article. Review.
References
-
- Liu T., Wu L. Y., Choi J. K., Berkman C. E. (2010) Targeted photodynamic therapy for prostate cancer: inducing apoptosis via activation of the caspase-8/-3 cascade pathway. Int. J. Oncol. 36, 777–784 - PubMed
-
- Garg A. D., Nowis D., Golab J., Agostinis P. (2010) Photodynamic therapy: illuminating the road from cell death towards anti-tumour immunity. Apoptosis 15, 1050–1071 - PubMed
Publication types
MeSH terms
Substances
LinkOut - more resources
Full Text Sources
Research Materials
Miscellaneous
