. 2015 Mar 27;290(13):8348-59.
doi: 10.1074/jbc.M114.618769. Epub 2015 Feb 19.

Rewired metabolism in drug-resistant leukemia cells: a metabolic switch hallmarked by reduced dependence on exogenous glutamine

Affiliations

Rewired metabolism in drug-resistant leukemia cells: a metabolic switch hallmarked by reduced dependence on exogenous glutamine

Claudia Stäubert et al. J Biol Chem. .

Abstract

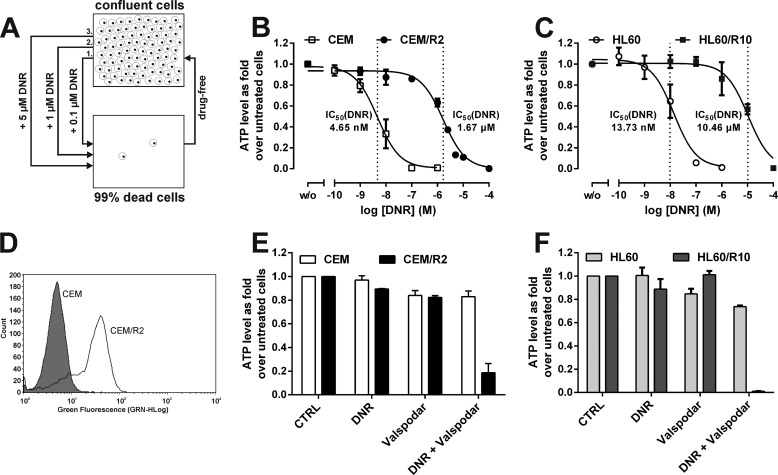
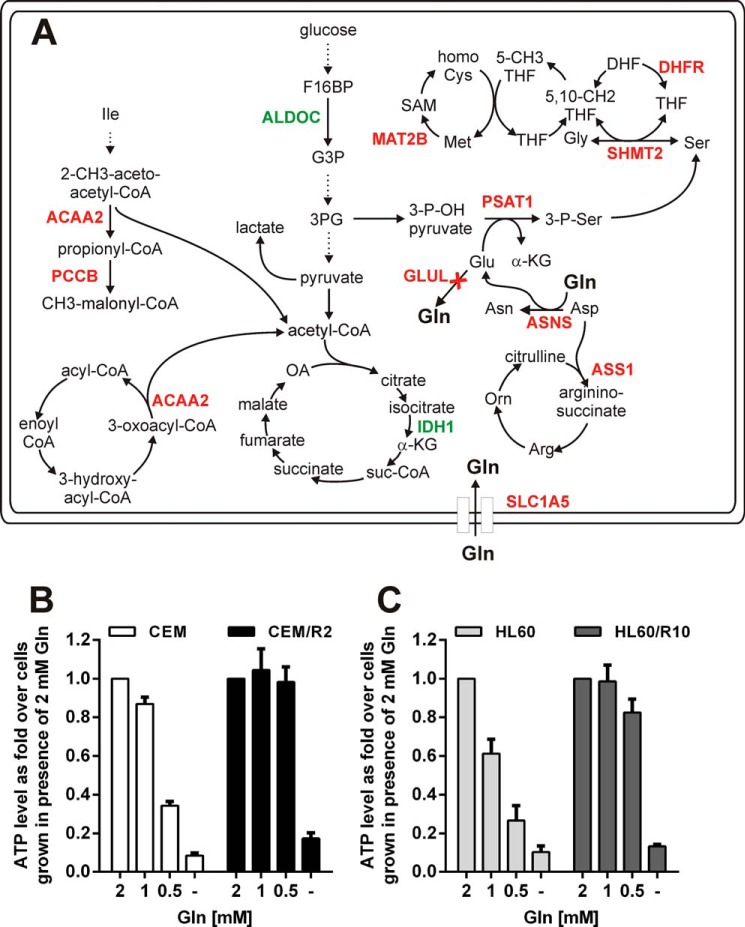
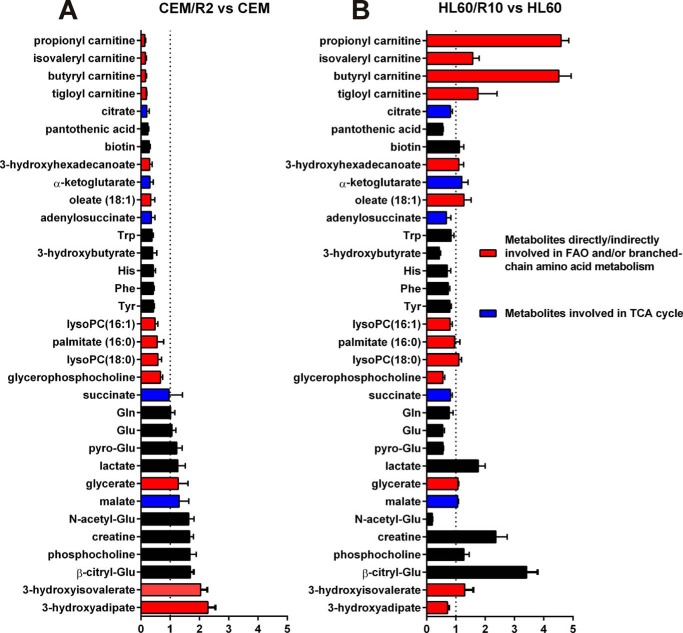
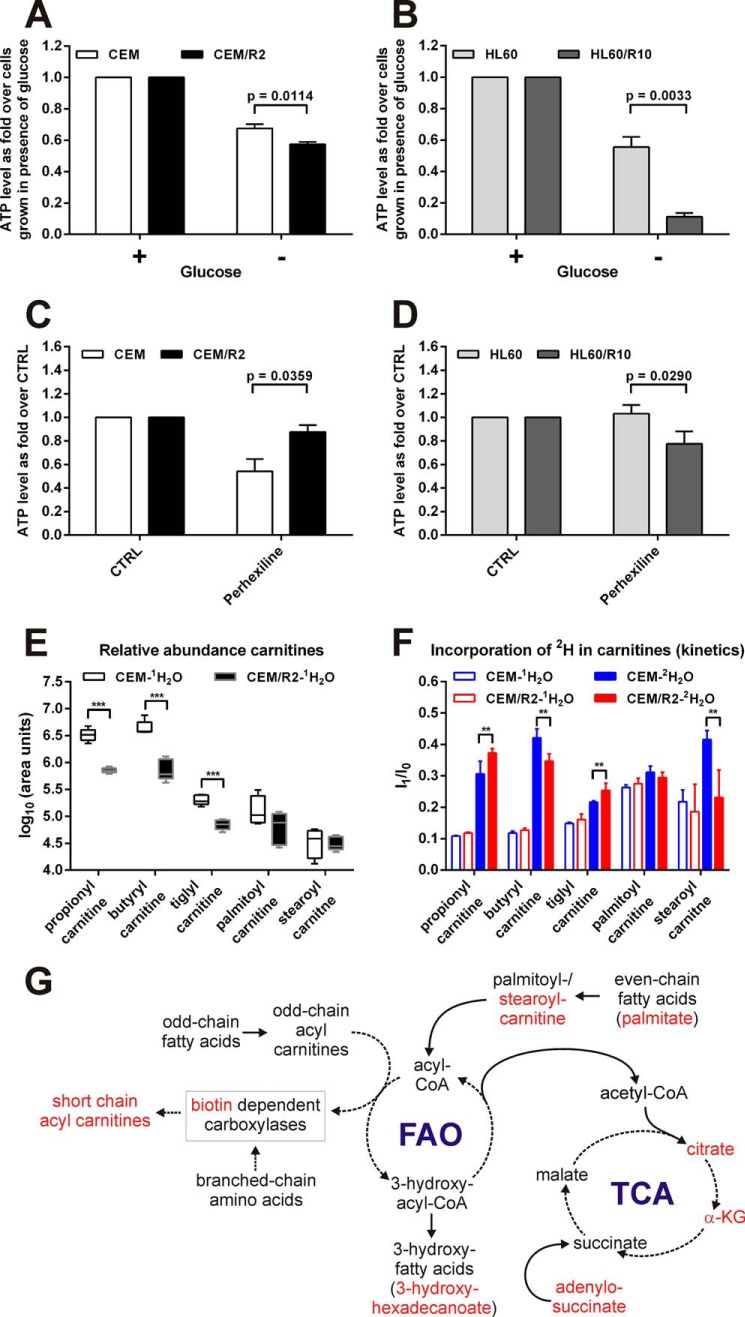
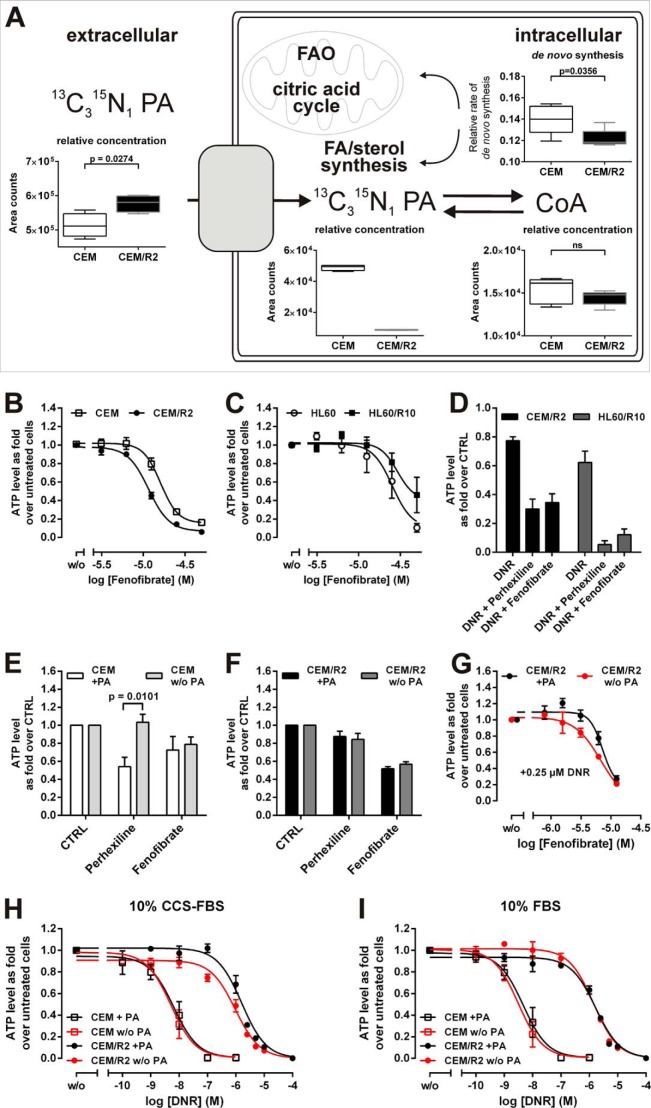
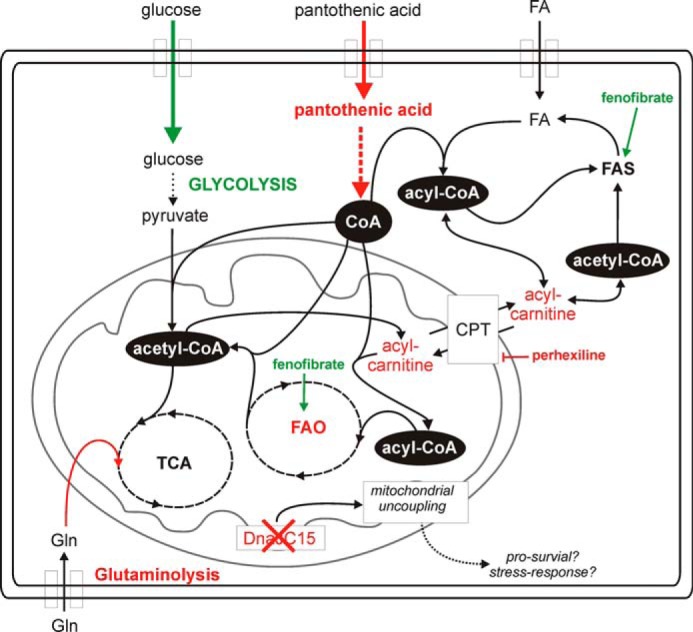
Cancer cells that escape induction therapy are a major cause of relapse. Understanding metabolic alterations associated with drug resistance opens up unexplored opportunities for the development of new therapeutic strategies. Here, we applied a broad spectrum of technologies including RNA sequencing, global untargeted metabolomics, and stable isotope labeling mass spectrometry to identify metabolic changes in P-glycoprotein overexpressing T-cell acute lymphoblastic leukemia (ALL) cells, which escaped a therapeutically relevant daunorubicin treatment. We show that compared with sensitive ALL cells, resistant leukemia cells possess a fundamentally rewired central metabolism characterized by reduced dependence on glutamine despite a lack of expression of glutamate-ammonia ligase (GLUL), a higher demand for glucose and an altered rate of fatty acid β-oxidation, accompanied by a decreased pantothenic acid uptake capacity. We experimentally validate our findings by selectively targeting components of this metabolic switch, using approved drugs and starvation approaches followed by cell viability analyses in both the ALL cells and in an acute myeloid leukemia (AML) sensitive/resistant cell line pair. We demonstrate how comparative metabolomics and RNA expression profiling of drug-sensitive and -resistant cells expose targetable metabolic changes and potential resistance markers. Our results show that drug resistance is associated with significant metabolic costs in cancer cells, which could be exploited using new therapeutic strategies.

Keywords: Drug Resistance; Glutamine; Glycolysis; Leukemia; Mass Spectrometry (MS); Metabolism; Metabolomics; Transcriptomics; β-Oxidation.


Figures

FIGURE 1.
FIGURE 1.
CEM/R2 cells are resistant to DNR but can be sensitized with the P-gp inhibitor valspodar. A, a DNR-resistant ALL cell line was obtained by applying a three-step selection process involving increasing DNR concentrations to the ALL cell line CCRF-CEM (CEM). B, CEM/R2 cells are about 360-fold more resistant toward DNR than CEM cells (n = 3). C, HL60/R10 cells are about 760-fold more resistant toward DNR than HL60 cells (n = 3). D, P-gp is expressed much more strongly in CEM/R2 (clear) than in CEM cells (shaded) as measured by FACS. E, CEM and CEM/R2 cells were treated with 0.25 μm valspodar alone and/or in combination with DNR (1 nm and 0.5 μm for CEM and CEM/R2, respectively; n = 2). F, HL60 and HL60/R10 cells were treated with 0.25 μm valspodar alone and/or in combination with DNR (5 nm and 5 μm for HL60 and HL60/R10, respectively; n = 2). B, C, E, and F, data shown as mean ± S.E.
FIGURE 2.
FIGURE 2.
CEM/R2 cells are less dependent on glutamine despite their lack of GLUL and lower levels of transcripts encoding proteins linked to Gln/Glu metabolism. A, transcriptional differences between CEM and CEM/R2 cells in central metabolic pathways, as detected by RNAseq. Genes indicated in red and green are down- and up-regulated, respectively, at the mRNA level in CEM/R2 cells. Viability of CEM and CEM/R2 (B) or HL60 and HL60/R10 (C) cells grown for 72 h in media containing decreasing concentrations of glutamine (n = 3). Data shown as mean ± S.E.; p values were determined using a two-tailed unpaired t test.
FIGURE 3.
FIGURE 3.
Metabolites with the largest fold-change differences measured by LC-MS when comparing CEM/R2 versus CEM and HL60/R10 versus HL60. TCA intermediates are shown in blue, whereas metabolites that are directly or indirectly involved in fatty acid metabolism are highlighted in red. The LC-MS response (i.e. peak height) for each metabolite is set to 1 for CEM and HL60 cells and compared with the response for the corresponding resistant cell line. Data of one experiment are presented as mean ± S.D. (5 technical replicates).
FIGURE 4.
FIGURE 4.
Resistant leukemia cells are more vulnerable to glucose deprivation and differentially affected by carnitine palmitoyltransferase inhibitor perhexiline. Viability of CEM and CEM/R2 (A) (n = 5) or HL60 and HL60/R10 (B) (n = 3) cells that were grown for 72 h in RPMI with or without glucose. C, effect of 2.5 μm perhexiline on CEM and CEM/R2 viability (n = 4). D, effect of 5 μm perhexiline on HL60 and HL60/R10 cell viability (n = 3). A–D, cells were incubated for 72 h. Data shown as mean ± S.E. E, abundance (log10 of area units) for selected carnitines is shown in a box-and-whiskers plot (box represents 95% confidence interval, whiskers extend from the smallest to largest value and the line in the boxes represent the median of 5 technical replicates). F, de novo formation of selected carnitines estimated by growth in 2H2O medium. Ratio values represent isotopomer 1 (I1) over isotopomer 0 (I0) after 24 h growth in 2H/1H medium. Filled boxes are I1/I0 values from cells grown in 2H medium and open boxes are I1/I0 values representing cells grown in 1H medium. Data are presented as mean ± S.D. of 5 technical replicates. G, model for alteration in FAO/branched chain amino acid metabolism in resistant compared with sensitive cells. Highlighted in red are metabolites that exhibit a lower relative concentration or turnover rate in CEM/R2 (Figs. 3 and 4, E and F). A–F, p values were determined using a two-tailed unpaired t test. **, p ≤ 0.01; ***, p ≤ 0.001.
FIGURE 5.
FIGURE 5.
CEM/R2 cells exhibit a decreased pantothenic acid uptake capacity, a higher sensitivity to fenofibrate, and co-administration of fenofibrate or perhexiline together with PA restriction sensitizes resistant cells to DNR treatment. A, stable isotope-labeled 13C315N1 PA was added to medium to trace PA uptake and intracellular PA/CoA concentrations as well as de novo CoA synthesis (top). Fenofibrate curves for CEM and CEM/R2 (B) (n = 5) or HL60 and HL60/R10 cells (C) (n = 3). D, effect of co-administration of fenofibrate (10 μm for CEM/R2, 20 μm for HL60/R10) or perhexiline (2.5 μm for CEM/R2, 5 μm for HL60/R10) with DNR (0.5 μm for CEM/R2, 5 μm for HL60/R10) (n = 4). CEM (E) (n = 5) or CEM/R2 (F) cells (n = 4) were treated with 10 μm fenofibrate or 2.5 μm perhexiline in the absence and presence of PA. G, CEM/R2 cells are more sensitive to fenofibrate in the presence of 0.25 μm DNR when PA availability is decreased (n = 3). B–G, cells were incubated for 72 h. H, reduced availability of PA in the presence of 10% CCS increases the sensitivity of CEM/R2 cells but not CEM cells toward DNR (I) but has no effect on either cell line in the presence of 10% FBS. H and I, Cells were incubated for 48 h (n = 3). Data shown as mean ± S.E.; p values were determined using a two-tailed unpaired t test.
FIGURE 6.
FIGURE 6.
The metabolic rewiring of resistant leukemia cells. Resistant cells depend more on glycolysis and TCA but less on FAO and glutaminolysis. A reduced pantothenic acid uptake capacity might be central to this phenotype because of the importance of PA in allowing cells to maintain adequate CoA levels. The loss of DNAJC15 expression might also reflect a pro-survival signal mediated through a mitochondrial uncoupling mechanism. Green, up-regulated/activation. Red, down-regulated/inhibition.

Similar articles

Cited by

References

    1. Mullighan C. G., Phillips L. A., Su X., Ma J., Miller C. B., Shurtleff S. A., Downing J. R. (2008) Genomic analysis of the clonal origins of relapsed acute lymphoblastic leukemia. Science 322, 1377–1380 - PMC - PubMed
    1. Haffner M. C., Mosbruger T., Esopi D. M., Fedor H., Heaphy C. M., Walker D. A., Adejola N., Gürel M., Hicks J., Meeker A. K., Halushka M. K., Simons J. W., Isaacs W. B., De Marzo A. M., Nelson W. G., Yegnasubramanian S. (2013) Tracking the clonal origin of lethal prostate cancer. J. Clin. Investig. 123, 4918–4922 - PMC - PubMed
    1. Clappier E., Gerby B., Sigaux F., Delord M., Touzri F., Hernandez L., Ballerini P., Baruchel A., Pflumio F., Soulier J. (2011) Clonal selection in xenografted human T cell acute lymphoblastic leukemia recapitulates gain of malignancy at relapse. J. Exp. Med. 208, 653–661 - PMC - PubMed
    1. Zahreddine H., Borden K. L. (2013) Mechanisms and insights into drug resistance in cancer. Front. Pharmacol. 4, 28. - PMC - PubMed
    1. Greaves M., Maley C. C. (2012) Clonal evolution in cancer. Nature 481, 306–313 - PMC - PubMed

Publication types

MeSH terms

LinkOut - more resources