Review
. 2015 May:77-78:125-35.
doi: 10.1016/j.ymeth.2015.02.004. Epub 2015 Feb 16.

Biophysical methods for the characterization of PTEN/lipid bilayer interactions

Affiliations
Review

Biophysical methods for the characterization of PTEN/lipid bilayer interactions

Rakesh K Harishchandra et al. Methods. 2015 May.

Abstract

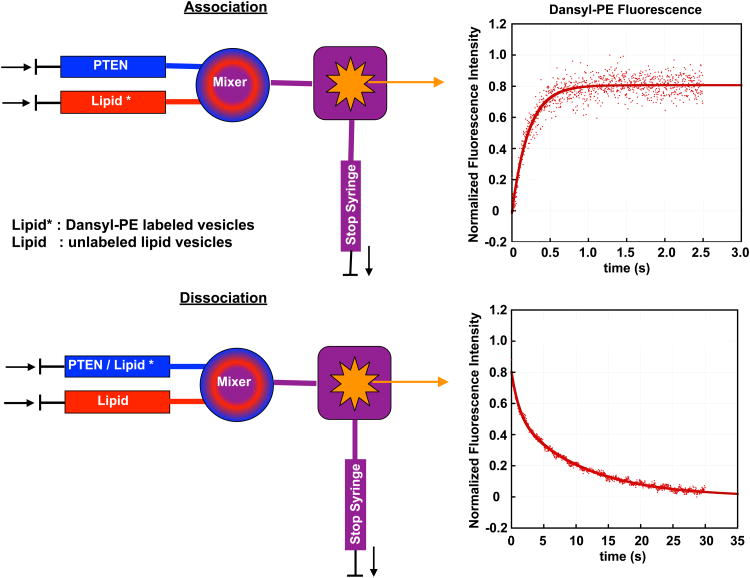
PTEN, a tumor suppressor protein that dephosphorylates phosphoinositides at the 3-position of the inositol ring, is a cytosolic protein that needs to associate with the plasma membrane or other subcellular membranes to exert its lipid phosphatase function. Upon membrane association PTEN interacts with at least three different lipid entities: An anionic lipid that is present in sufficiently high concentration to create a negative potential that allows PTEN to interact electrostatically with the membrane, phosphatidylinositol-4,5-bisphosphate, which interacts with PTEN's N-terminal end and the substrate, usually phosphatidylinositol-3,4,5-trisphosphate. Many parameters influence PTEN's interaction with the lipid bilayer, for example, the lateral organization of the lipids or the presence of other chemical species like cholesterol or other lipids. To investigate systematically the different steps of PTEN's complex binding mechanism and to explore its dynamic behavior in the membrane bound state, in vitro methods need to be employed that allow for a systematic variation of the experimental conditions. In this review we survey a variety of methods that can be used to assess PTEN lipid binding affinity, the dynamics of its membrane association as well as its dynamic behavior in the membrane bound state.

Keywords: Conformational change; PTEN; Peripheral membrane protein; Phosphatase; Single-particle tracking; Spectroscopy.


Figures

Figure 1
Figure 1
Principle of stopped-flow fluorescence experiment. Top: The kinetics of PTEN binding is investigated by mixing PTEN with dansyl-PE labeled lipid vesicles. TRP and Dansyl form a FRET pair and the PTEN bilayer association can be followed by monitoring either the decrease of the TRP or the increase of the dansyl fluorescence (shown here). Bottom: The kinetics of PTEN bilayer dissociation is followed by mixing PTEN bound to labeled lipid vesicles with an excess of unlabeled lipid vesicles (except for the labeled lipid, both types of lipid vesicles have the same lipid composition).
Figure 2
Figure 2
Kinetics of PTEN binding to lipid vesicles. (A) Time dependent increase of dansyl-PE fluorescence intensity for the association of wt PTEN with different concentrations of 100 nm unilamellar vesicles composed of 98% POPS/2% dansyl-PE. Buffer: 150 mM NaCl, 10 mM Hepes, 0.1 mM EDTA, 1 mM DTT. T=20°C. (B) Observed rate constant kobs as a function of POPS concentration. The rate constant kobs is obtained by using equation (1) to fit the time dependent fluorescence intensities (Figure 2A) for the respective lipid concentrations. The slope of the line is kon. (C) Time dependent decrease of dansyl-PE fluorescence intensity for the dissociation of wt PTEN from labeled unilamellar vesicles composed of 98% POPS/2% dansyl-PE. The PTEN/labeled vesicle complex is mixed with a 20 fold excess of unlabeled POPS (100%) vesicles. Buffer: 150 mM NaCl, 10 mM Hepes, 0.1 mM EDTA, 1 mM DTT, T=20°C. The data were fitted with the equation F=Fmina1ekoff1ta2ekoff2t koff1= 0.17 s-1; koff2= 2.2s-1. The process associated with koff2 is a very slow process leading to a decline of the fluorescence intensity over a time period of more than 1000s. We attribute this intensity decrease to a settling of the vesicles. koff1 is the rate constant associated with the dissociation of PTEN.
Figure 2
Figure 2
Kinetics of PTEN binding to lipid vesicles. (A) Time dependent increase of dansyl-PE fluorescence intensity for the association of wt PTEN with different concentrations of 100 nm unilamellar vesicles composed of 98% POPS/2% dansyl-PE. Buffer: 150 mM NaCl, 10 mM Hepes, 0.1 mM EDTA, 1 mM DTT. T=20°C. (B) Observed rate constant kobs as a function of POPS concentration. The rate constant kobs is obtained by using equation (1) to fit the time dependent fluorescence intensities (Figure 2A) for the respective lipid concentrations. The slope of the line is kon. (C) Time dependent decrease of dansyl-PE fluorescence intensity for the dissociation of wt PTEN from labeled unilamellar vesicles composed of 98% POPS/2% dansyl-PE. The PTEN/labeled vesicle complex is mixed with a 20 fold excess of unlabeled POPS (100%) vesicles. Buffer: 150 mM NaCl, 10 mM Hepes, 0.1 mM EDTA, 1 mM DTT, T=20°C. The data were fitted with the equation F=Fmina1ekoff1ta2ekoff2t koff1= 0.17 s-1; koff2= 2.2s-1. The process associated with koff2 is a very slow process leading to a decline of the fluorescence intensity over a time period of more than 1000s. We attribute this intensity decrease to a settling of the vesicles. koff1 is the rate constant associated with the dissociation of PTEN.
Figure 3
Figure 3
TIRF single molecule images. A. TIRF image showing 200 pM of wt PTEN-AF647 molecules bound to the supported lipid bilayer composed of DOPC/DOPS (70:30). B. Single molecule trajectories of wt PTEN-AF647 on DOPC/DOPS membrane acquired with an exposure of 30 ms/frame. Measurements were performed at room temperature in a near physiological buffer (20 mM HEPES, 140 mM KCl, 15 mM NaCl, pH 7.5).
Figure 4
Figure 4
Diffusion analysis of wt PTEN bound to a DOPC/DOPS (70:30) solid supported lipid bilayer. (A) Plot of the mean square displacement 〈r2〉 versus time interval (8 frames, 0.24s) (B) Probability distribution histogram of diffusion coefficients generated from individual trajectories.

Similar articles

Cited by

References

    1. Worby CA, Dixon JE. Annu Rev Biochem. 2014;83:641–669. - PubMed
    1. Liu F, Wagner S, Campbell RB, Nickerson JA, Schiffer CA, Ross AH. J Cell Biochem. 2005;96:221–234. - PubMed
    1. Vazquez F, Grossman SR, Takahashi Y, Rokas MV, Nakamura N, Sellers WR. J Biol Chem. 2001;276:48627–48630. - PubMed
    1. Vazquez F, Ramaswamy S, Nakamura N, Sellers WR. Mol Cell Biol. 2000;20:5010–5018. - PMC - PubMed
    1. Bolduc D, Rahdar M, Tu-Sekine B, Sivakumaren SC, Raben D, Amzel LM, Devreotes P, Gabelli SB, Cole P. eLife. 2013;2:e00691. - PMC - PubMed

Publication types

MeSH terms

LinkOut - more resources