. 2015 Apr;66(7):1817-32.
doi: 10.1093/jxb/eru526. Epub 2015 Feb 19.

Utilization of a high-throughput shoot imaging system to examine the dynamic phenotypic responses of a C4 cereal crop plant to nitrogen and water deficiency over time

Affiliations

Utilization of a high-throughput shoot imaging system to examine the dynamic phenotypic responses of a C4 cereal crop plant to nitrogen and water deficiency over time

E H Neilson et al. J Exp Bot. 2015 Apr.

Abstract

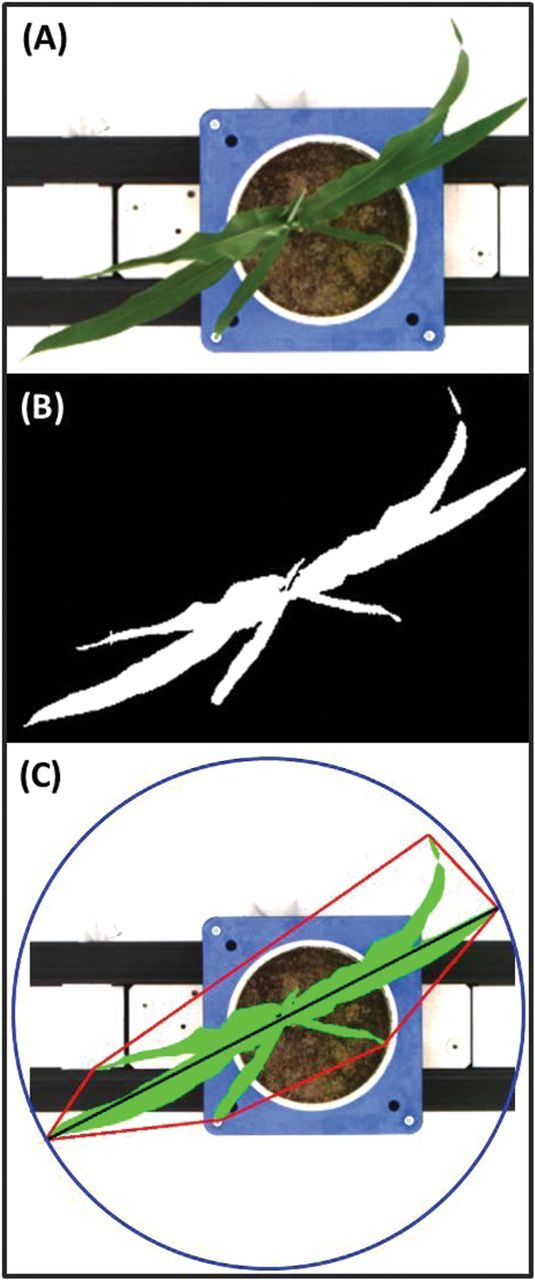
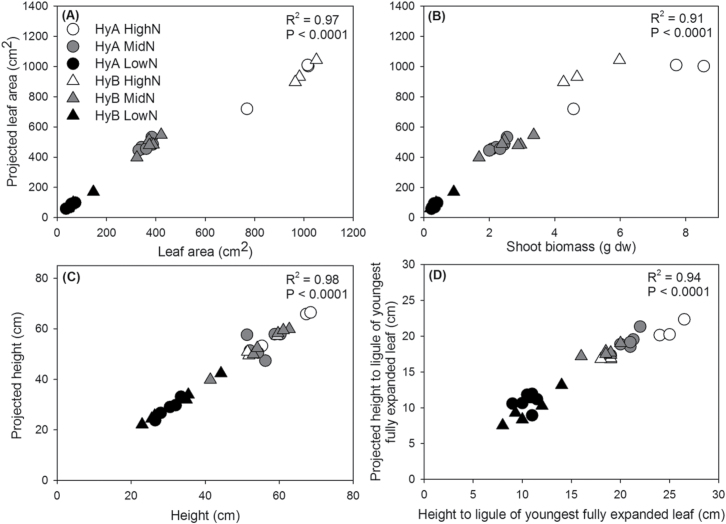
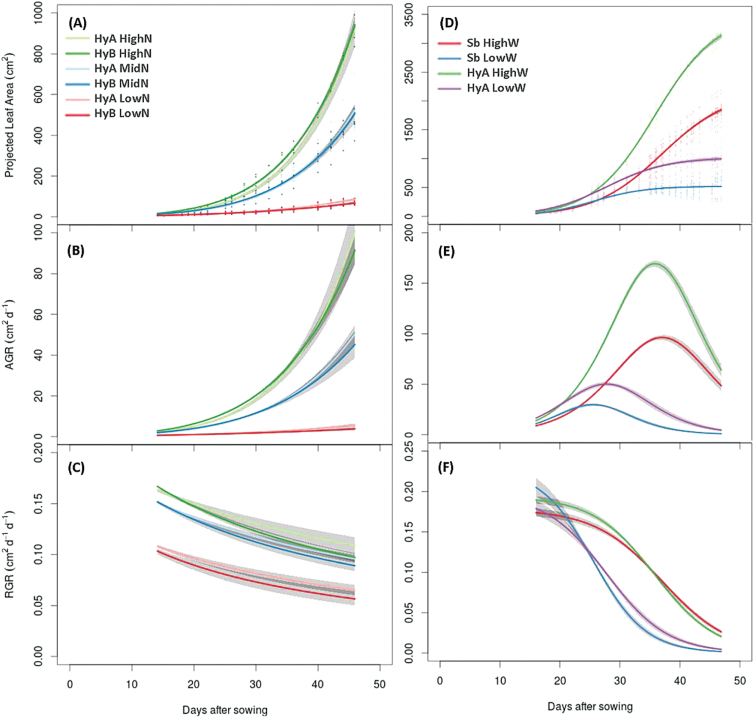
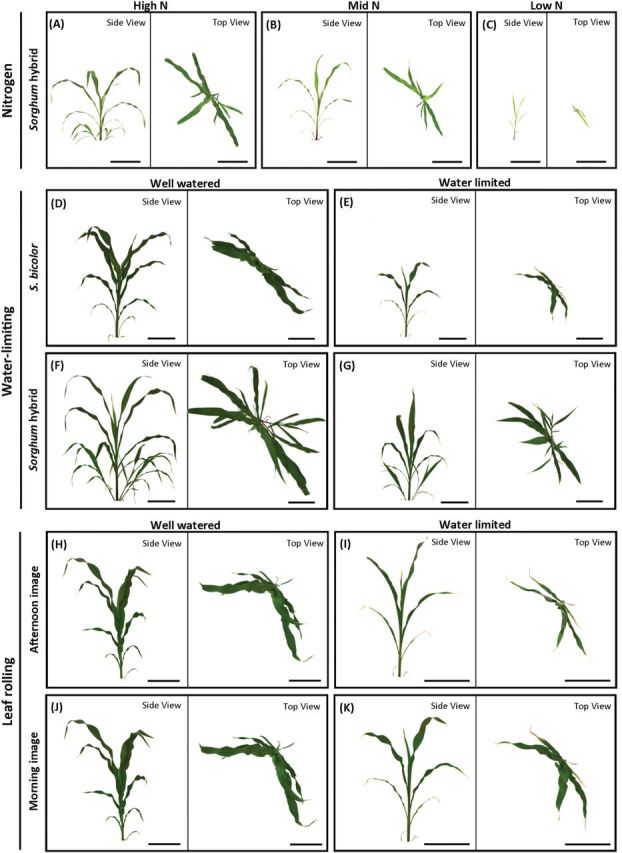
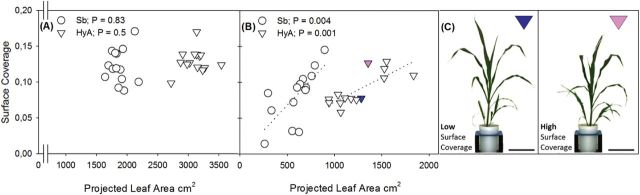
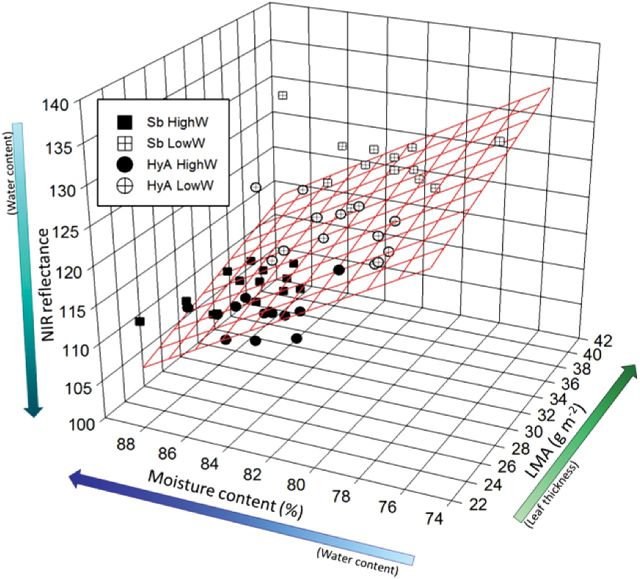
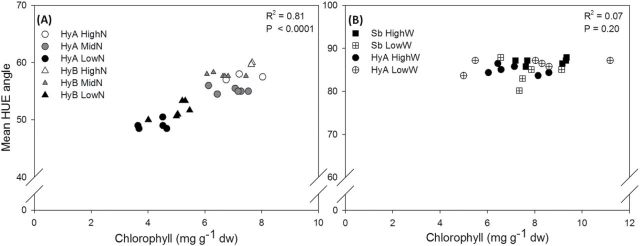
The use of high-throughput phenotyping systems and non-destructive imaging is widely regarded as a key technology allowing scientists and breeders to develop crops with the ability to perform well under diverse environmental conditions. However, many of these phenotyping studies have been optimized using the model plant Arabidopsis thaliana. In this study, The Plant Accelerator(®) at The University of Adelaide, Australia, was used to investigate the growth and phenotypic response of the important cereal crop, Sorghum bicolor L. Moench and related hybrids to water-limited conditions and different levels of fertilizer. Imaging in different spectral ranges was used to monitor plant composition, chlorophyll, and moisture content. Phenotypic image analysis accurately measured plant biomass. The data set obtained enabled the responses of the different sorghum varieties to the experimental treatments to be differentiated and modelled. Plant architectural instead of architecture elements were determined using imaging and found to correlate with an improved tolerance to stress, for example diurnal leaf curling and leaf area index. Analysis of colour images revealed that leaf 'greenness' correlated with foliar nitrogen and chlorophyll, while near infrared reflectance (NIR) analysis was a good predictor of water content and leaf thickness, and correlated with plant moisture content. It is shown that imaging sorghum using a high-throughput system can accurately identify and differentiate between growth and specific phenotypic traits. R scripts for robust, parsimonious models are provided to allow other users of phenomic imaging systems to extract useful data readily, and thus relieve a bottleneck in phenotypic screening of multiple genotypes of key crop plants.

Keywords: Cyanogenesis; LemnaTec Scanalyzer; Sorghum.; drought; growth; nitrogen deficiency; phenomics.


Figures

Fig. 1.
Fig. 1.
Example of image processing methods and derivation of geometric parameters. First, the foreground and background are separated in the raw image, as taken from above (A), using a nearest-neighbour colour classification, resulting in a binary image (B). Thereafter, the object (highlighted green; C) undergoes geometric measurements, such as calliper length (black line), convex hull (red line), and minimum enclosing circle (blue line). Compactness and surface coverage are measures of leaf coverage and are the ratio of object area (green) and convex hull or minimum enclosing circle area, respectively.
Fig. 2.
Fig. 2.
Relationship between measured leaf area (A), shoot biomass (B), plant height (C), and height to the ligule of the youngest fully expanded leaf (D) with projected measurements calculated from image analysis. Projected leaf area provides a strong indication of overall plant growth with a significant, positive correlation observed between projected and measured leaf area (R 2=0.97; y=0.94x+68.23) and above-ground biomass (R 2=0.91; y=138.69x+91.92). Projected height measurements positively correlated with plant height (R 2=0.98; y=0.98x–0.73) and height to ligule of the youngest fully expanded leaf (R 2=0.94; y=0.79x+2.24).
Fig. 3.
Fig. 3.
Calculated projected leaf area (A), absolute growth rate (B), and relative growth rate (C) for the non-asymptotic ‘nitrogen’ data set fitted with the power law model. Calculated projected leaf area (D), absolute growth rate (E), and relative growth rate (F) for the asymptotic ‘water-limited’ data set fitted with the three-parameter logistic model.
Fig. 4.
Fig. 4.
Images acquired of representative sorghum plants showing the effects of nitrogen deficiency (A–C) and water-limiting conditions (D–G) on plant architecture. Water limitation initiates leaf curling in sorghum plants, demonstrated by a 28% reduction in leaf area in drought-stressed plants (I, K) compared with a 4% increase in the control treatment (H, J). Scale bar=20cm.
Fig. 5.
Fig. 5.
Relationship between plant performance as represented by the projected leaf area and surface coverage in sorghum plants grown under well-watered (A) and water-limiting conditions (B). Under well-watered conditions, no correlation was observed in the S. bicolor (Sb; circle) or hybrid (HyA; triangle) varieties (P=0.83 and 0.5, respectively). A positive correlation was observed under water-limiting conditions for the Sb (P=0.004; R 2=0.51; y=1.41e–4 x–2.38e–3) and HyA varieties (P=0.001; R 2=0.61; y=6.76e–5 x+4.65e–3). Anatomical differences within the plant line that cannot be distinguished by visual inspection alone, demonstrated by two representative HyA individuals of similar leaf area (C), with one individual possessing a lower (blue) or higher (pink) surface coverage. Scale bar = 20 cm
Fig. 6.
Fig. 6.
Examination of the variation in near infrared (NIR) reflectance with moisture content and leaf mass per unit area (LMA). A multiple regression analysis was performed (grid lines) using the combined data for S. bicolor (Sb, squares) and hybrid (HyA, circles) and the control (black) and drought-stressed (cross) treatments. The equation for the multiple regression is: NIR=228.3+(0.55×LMA)–(1.52×% H2O); (R 2=0.55; P<0.001).
Fig. 7.
Fig. 7.
Relationship between mean hue angle and total chlorophyll concentration in sorghum. A significant correlation between mean hue angle and chlorophyll concentration within nitrogen treatments (A; P<0.0001; R 2=0.81; y=2.56x+37.58) but not for drought-induced stress (B; P=0.20; R 2=0.07; y=0.52x+81.25).

Similar articles

Cited by

References

    1. Archontoulis SV, Miguez FE. 2013. Nonlinear regression models and applications in agricultural research. Agronomy Journal 105, 1–13.
    1. Arvidsson S, Perez-Rodriguez P, Mueller-Roeber B. 2011. A growth phenotyping pipeline for Arabidopsis thaliana integrating image analysis and rosette area modeling for robust quantification of genotype effects. New Phytologist 191, 895–907. - PubMed
    1. Berger B, de Reft B, Tester M. 2012. High-throughput phenotyping of plant shoots. Methods in Molecular Biology 918, 9–20. - PubMed
    1. Berger B, Parent B, Tester M. 2010. High-throughput shoot imaging to study drought responses. Journal of Experimental Botany 61, 3519–3528. - PubMed
    1. Blum A, Mayer J, Golan G. 1989. Agronomic and physiological assessments of genotypic variation for drought resistance in sorghum. Australian Journal of Agricultural Research 40, 49–61.

Publication types