. 2015 Apr;66(7):2013-26.
doi: 10.1093/jxb/erv003. Epub 2015 Feb 19.

The identification of new cytosolic glutamine synthetase and asparagine synthetase genes in barley (Hordeum vulgare L.), and their expression during leaf senescence

Affiliations

The identification of new cytosolic glutamine synthetase and asparagine synthetase genes in barley (Hordeum vulgare L.), and their expression during leaf senescence

Liliana Avila-Ospina et al. J Exp Bot. 2015 Apr.

Abstract

Glutamine synthetase and asparagine synthetase are two master enzymes involved in ammonium assimilation in plants. Their roles in nitrogen remobilization and nitrogen use efficiency have been proposed. In this report, the genes coding for the cytosolic glutamine synthetases (HvGS1) and asparagine synthetases (HvASN) in barley were identified. In addition to the three HvGS1 and two HvASN sequences previously reported, two prokaryotic-like HvGS1 and three HvASN cDNA sequences were identified. Gene structures were then characterized, obtaining full genomic sequences. The response of the five HvGS1 and five HvASN genes to leaf senescence was then studied. Developmental senescence was studied using primary and flag leaves. Dark-exposure or low-nitrate conditions were also used to trigger stress-induced senescence. Well-known senescence markers such as the chlorophyll and Rubisco contents were monitored in order to characterize senescence levels in the different leaves. The three eukaryotic-like HvGS1_1, HvGS1_2, and HvGS1_3 sequences showed the typical senescence-induced reduction in gene expression described in many plant species. By contrast, the two prokaryotic-like HvGS1_4 and HvGS1_5 sequences were repressed by leaf senescence, similar to the HvGS2 gene, which encodes the chloroplast glutamine synthetase isoenzyme. There was a greater contrast in the responses of the five HvASN and this suggested that these genes are needed for N remobilization in senescing leaves only when plants are well fertilized with nitrate. Responses of the HvASN sequences to dark-induced senescence showed that there are two categories of asparagine synthetases, one induced in the dark and the other repressed by the same conditions.

Keywords: Asparagine synthetase; dark treatment; endoprotease; glutamine synthetase; nitrate..


Figures

Fig. 1.
Fig. 1.
Changes in chlorophyll and photosynthesis during leaf senescence in barley. (A, B) Leaves of plants grown under low (LN) and high (HN) nitrate conditions. (C, D) Leaves of plants submitted or not to dark treatment. T1: 4 d of dark treatment. T2: 3 d of recovering under day/night conditions after T1. CL (control untreated leaves: black and dark grey bars), DL (darkened leaves: white and light grey bars). (E) Flag leaves harvested at different time points after heading (from T0 to T7). DAS (days after sowing); GDD °C (growing degree days in °C). (F) Chlorophyll contents in flag leaves measured by SPAD (open circles) and spectrophotometer (solid squares). (G) Photosystem II efficiency (solid circles) and CO2 assimilation (open squares) in flag leaves. All data represent mean ±SD of 3–4 biological replicates. (B, D) The ns and the asterisks (*) indicate, respectively, the non-significant and significant differences between leaf (n+1) and leaf (n) in each treatment or growth condition. (D) The # symbol indicates the significant differences existing between each leaf rank of control and dark-treated plants at each time point. Significance was evaluated using a t test with P <0.05.
Fig. 2.
Fig. 2.
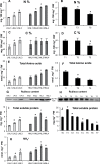
Changes in carbon, nitrogen, and nitrogen-containing compounds during leaf senescence. Leaf ranks of plants grown under low (LN; light grey) and high (HN; dark grey) (A, C, E, G, I, K) and flag leaves (B, D, F, H, J) were analysed. In flag leaves, only total protein (J) and Rubisco contents (H) were measured at eight time points (T0 to T7). Rubisco content was determined using antibodies against the barley Rubisco C-terminal. For gels, equal protein amounts were loaded in each lane. Experiments were repeated twice and gave similar results. Data represent mean ±SD of 3–4 biological replicates. (A, C, E, I, K) The asterisks (*) indicate significant differences between leaf (n+1) and leaf (n) under the same nitrate conditions. (B, D, F, J) The asterisks (*) indicate the significant differences occurring during ageing. Significance was evaluated using a t test with P <0.05.
Fig. 3.
Fig. 3.
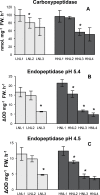
Protease activities are increased in old leaves of plants. Carboxypeptidase (A) and endopeptidase at pH 5.4 (B) and at pH 4.5 (C) were measured. LN (low nitrate; light grey) and HN (high nitrate; dark grey). Data represent mean ±SD of 3–4 biological replicates. The asterisks (*) indicate the significant differences between leaf (n+1) and leaf (n) under the same nitrate conditions. Significance was evaluated using a t test with P <0.05. Similar results have been obtained on two independent cultures.
Fig. 4.
Fig. 4.
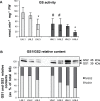
Glutamine synthetase (GS) activity and protein contents in leaf ranks of plants. (A) GS activity. Data are mean ±SD of 3–4 biological replicates. The asterisks (*) indicate the significant differences between leaf (n+1) and leaf (n) under the same nitrate conditions. The symbol (#) indicates significant differences between LN and HN for the same leaf rank. Significance was evaluated using a t test with P <0.05. LN (low nitrate; light grey) and HN (high nitrate; dark grey). (B) GS1 (39kDa) and GS2 (46kDa) were identified on Western blots. GS1 and GS2 proportions were calculated after quantification of signals using densitometry and ImageJ imaging software. Equal protein amounts were loaded in each lane. All experiments were performed on two different cultures giving the same results.
Fig. 5.
Fig. 5.
Description of barley HvGS and HvASN gene structures. Diagrams of HvGS (A) and HvASN (B): white boxes represent untranslated regions, black boxes represent coding regions, solid V lines represent introns, yellow and pink boxes indicate the conserved amino acid residues among GS and AS proteins, respectively, from barley (H. vulgare), Z. mays, O. sativa, A. thaliana, T. aestivum, S. officinarum, V. vinifera, P. sativum, L. perenne, S. bicolor, S. smithii, D. melanogaster, H. sapiens, A. nidulans, S. filamentosus, E. coli, and S. aureus. Conserved groups of amino acid residues in all HvGS1 and HvAS proteins analysed are indicated in black font and by coloured arrowheads. Amino acid residues responsible for ligand binding specificity in the GS family are indicated in red font and by coloured arrowheads. The predicted amino acid (aa) length for each of the corresponding proteins is shown on the right. (This figure is available in colour at JXB online.)
Fig. 6.
Fig. 6.
Transcript levels of HvGS, HvASN, HvNAC13, and HvLSU genes in leaves of plants grown under low (LN) and high (HN) nitrate conditions. Only leaf ranks L1, L2, and L3 from LN (grey bars) and HN (black bars) plants were analysed. Both line charts and histograms are presented for HvASN (LN: light grey line; HN: dark grey line). Log10 relative expression values are shown. Data are means ±SD (n=3 biological replicates). The ns and asterisks (*) indicate, respectively, the non-significant and significant differences between leaf (n+1) and leaf (n) under the same nitrate conditions. Significance was evaluated using a t test with P <0.05. HvGAPDH was used as the reference gene.
Fig. 7.
Fig. 7.
Transcript levels of HvGS, HvASN, and HvNAC13 genes in flag leaves harvested at different stages of senescence. Young leaves (T1), mature leaves (T3), and senescing leaves (T5) were analysed. Log10 relative expression values are shown. Data are mean ±SD (n=3 biological replicates). The ns and asterisks (*) indicate, respectively, the non-significant and significant differences occurring during ageing, i.e. between T3 and T1 and between T5 and T3. Significance was evaluated using a t test with P <0.05. HvActin was used as the reference gene.
Fig. 8.
Fig. 8.
Transcript levels of HvGS, HvASN, HvNAC13, and HvSSU genes in leaves of plants following dark treatment and recovery. CL (control leaves at T1: white; control leaves at T2: light grey); DL (darkened leaves at T1: black; darkened leaves at T2: dark grey). Log10 relative expression values are shown. Data are means ±SD (n=3 biological replicates). The ns and asterisks (*) indicate, respectively, the non-significant and significant differences between leaf (n+1) respective to leaf (n) in control and dark-treated plants. The symbol # indicates the significant differences existing between each leaf rank of control and dark-treated plants at each time point. Significance was evaluated using a t test with P <0.05. HvGAPDH was used as the reference gene.
Fig. 9.
Fig. 9.
Up and down regulation of HvGS1 and HvASN depending on natural or stress-induced senescence. The significant increases and decreases in transcript levels in senescing tissues are indicated by UP and DOWN, respectively, when the variation observed is high and by up and down when the senescence effect is significant but not as high. nd means not determined and — indicates that there was no effect of senescence on transcript levels. Blue cells are for down-regulation, pink cells for up-regulation, white cells are for no difference, and grey cells for nd. (This figure is available in colour at JXB online.)

References

    1. Arnon DI. 1949. Copper enzymes in isolated chloroplasts. Polyphenol oxidase in Beta vulgaris L. Plant Physiology 24, 1–15. - PMC - PubMed
    1. Avila-Ospina L, Moison M, Yoshimoto K, Masclaux-Daubresse C. 2014. Autophagy, plant senescence, and nutrient recycling. Journal of Experimental Botany 65, 3799–3811. - PubMed
    1. Baima S, Haegi A, Stroman P, Casadoro G. 1989. Characterization of a cDNA clone for Barley leaf glutamine-synthetase. Carlsberg Research Communications 54, 1–9. - PubMed
    1. Brugière N, Dubois F, Masclaux C, Sangwan RS, Hirel B. 2000. Immunolocalization of glutamine synthetase in senescing tobacco (Nicotiana tabacum L.) leaves suggests that ammonia assimilation is progressively shifted to the mesophyll cytosol. Planta 211, 519–527. - PubMed
    1. Buchanan-Wollaston V. 1997. The molecular biology of leaf senescence. Journal of Experimental Botany 48, 181–199.

Publication types

MeSH terms