doi: 10.5152/dir.2014.14360.
Imaging of aberrant left gastric vein and associated pseudolesions of segments II and III of the liver and mimickers
Affiliations
- PMID: 25698094
- PMCID: PMC4463322
- DOI: 10.5152/dir.2014.14360
Item in Clipboard
Imaging of aberrant left gastric vein and associated pseudolesions of segments II and III of the liver and mimickers
Diagn Interv Radiol.
2015 Mar-Apr.
Abstract
We present imaging findings of aberrant left gastric vein (ALGV) and associated pseudolesions and mimickers including metastases and focal nodular hyperplasia. ALGV is formed due to interrupted involution of anastomotic omental veins, and it can drain into left portal vein or segments II and III of the liver as third inflow. Focal fat, focal fat sparing, and perfusion changes can be seen due to the presence of ALGV, which can mimic metastasis in cancer patients. ALGV may also serve as a pathway for direct tumor spread into the liver in patients with gastric cancer. Magnetic resonance imaging can be used as a problem solving tool in the presence of equivocal findings on ultrasonography and computed tomography.
Figures
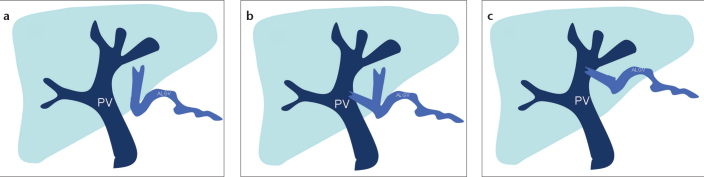
Schematic drawing shows the types of aberrant left gastric vein (ALGV). Type 1 vein (a) acts as a pure accessory portal vein (PV) which branches out and flows through the sinusoids. Type 2 vein (b) has a parenchymatous distribution with anastomosis to PV. Type 3 vein (c) has a more cranial course with anastomosis to intrahepatic PV branches.
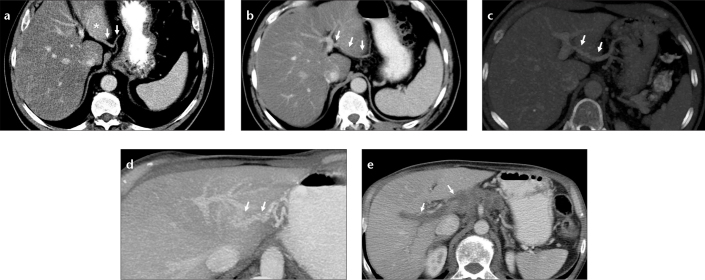
Images of ALGV types from different patients. Axial CT image (a) shows type 1 ALGV (arrows) which enters the liver parenchyma and leads to fat sparing (asterisk) at the posterior aspect of segments II and III. Axial CT image (b) shows type 2 ALGV (arrows), which courses through the parenchyma with anastomosis to the left portal vein. Axial maximum intensity projection (MIP) image (c) shows type 3 ALGV (arrows) with anastomosis to the left portal vein. Left portal vein opacification by ALGV in a patient with main portal vein thrombosis (d, e). Axial MIP CT image (d) shows anastomosis between ALGV (arrows) and left portal vein branch. Axial CT image (e) shows thrombosis of the main and right portal veins (arrows).
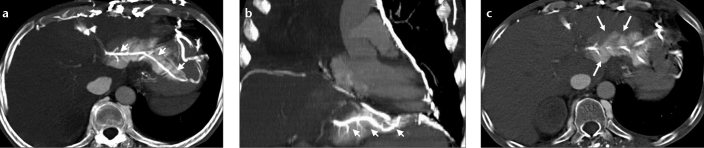
A lung cancer patient with superior vena cava occlusion and perfusion change at the posterior aspect of left lobe of the liver noted on chest CT. Axial (a) and coronal (b) MIP CT images show hyperdense appearance and contrast reflux to ALGV (arrows) from collateral flow through anastomosis between pericardiophrenic and gastric veins. Axial CT image (c) of the same patient shows parenchymal hyperdensity which may mimic hypervascular lesion and focal fat spared area. Filling of ALGV leads to the diagnosis.
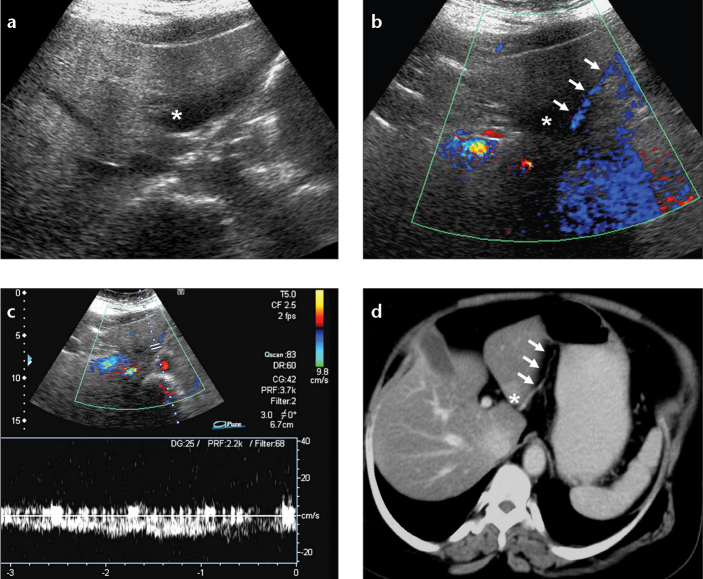
Focal fat spared area with accompanying ALGV in a breast cancer patient. Axial US (a) and color Doppler US (b) images show focal fat spared area (asterisk) and the course of ALGV (arrows). Venous flow pattern is demonstrated by pulsed-wave Doppler US image (c). Axial CT image (d) reveals focal fat spared area, seen as relatively increased density (asterisk), and the course of ALGV (arrows).
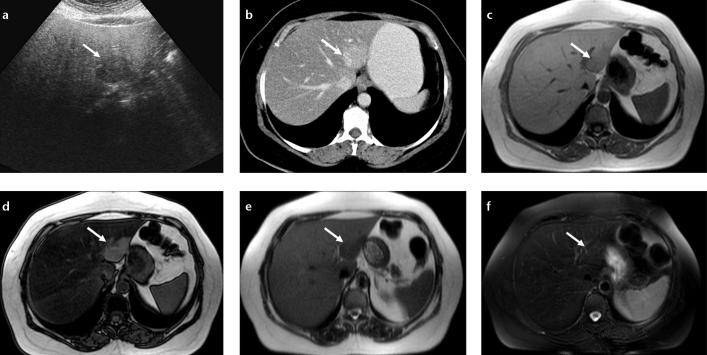
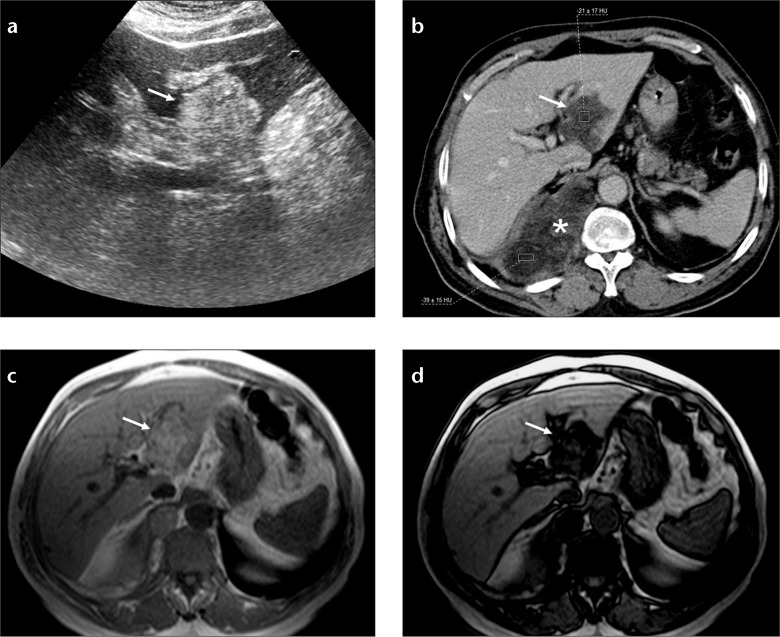
Nodular focal fat spared area in a patient with melanoma. Axial US image (a) shows hypoechoic lesion (arrow) in a fatty liver and CT image (b) shows hyperdense area at the posterior aspect of segments II and III (arrow). In-phase (c) and out-of-phase (d) T1-weighted images show focal fat spared area by signal reduction in the whole liver parenchyma except for the fat spared area on the out-of-phase image (arrows). Severe steatosis causes increased signal of the liver on T2-weighted image (e) and the spared area (normal liver) appears hypointense; this contrast difference disappears on fat-saturated T2-weighted image (f).
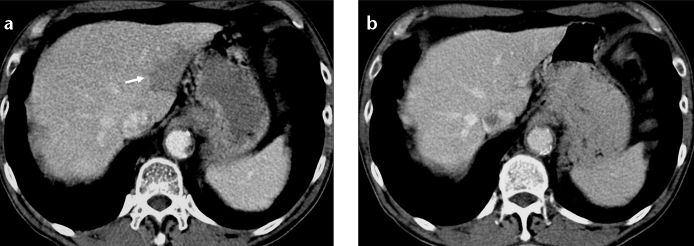
Focal fat at the posterior aspect of segments II and III of the liver. Axial CT image (a) of a lymphoma patient shows focal hypodensity that does not displace small vascular structures. Axial CT image (b) of the same patient two years later shows disappearance of focal fat.
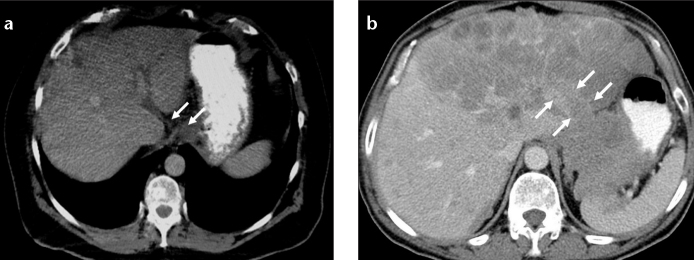
Direct spread of gastric carcinoma into the liver via ALGV. Axial CT image (a) shows a mass at esophagogastric junction and tumor invasion of ALGV (arrows). Axial CT image (b) in another patient with gastric carcinoma shows tumor extension and metastasis to the left lobe of the liver via ALGV (arrows).
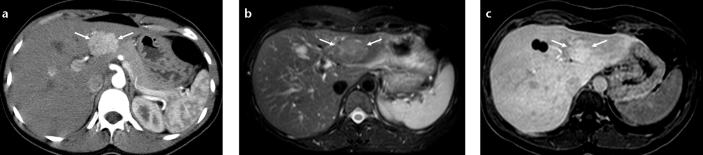
Focal nodular hyperplasia mimicking perfusion change and fat spared area at the posterior aspect of segments II and III. Axial CT image (a) shows an arterial enhancing mass (arrows) in a patient with history of papillary thyroid carcinoma. Axial T2-weighted fat saturated image (b) shows a slightly hyperintense lesion with a central scar (arrows). Hepatobiliary phase T1-weighted image (c) shows focal gadobenate dimeglumine uptake consistent with focal nodular hyperplasia (arrows).
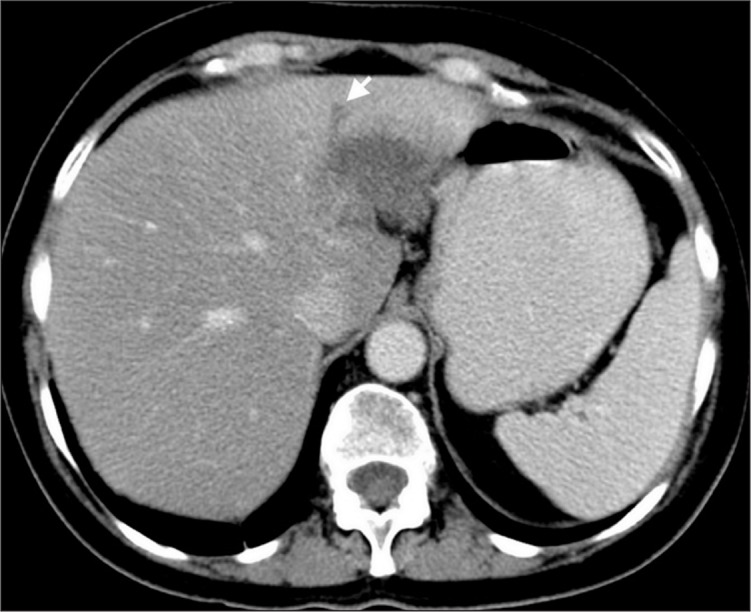
A patient with breast carcinoma and solitary metastasis to segments II and III of the liver mimicking focal fat. Axial CT image shows a hypodense lesion and accompanying bile duct dilatation (arrow), which is not seen in the presence of focal fat.
Liposarcoma metastasis mimicking focal fat. Axial US image (a) of the liver shows a hyperechogenic mass at segments II and III of the liver (arrow). Axial CT image (b) shows fat density of the mass (arrow) and right thoracic primary mass (asterisk). In-phase (c) and out-of-phase (d) T1-weighted images show signal reduction in the fat containing mass due to coexistence of fat and solid parts (arrows).
References
-
- Hiwatashi A, Yoshimitsu K, Honda H, et al. Pseudolesion in segment II of the liver observed on CT during arterial portography caused by the aberrant left gastric venous drainage. Abdom Imaging. 1999;24:357–359. - PubMed
-
- Matsui O, Takahashi S, Kadoya M, et al. Pseudolesion in segment IV of the liver at CT during arterial portography - correlation with aberrant gastric venous drainage. Radiology. 1994;193:31–35. - PubMed
-
- Yoshimitsu K, Honda H, Kaneko K, et al. Anatomy and clinical importance of cholecystic venous drainage: Helical CT observations during injection of contrast medium into the cholecystic artery. AJR Am J Roentgenol. 1997;169:505–510. - PubMed
-
- Terayama N, Matsui O, Tatsu H, Gabata T, Kinoshita A, Hasatani K. Focal sparing of fatty liver in segment II associated with aberrant left gastric vein. Br J Radiol. 2004;77:150–152. - PubMed
-
- Nebotcegarra J, Domenechmateu JM. Intrahepatic termination of the left gastric vein (vena gastrica sinistra) - a new case of this unusual anatomic variation. Anat Anz. 1986;161:309–315. - PubMed
MeSH terms
LinkOut - more resources
Full Text Sources
Other Literature Sources
Medical