. 2015 Apr 21:371:102-16.
doi: 10.1016/j.jtbi.2015.01.037. Epub 2015 Feb 16.

Modelling the vascular response to sympathetic postganglionic nerve activity

Affiliations

Modelling the vascular response to sympathetic postganglionic nerve activity

Linford J B Briant et al. J Theor Biol. .

Abstract

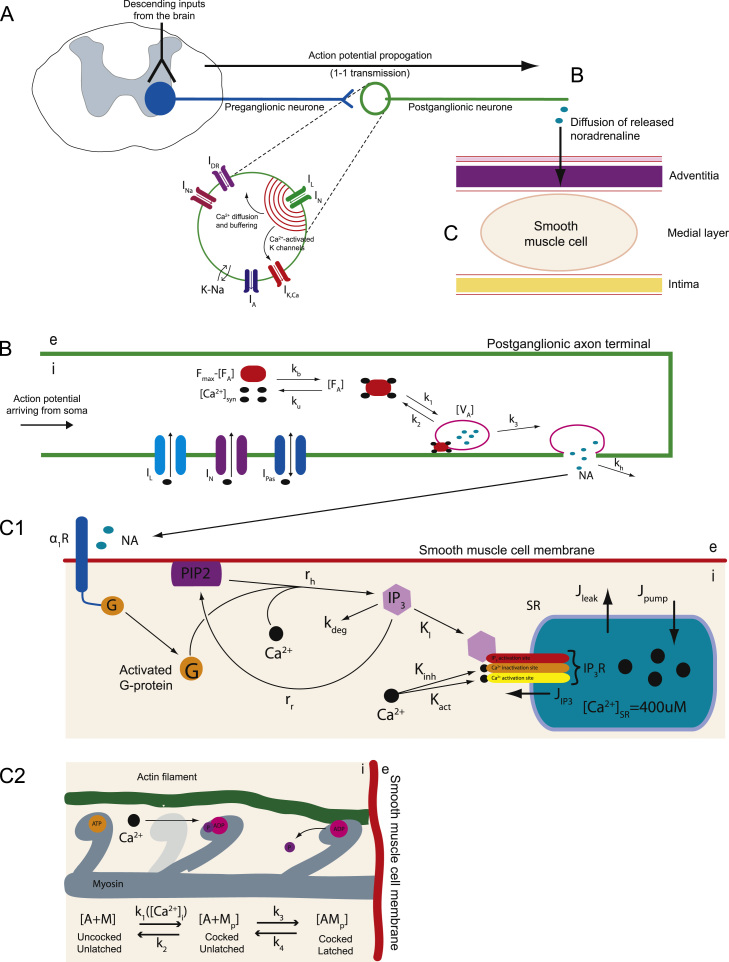
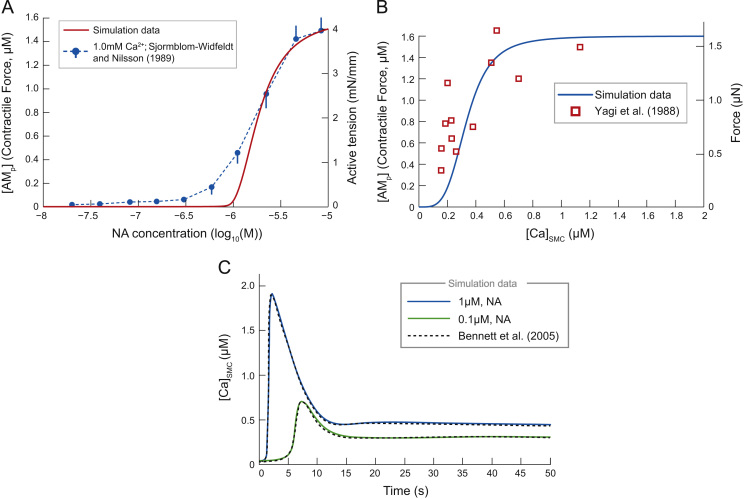
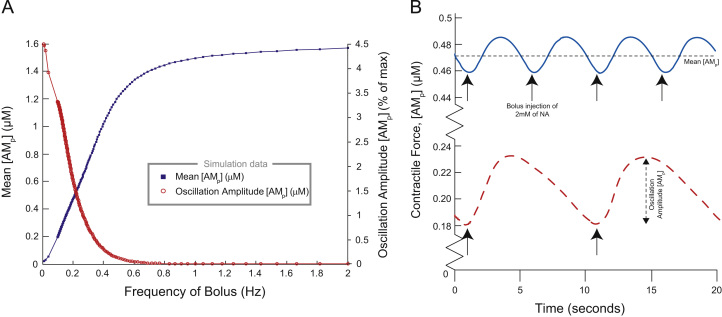
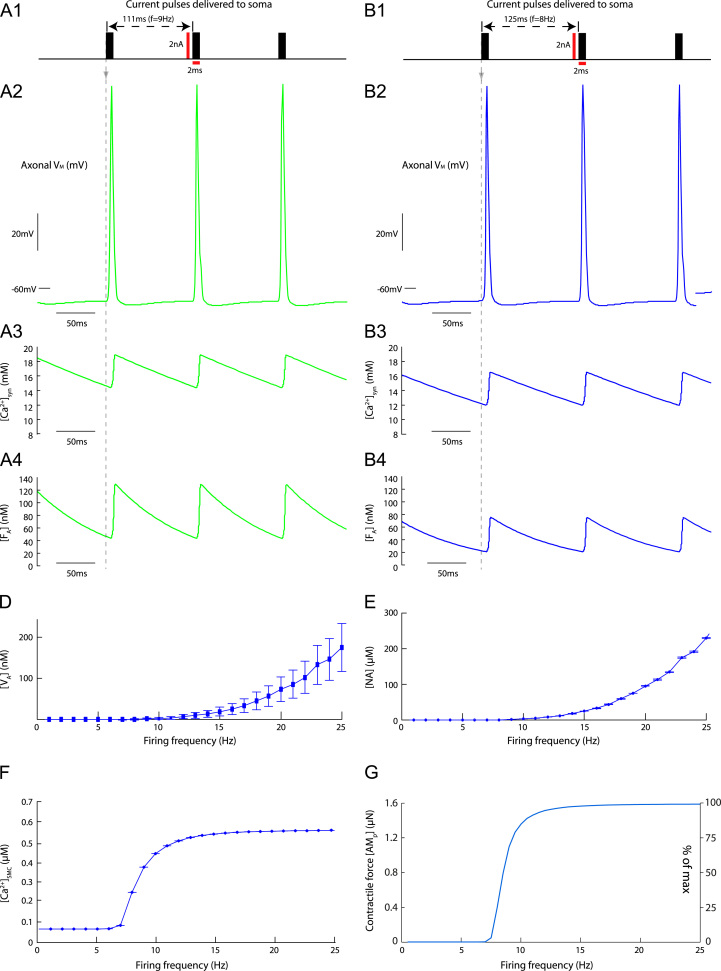
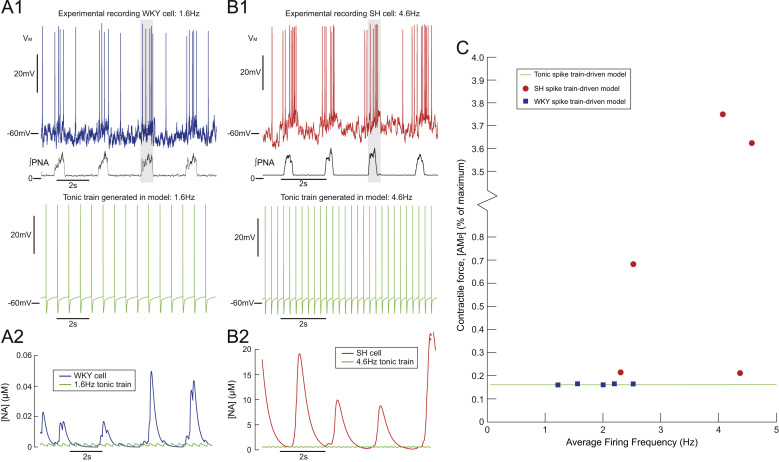
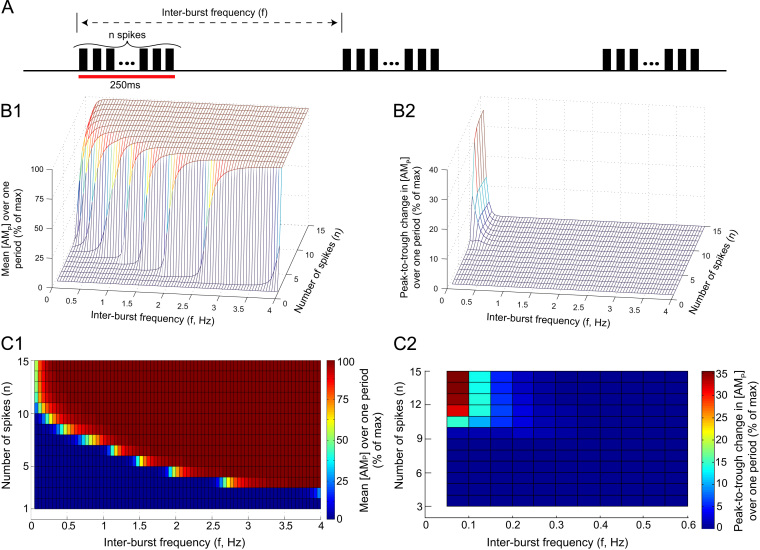
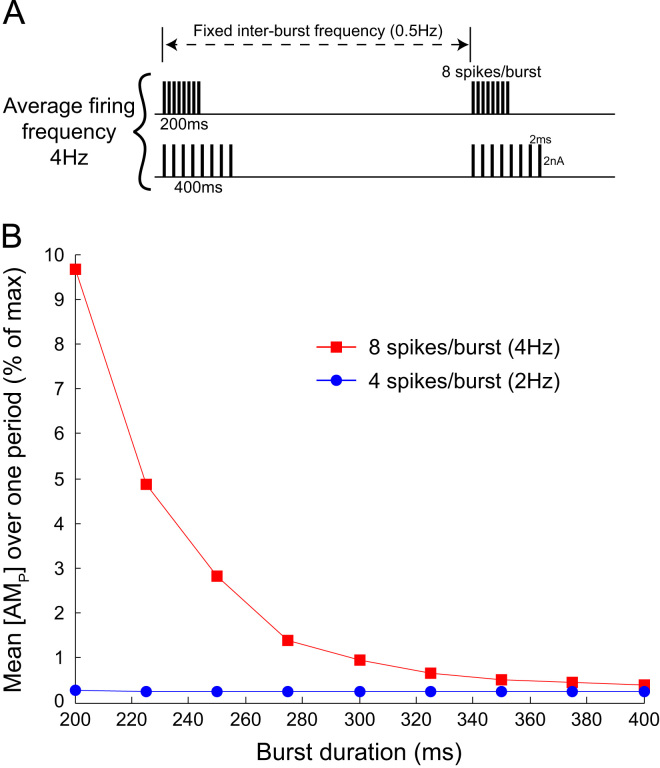
This paper explores the influence of burst properties of the sympathetic nervous system on arterial contractility. Specifically, a mathematical model is constructed of the pathway from action potential generation in a sympathetic postganglionic neurone to contraction of an arterial smooth muscle cell. The differential equation model is a synthesis of models of the individual physiological processes, and is shown to be consistent with physiological data. The model is found to be unresponsive to tonic (regular) stimulation at typical frequencies recorded in sympathetic efferents. However, when stimulated at the same average frequency, but with repetitive respiratory-modulated burst patterns, it produces marked contractions. Moreover, the contractile force produced is found to be highly dependent on the number of spikes in each burst. In particular, when the model is driven by preganglionic spike trains recorded from wild-type and spontaneously hypertensive rats (which have increased spiking during each burst) the contractile force was found to be 10-fold greater in the hypertensive case. An explanation is provided in terms of the summative increased release of noradrenaline. Furthermore, the results suggest the marked effect that hypertensive spike trains had on smooth muscle cell tone can provide a significant contribution to the pathology of hypertension.

Keywords: Bursting; Calcium dynamics; Hypertension; Neurone dynamics; Sympathetic nervous system.


Figures

Fig. 1
Fig. 1
The mathematically modelled pathway from SPGN excitation to smooth muscle cell activation. The mathematically modelled pathway from SPGN excitation to smooth muscle cell activation. (A) The model of a SPGN from Briant et al. (2014). Action potentials propagate down the SPGN axon to the postganglionic terminal. (B) This activates IL and IN, triggering the influx of calcium into the postganglionic terminal, increasing [Ca2+]syn. Four molecules of intracellular calcium bind to a fusion protein, activating it (FA). Once activated, the fusion protein can bind to, and consequently activate, a vesicle V. The activated vesicles, VA, are assumed to be pre-docked to the synaptic membrane; once activated, it immediately releases its NA contents into the cleft. (C1) Released noradrenaline activates α1Rs on the SMC membrane, activating a G-protein (G). This G-protein, drives the hydrolysis of PIP2. Hydrolysed PIP2 cleaves to form IP3, which activates an IP3R located on the membrane of the SR. Activation of this receptor causes an efflux of Ca2+ from the SR (JIP3), increasing [Ca2+]SMC. These receptors also have inactivation and activation sites for [Ca2+]SMC. Fluxes of Ca2+ across the SR membrane also exist due to leakage (Jleak) and calcium pumps (Jpump). (C2) The intra-SMC matrix contains actin (A) and myosin (M) filaments. At rest these filaments are in a detached state, A+M. When the myosin heads are phosphorylated by calcium (MP), they able to attach to the actin filaments, yielding the state AMP—a cross-bridge. This cross-bridge can then conduct a ‘power stroke’, sliding the actin filament and producing a contractile force.
Fig. 2
Fig. 2
Response of model to application of exogenous noradrenaline and endogenous calcium. (A) [AMP] response to constant application of [NA]. Simulation data (solid) exhibits a steeper relation than the experimental data (broken lines) of Sjoblom-Widfeldt and Nilsson (1989) for the tensile response of small mesenteric arteries. Experimental data points (±SEM) are conducted in the presence of extracellular calcium concentration 1.0 mM. Note the fitting of the model to the experimental data for high [NA], which diverges when [NA]<1.8μM. (B) The force developed by our SMC model as a function of [Ca2+]SMC. The concentration of actin bound to phosphorylated myosin [AMP] in the model, followed a sigmoid relationship. Experimental observations from Yagi et al. (1988) show that the [AMP] closely resembles the force in μN. (C) The response of [Ca2+]SMC to exogenous application of [NA]=1μM (blue) and 0.1μM (green). The delayed, transient rise, followed by a steady-state plateau fits simulations of Bennett et al. (2005) (dashed), and therefore similarly fits experimental data of Li et al. (1993). These data support our quasi-steady state assumption for the receptor dynamics. (For interpretation of the references to color in this figure caption, the reader is referred to the web version of this article.)
Fig. 3
Fig. 3
Contractile response of SMC model to periodic stimulation. The SMC model was stimulated periodically for 300 ms with a 2 nM bolus of NA, at various frequencies (0.01–2 Hz). (A) Across one period of stimulation, the mean [AMP] increased with frequency, whereas the amplitude of oscillations in [AMP] (as a % of the maximum contractile force) decreased. Above 0.4 Hz, oscillations in [AMP] were negligible (<1% of max). (B) Contractile force [AMP] to stimulation at 0.1 Hz (red, dashed) and 0.2 Hz (blue). (For interpretation of the references to color in this figure caption, the reader is referred to the web version of this article.)
Fig. 4
Fig. 4
Response of the model to tonic stimulation. Response of the model to tonic stimulation. Tonic stimulation at 9 Hz (A) and 8 Hz (B). (A1, B1) The pulses played into the SPGN model, to generate the said firing frequencies. (A2, B2) The action potential waveforms in the axon terminal, in response to these pulses. (A3, B3) [Ca2+]syn increases, driven by these action potentials. Summation is linear across the frequencies. (A4, B4) [FA] summates nonlinearly, with greater peaks in activation at high-frequency. (D) [VA] increases with stimulus/firing frequency. Error bars are the maximum and minimum of oscillations in this concentration due to the periodic stimulus. (E) [NA] increases with firing frequency. Oscillations are of negligible (<0.1 nM) amplitude. (F) Released NA leads to increases in [Ca2+]SMC, due to α1R and G-protein activation. This increases in a sigmoidal fashion at 7Hz. (G) Contractile response of SMC model to tonic stimulation of SPGN model. As firing frequency increases, the contractile force [AMP] increases sigmoidally. Below 7 Hz, the SMC is unresponsive to tonic stimulation.
Fig. 5
Fig. 5
Paired-pulse stimulation of noradrenaline release. Paired-pulse stimulation of noradrenaline release. The soma of the SPGN model was driven with a pair of pulses (2 ms×2 nA) at a fixed inter-pulse interval (IPI) ranging from 40–2000 ms. These pulses drove NA release via Eqs. (1)–(5). The variables of these equations were normalised by the single-pulse response, to measure the gain in the second pulse as a function of IPI. (A) The response of pre-synaptic calcium (Casyn, A1), activated fusion protein (FA, A2) and noradrenaline (NA, A3) to paired-pulse stimulation at 50 (green), 100 (blue) and 150 ms (red). The gain in the second pulse in Casyn was similar across the IPIs. The gain in FA increased as IPI decreased. (B) Paired-pulse peak gain in Casyn (circle), FA (diamond) and NA (square) as a function of IPI. Gain was measured as the maximal height reached in response to the second response, as a proportion of the height of the first response (gain=1). Note that at high-frequency (IPI<100ms) the gain in Casyn is small (1.3–1.4) and a shallow function of IPI. Contrarily, the gain in FA is large (2.5–3.5) and a steep function of IPI. This drives greater release of NA, which exhibits an even greater gain (3–4) due to slow reuptake. (C) The relationship between the gain in activation of the fusion protein and the baseline pre-synaptic calcium level at the time of arrival of the second action potential is quartic. (For interpretation of the references to color in this figure caption, the reader is referred to the web version of this article.)
Fig. 6
Fig. 6
Spike train model produces greater release of NA than tonic drive model. Spike train model produces greater release of NA than tonic drive model. Experimental recordings of membrane potential (VM) in an MVClike sympathetic preganglionic neurone in a normotensive (WKY; (A)) and spontaneously hypertensive (SH; (B)) (Briant et al., 2014) were used to drive contraction in the SMC model. The WKY cell fired at an average frequency of 1.6 Hz and the SH cell at 4.6 Hz. Both recordings exhibit respiratory modulation, with increases in firing frequency entrained to PNA (lower trace; shaded region). The response of the model to these patterns was compared to tonic stimulation at the same average firing frequency. The NA released in response to the bursting spike train, was greater than tonic, for both the WKY (A2) and SH (B2) recording. The release of NA was entrained to respiration. The contractile response was greater in response to the bursting spike trains, but was greatest in response to the SH spike train. (C) Steady-state contractile response of SMC model (% of maximum) to n=5 WKY spike trains (square) and n=5 SH spike trains (circle). The response to tonic stimulation at the same average firing frequency is also shown (dashed line).
Fig. 7
Fig. 7
Contractile force critically depends on burst amplitude. (A) The SPGN model was stimulated with bursts of n pulses, at a frequency T1=f. (B) For each tuple (n, f) the response of the contractile force [AMP] was plotted. (B1) The mean [AMP] over one period, as a % of the maximum contractile force. (B2) The oscillatory response of [AMP] to the bursting stimulation, measured as the peak-to-trough change in [AMP] over one period (% of max). An oscillatory response was only seen for very high amplitude (large n) bursts, at very low inter-burst frequencies f. (C) Heat maps depicting the data for (B). Note that at frequencies mimicking respiratory modulation of sympathetic activity (≈0.4 Hz, as in Fig. 6), [AMP] is very sensitive to changes in burst amplitude n. The magnitude of the [AMp] response, and any oscillations in [AMp] produced, is also strongly dependent on f, particularly at lower inter-burst frequencies (f<0.4 Hz).
Fig. 8
Fig. 8
Contractile force depends on burst duration. (A) The SPGN model was stimulated with bursts of fixed amplitude (number of spikes, n) and duration. The bursts had a fixed inter-burst frequency of 0.5 Hz, to mimic respiratory modulation of bursting seen in situ (Stalbovskiy et al., 2014). Furthermore, burst amplitudes of n=4 and n=8 were chosen to match the burst amplitudes recorded in situ in normotensive (control) WKY rats and spontaneously hypertensive rats, respectively (Briant et al., 2014). These patterns achieved average firing rates of 2 Hz and 4 Hz, approximately what was reported in the two strains. These spikes were then equally spread over a burst of duration 200–400 ms. (B) [AMP] in response to these bursts was recorded at steady-state, after >100s of simulation. For 4 Hz stimulation, the shorter the burst, the greater the contractile response.

References

    1. Bao J.X., Gonon F., Stjarne L. Kinetics of ATP- and noradrenaline-mediated sympathetic neuromuscular transmission in rat tail artery. Acta Physiol. Scand. 1993;149(December (4)):503–519. - PubMed
    1. Bennett M.R., Farnell L., Gibson W.G. A quantitative description of the contraction of blood vessels following the release of noradrenaline from sympathetic varicosities. J. Theor. Biol. 2005;234(May (1)):107–122. - PubMed
    1. Briant L.J., Stalbovskiy A.O., Nolan M.F., Champneys A.R., Pickering A.E. Increased intrinsic excitability of muscle vasoconstrictor preganglionic neurons may contribute to the elevated sympathetic activity in hypertensive rats. J. Neurophysiol. 2014;112(December (11)):2756–2778. - PMC - PubMed
    1. Burnstock G. Purinergic cotransmission. Exp. Physiol. 2009;94(January (1)):20–24. - PubMed
    1. Carnevale N.T., Hines M.L. Cambridge University Press; Cambridge, UK: 2006. The NEURON Book.

Publication types

MeSH terms

LinkOut - more resources