. 2015 Feb 20:6:6200.
doi: 10.1038/ncomms7200.

Protein kinase D1 drives pancreatic acinar cell reprogramming and progression to intraepithelial neoplasia

Affiliations

Protein kinase D1 drives pancreatic acinar cell reprogramming and progression to intraepithelial neoplasia

Geou-Yarh Liou et al. Nat Commun. .

Abstract

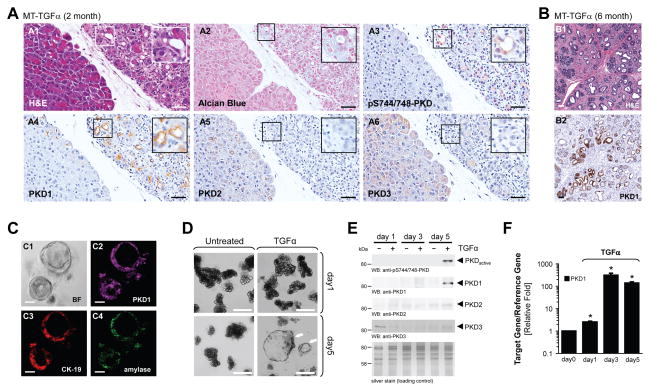
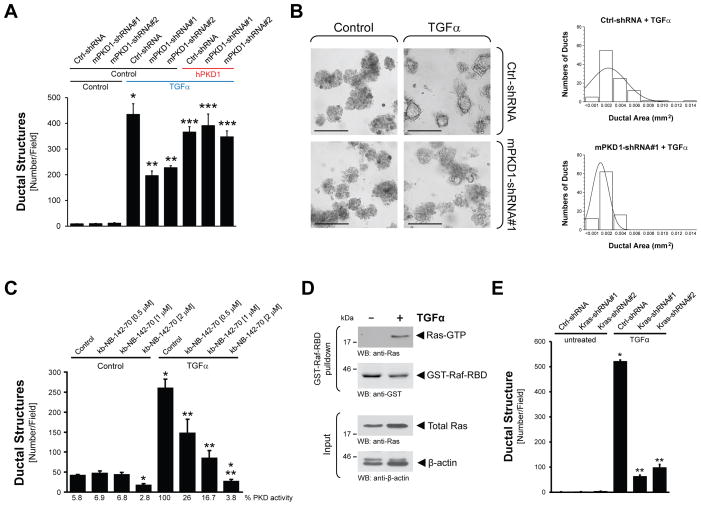
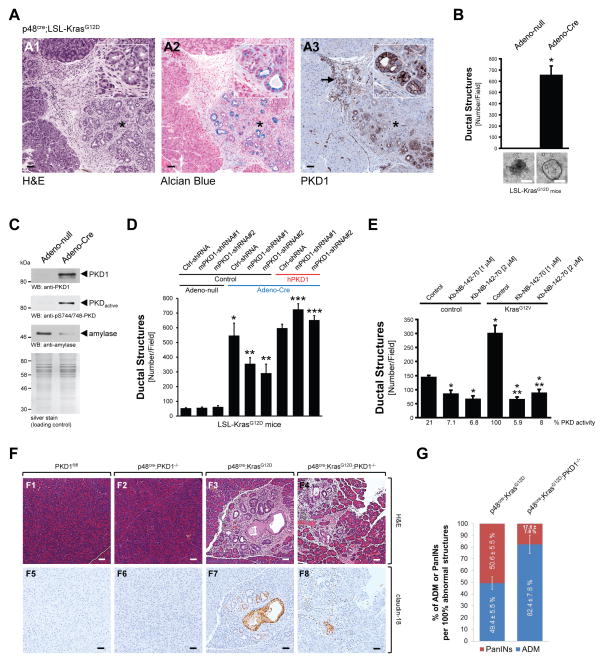
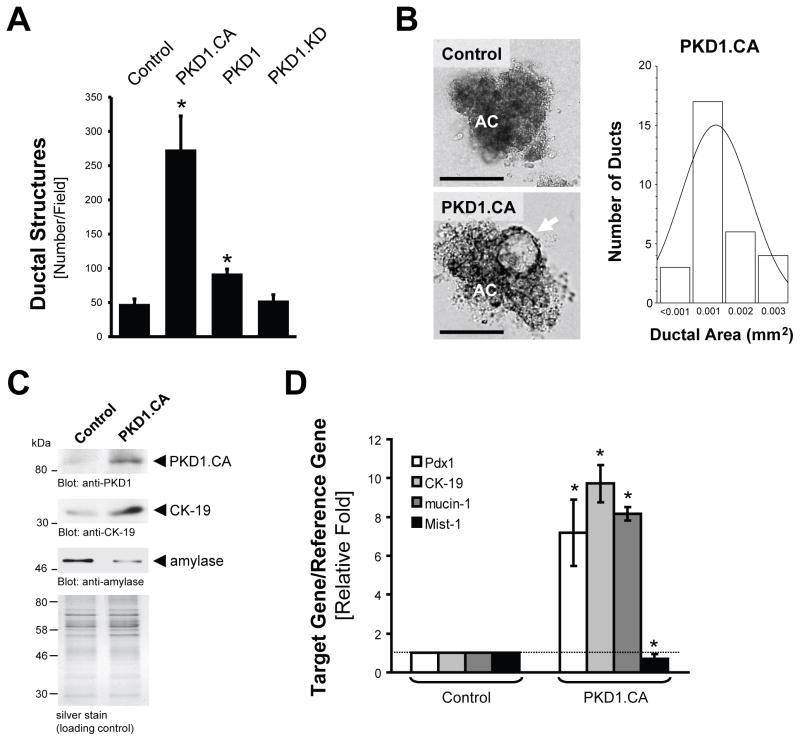
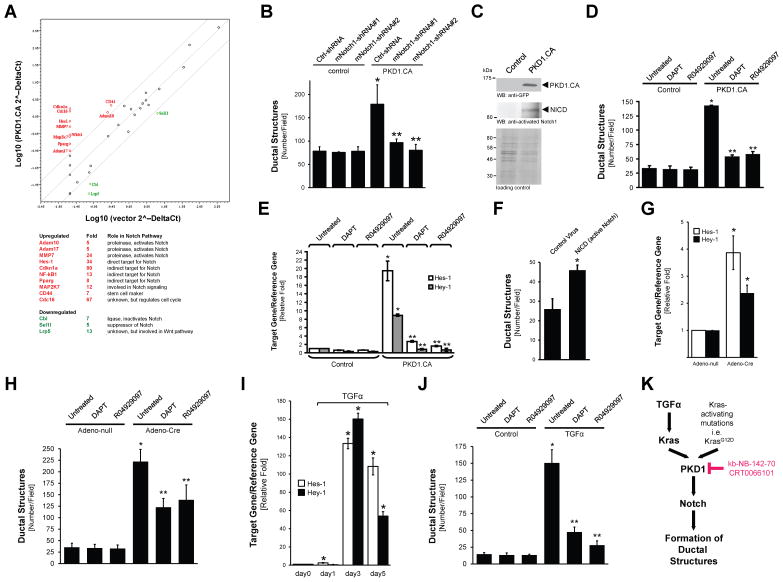
The transdifferentiation of pancreatic acinar cells to a ductal phenotype (acinar-to-ductal metaplasia, ADM) occurs after injury or inflammation of the pancreas and is a reversible process. However, in the presence of activating Kras mutations or persistent epidermal growth factor receptor (EGF-R) signalling, cells that underwent ADM can progress to pancreatic intraepithelial neoplasia (PanIN) and eventually pancreatic cancer. In transgenic animal models, ADM and PanINs are initiated by high-affinity ligands for EGF-R or activating Kras mutations, but the underlying signalling mechanisms are not well understood. Here, using a conditional knockout approach, we show that protein kinase D1 (PKD1) is sufficient to drive the reprogramming process to a ductal phenotype and progression to PanINs. Moreover, using 3D explant culture of primary pancreatic acinar cells, we show that PKD1 acts downstream of TGFα and Kras, to mediate formation of ductal structures through activation of the Notch pathway.


Conflict of interest statement

Competing financial interests:

The authors declare no competing financial interests.

Figures

Figure 1
Figure 1. PKD1 is upregulated in pancreatic acinar cells undergoing ADM
(A, B) Pancreatic tissue (normal acinar area and regions with ADM, PanINs) from MT-TGFα transgene mice was stained with H&E, Alcian Blue, or analyzed by IHC for expression of PKD1 (anti-PKD1), PKD2 (anti-PKD2), PKD3 (anti-PKD3), or active PKD activity (anti-pS744/748-PKD), as indicated. The bar represents 50 μm. (C) Primary acinar cells were isolated from mouse pancreas and seeded in 3D culture in phenol red-free, growth factor-containing Matrigel. At day 5, expression of PKD1 (anti-PKD1, deep red), CK-19 (ductal marker, red) and amylase (acinar cell marker, green) were analyzed by immunofluorescence. BF = bright field. The bar represents 50 μm. (D–F) Primary acinar cells were isolated from mouse pancreas, seeded in 3D culture in collagen and transdifferentiation was induced with TGFα (50 ng ml−1) as indicated. Ducts formed were photographed (D, bar represents 100 μm), isolated from the collagen and analyzed by Western blot for expression of PKD1, PKD2, PKD3, and active PKD (anti-S744/748-PKD) as indicated (E) or analyzed by QPCR for PKD1 expression (F). In (E) silver staining served as loading control. In (F), * indicates statistical significance (p < 0.05; student’s t-test) as compared to control. Error bars (s.d.) were obtained from three experimental replicates. All experiments shown were performed at least 3 times with similar results.
Figure 2
Figure 2. PKD is necessary for TGFα-mediated metaplasia to ductal structures
(A, B) Primary acinar cells were isolated from mouse pancreas and infected with lentivirus harboring (scrambled) control shRNA (Ctrl-shRNA) or 2 different sequences of PKD1-shRNA (#1, #2) specifically targeting mouse PKD1. In addition cells were lentivirally infected with human PKD1 or control virus, as indicated. Cells were then seeded in 3D culture in collagen and transdifferentiation was induced with TGFα (50 ng ml−1). Formation of ductal structures was quantified (A), or ducts formed were photographed and the ductal area of 100 ducts was determined (B). In (B), the bar represents 200 μm. (C) Primary acinar cells were isolated from mouse pancreas, seeded in 3D culture in collagen, and transdifferentiation was induced with TGFα (50 ng ml−1) in absence or presence of the PKD inhibitor kb-NB-142-70 at indicated doses. ADM events were quantified. (D) Primary acinar cells were isolated from mouse pancreas and stimulated with TGFα (50 ng ml−1, 48 hours). Active Ras was pulled-down using GST-Raf-RBD. Samples were analyzed by SDS-PAGE and immunoblotting for pulled-down active Ras (anti-Ras), GST-Raf-RBD input (anti-GST), as well as other input controls (anti-Ras and anti-β-actin). (E) Primary acinar cells were isolated from mouse pancreas, infected with lentivirus harboring (scrambled) control shRNA (Ctrl-shRNA) or Kras-shRNA (2 different specific sequences, #1, #2), seeded in 3D culture in collagen and transdifferentiation was induced with TGFα (50 ng ml−1). ADM events were quantified. In all figures, * indicates statistical significance (p < 0.05; student’s t-test) as compared to control, ** indicates statistical significance (p < 0.05; student’s t-test) as compared to TGFα treatment, *** indicates statistical significance (p < 0.05; student’s t-test) as compared to respective shRNA sample. Error bars (s.d.) were obtained from three experimental replicates. All experiments shown were performed at least 3 times with similar results.
Figure 3
Figure 3. PKD1 is necessary for Kras-induced metaplasia to ductal structures
(A) Pancreatic tissue (normal acinar area and regions with ADM) from bi-transgenic p48cre;KrasG12D mice was stained with H&E, Alcian Blue, or analyzed by IHC for PKD1 expression (anti-PKD1). The asterisk shows a typical region of newly-formed ductal structures. The arrow shows immune cells also staining positive for PKD1. The bar represents 50 μm. (B, C) Primary acinar cells were isolated from LSL-KrasG12D mice and infected with Adeno-Cre (or control virus) to induce expression of KrasG12D. Formation of ductal structures was quantified and ducts formed were photographed (B), or ducts formed were isolated and analyzed by Western blot for PKD1 expression (anti-PKD1) or activity (anti-pS744/748) and anti-amylase (C). In (B) the bar represents 200 μm; in (C) silver staining served as loading control. (D) Primary acinar cells from LSL-KrasG12D mice were isolated from mouse pancreas and infected with lentivirus harboring (scrambled) control shRNA (Ctrl-shRNA) or 2 different sequences of PKD1-shRNA (#1, #2) specifically targeting mouse PKD1. Expression of mutant Kras was induced by adenoviral infection of cre-recombinase as indicated (Adeno-Cre), or Adeno-null as control. In addition cells were lentivirally-infected with human PKD1 or control virus as indicated. Cells were then seeded in 3D culture in collagen and formation of ductal structures was quantified. (E) Primary acinar cells were isolated from mouse pancreas, lentivirally-infected with KrasG12V and then seeded in 3D culture in collagen in absence or presence of the PKD inhibitor kb-NB-142-70 at indicated doses. Formation of ductal structures was quantified. In all figures, * indicates statistical significance (p < 0.05; student’s t-test) as compared to control, ** indicates statistical significance (p < 0.05; student’s t-test) as compared to stimulus, *** indicates statistical significance (p < 0.05; student’s t-test) as compared to respective shRNA sample. Error bars (s. d.) were obtained from three experimental replicates. (F) Analysis of control, p48cre;KrasG12D and p48cre;KrasG12D;PKD1−/− mice for regions of ADM/PanIN using H&E staining and IHC for claudin-18. Additional controls are depicted in Supplementary Fig. 3. The bar represents 50 μm. (G) Quantitation of ADM and PanIN lesions in p48cre;KrasG12D and p48cre;KrasG12D;PKD1−/− mice.
Figure 4
Figure 4. Active PKD1 is sufficient to drive the formation of duct-like structures
(A) Primary acinar cells were isolated from mouse pancreas, infected with lentivirus harboring control, wildtype PKD1, active PKD1 (PKD1.CA), or kinase-dead PKD1 (PKD1.KD) and seeded in collagen 3D culture. At day 7, ductal structures formed were quantified. (B–D) Primary acinar cells were isolated from mouse pancreas, infected with lentivirus harboring control or active PKD1 (PKD1.CA) and seeded in collagen 3D culture. At day 7, ductal structures formed were photographed and ductal area (n=30) determined (B, the bar represents 100 μm). AC = acinar cells; the arrow indicates duct-like structure. Additionally, ducts were isolated and analyzed for markers of transdifferentiation (anti-CK-19, anti-amylase) and expression of active PKD1 using Western blot (C) or for markers of acinar cell de- and transdifferentiation (Pdx1, Mist-1, CK-19, mucin-1) using quantitative PCR (D). In all figures, * indicates statistical significance (p < 0.05; student’s t-test) as compared to control. Error bars (s. d.) were obtained from three experimental replicates. All experiments shown were performed at least 3 times with similar results.
Figure 5
Figure 5. PKD1 mediates formation of duct-like structures through Notch
(A) Scatter plot showing fold changes in expression of genes in control primary acinar cells or cells expressing constitutively-active PKD1 (PKD1.CA). The center line indicates no difference between the expression of genes under both conditions. The side lines indicate a 4-fold difference in either direction. The genes expressed more than 4-fold in the PKD1.CA group as compared to the control group are labeled in red. The genes expressed lower than 4-fold in the PKD1.CA group are labeled in green. Their role in the Notch pathway as well as fold change is provided in the table. (B) Primary acinar cells were isolated from mouse pancreas and infected with lentivirus harboring (scrambled) control shRNA (Ctrl-shRNA) or 2 different sequences of Notch1-shRNA (#1, #2) specifically targeting mouse Notch1. In addition cells were lentivirally-infected with active PKD1 (PKD1.CA) or control virus as indicated. Cells were then seeded in 3D culture in collagen and formation of ductal structures was quantified. (C) Primary acinar cells were isolated from mouse pancreas and lentivirally-infected with control or GFP-tagged active PKD1 (PKD1.CA; PKD1.S738E/S742E mutant). Cells were then seeded in 3D culture in collagen. At day 6, cells were re-isolated and analyzed by Western bot for activated Notch 1 fragment (NICD). Expression of PKD1.CA was controlled by Western blot against GFP. Silver staining served as a loading control. (D, E) After isolation and infection with control or PKD1.CA harboring lentivirus, primary acinar cells were seeded in collagen 3D culture in absence or presence of the γ-secretase inhibitors DAPT (5 μM) or R04929097 (10 nM) as indicated. At day 6, formation of ductal-structures was determined (D), or cells were isolated from the collagen and analyzed by quantitative PCR for expression of the Notch target genes Hes-1 and Hey-1 (E). (F) Primary acinar cells were isolated from mouse pancreas and infected with lentivirus harboring an active Notch fragment (NICD) or control virus. Cells were then seeded in 3D culture in collagen and formation of ductal structures was quantified. (G, H) Primary acinar cells from LSL-KrasG12D mice were isolated from mouse pancreas and expression of mutant Kras was induced by adenoviral infection of cre-recombinase as indicated (Adeno-Cre; or Adeno-null as control). Cells then were seeded in collagen 3D culture in absence or presence of the γ-secretase inhibitors DAPT (5 μM) or R04929097 (10 nM) as indicated. At day 6, cells were isolated from the collagen and analyzed by quantitative PCR for expression of the Notch target genes Hes-1 and Hey-1 (G), and formation of ductal-structures was determined (H). (I, J) Primary acinar cells were seeded in collagen 3D culture in absence or presence of TGFα (50 ng ml−1) and the γ-secretase inhibitors DAPT (5 μM) or R04929097 (10 nM) as indicated. At indicated days, cells were isolated from the collagen and analyzed by quantitative PCR for expression of the Notch target genes Hes-1 and Hey-1 (I), and formation of ductal-structures was determined (J). In all figures shown in B, D–J, * indicates statistical significance (p < 0.05; student’s t-test) as compared to control, ** indicates statistical significance (p < 0.05; student’s t-test) as compared to stimulus. Error bars (s. d.) were obtained from three experimental replicates. (K) Schematic of a TGFα- and Kras-induced PKD1-Notch signaling pathway that drives formation of pancreatic duct-like structures and PanIN formation. All experiments shown were performed at least 3 times with similar results.

Comment in

References

    1. Bardeesy N, DePinho RA. Pancreatic cancer biology and genetics. Nat Rev Cancer. 2002;2:897–909. - PubMed
    1. Hruban RH, Wilentz RE, Goggins M, Offerhaus GJ, Yeo CJ, Kern SE. Pathology of incipient pancreatic cancer. Ann Oncol. 1999;10 (Suppl 4):9–11. - PubMed
    1. Korc M. Role of growth factors in pancreatic cancer. Surg Oncol Clin N Am. 1998;7:25–41. - PubMed
    1. Hruban RH, et al. Pancreatic intraepithelial neoplasia: a new nomenclature and classification system for pancreatic duct lesions. Am J Surg Pathol. 2001;25:579–586. - PubMed
    1. Morris JPt, Wang SC, Hebrok M. KRAS, Hedgehog, Wnt and the twisted developmental biology of pancreatic ductal adenocarcinoma. Nat Rev Cancer. 2010;10:683–695. - PMC - PubMed

Publication types

MeSH terms