Increased visual sensitivity following periods of dim illumination
- PMID: 25698701
- PMCID: PMC4364638
- DOI: 10.1167/iovs.14-15958
Increased visual sensitivity following periods of dim illumination
Abstract
Purpose: We measured changes in the sensitivity of the human rod pathway by testing visual reaction times before and after light adaptation. We targeted a specific range of conditioning light intensities to see if a physiological adaptation recently discovered in mouse rods is observable at the perceptual level in humans. We also measured the noise spectrum of single mouse rods due to the importance of the signal-to-noise ratio in rod to rod bipolar cell signal transfer.
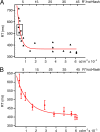
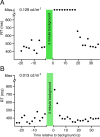
Methods: Using the well-defined relationship between stimulus intensity and reaction time (Piéron's law), we measured the reaction times of eight human subjects (ages 24-66) to scotopic test flashes of a single intensity before and after the presentation of a 3-minute background. We also made recordings from single mouse rods and processed the cellular noise spectrum before and after similar conditioning exposures.
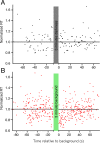
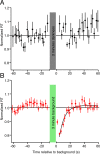
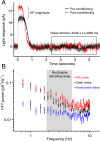
Results: Subject reaction times to a fixed-strength stimulus were fastest 5 seconds after conditioning background exposure (79% ± 1% of the preconditioning mean, in darkness) and were significantly faster for the first 12 seconds after background exposure (P < 0.01). During the period of increased rod sensitivity, the continuous noise spectrum of individual mouse rods was not significantly increased.
Conclusions: A decrease in human reaction times to a dim flash after conditioning background exposure may originate in rod photoreceptors through a transient increase in the sensitivity of the phototransduction cascade. There is no accompanying increase in rod cellular noise, allowing for reliable transmission of larger rod signals after conditioning exposures and the observed increase in perceptual sensitivity.
Keywords: hypersensitivity; phototransduction; rod vision; rods; scotopic sensitivity.
Copyright 2015 The Association for Research in Vision and Ophthalmology, Inc.
Figures

Similar articles
-
Time course of the flash response of dark- and light-adapted human rod photoreceptors derived from the electroretinogram.J Physiol. 2001 Jul 1;534(Pt 1):217-42. doi: 10.1111/j.1469-7793.2001.t01-1-00217.x. J Physiol. 2001. PMID: 11433004 Free PMC article.
-
Dark adaptation of rod photoreceptors in normal subjects, and in patients with Stargardt disease and an ABCA4 mutation.Invest Ophthalmol Vis Sci. 2004 Jul;45(7):2447-56. doi: 10.1167/iovs.03-1178. Invest Ophthalmol Vis Sci. 2004. PMID: 15223829
-
Dark adaptation of human rod bipolar cells measured from the b-wave of the scotopic electroretinogram.J Physiol. 2006 Sep 1;575(Pt 2):507-26. doi: 10.1113/jphysiol.2006.108027. Epub 2006 Jun 15. J Physiol. 2006. PMID: 16777945 Free PMC article.
-
The flash response of rods in vivo.Prog Brain Res. 2001;131:369-81. doi: 10.1016/s0079-6123(01)31030-0. Prog Brain Res. 2001. PMID: 11420956 Review. No abstract available.
-
Regulation of sensitivity in vertebrate rod photoreceptors by calcium.Trends Neurosci. 1996 Feb;19(2):73-81. doi: 10.1016/0166-2236(96)89624-x. Trends Neurosci. 1996. PMID: 8820871 Review.
Cited by
-
Investigating the Ca2+-dependent and Ca2+-independent mechanisms for mammalian cone light adaptation.Sci Rep. 2018 Oct 26;8(1):15864. doi: 10.1038/s41598-018-34073-8. Sci Rep. 2018. PMID: 30367097 Free PMC article.
-
Signalling beyond photon absorption: extracellular retinoids and growth factors modulate rod photoreceptor sensitivity.J Physiol. 2016 Apr 1;594(7):1841-54. doi: 10.1113/JP271650. Epub 2016 Jan 23. J Physiol. 2016. PMID: 26691896 Free PMC article.
-
Retinal Responses to Visual Stimuli in Interphotoreceptor Retinoid Binding-Protein Knock-Out Mice.Int J Mol Sci. 2023 Jun 26;24(13):10655. doi: 10.3390/ijms241310655. Int J Mol Sci. 2023. PMID: 37445836 Free PMC article.
References
-
- Baker H. Initial Stages of dark and light adaptation. JOSA. 1963; 53: 98–103. - PubMed
-
- Geisler W. Mechanisms of visual sensitivity: backgrounds and early dark adaptation. Vision Res. 1983; 23: 1423–1432. - PubMed
-
- Pulos E, Makous W. Changes of visual sensitivity caused by on- and off- transients. Vision Res. 1982; 22: 879–887. - PubMed
-
- Piéron H. Recherches sur les lois de variation des temps de la- tence sensorielle en fonction des intensites excitatrices. L'Annee Psychologique. 1914; 20: 17–96.
Publication types
MeSH terms
Grants and funding
LinkOut - more resources
Full Text Sources
Other Literature Sources

