. 2015 Feb 18;35(7):2959-74.
doi: 10.1523/JNEUROSCI.4287-14.2015.

Reciprocal interareal connections to corticospinal neurons in mouse M1 and S2

Affiliations

Reciprocal interareal connections to corticospinal neurons in mouse M1 and S2

Benjamin A Suter et al. J Neurosci. .

Abstract

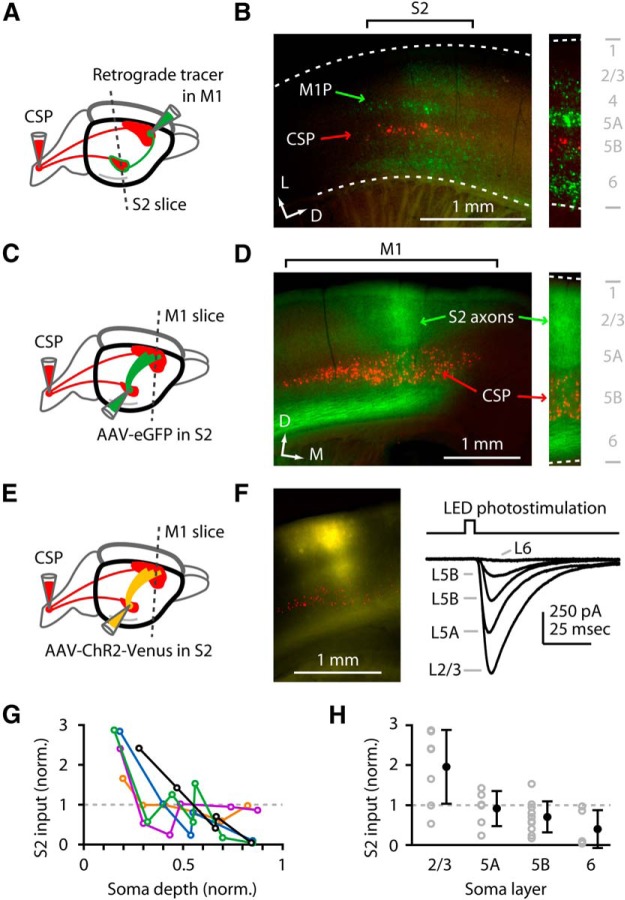
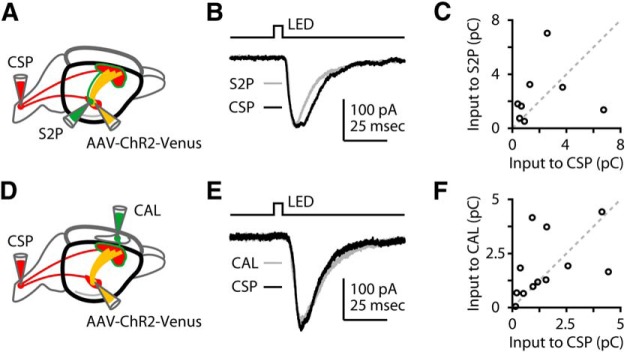
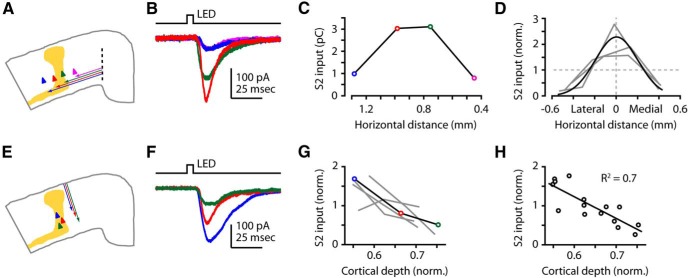
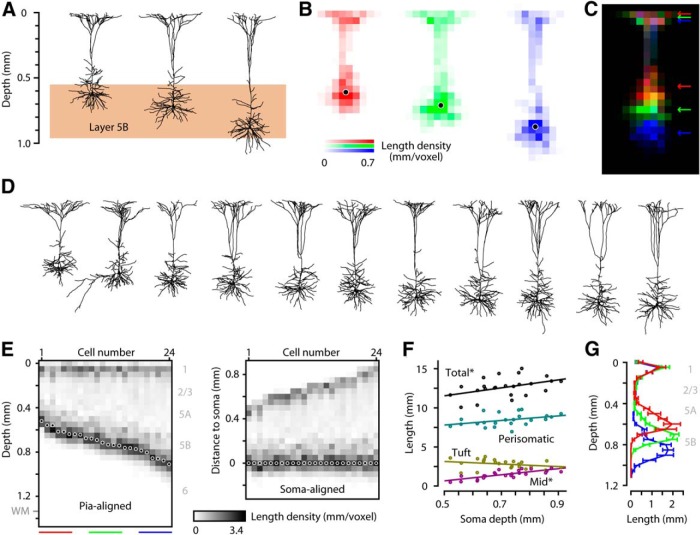
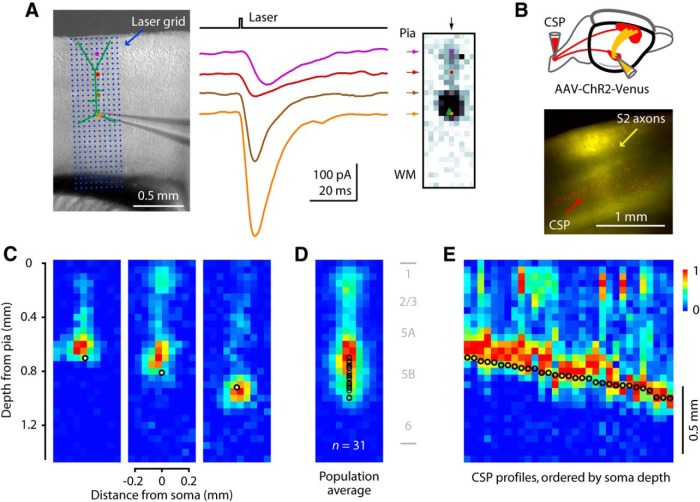
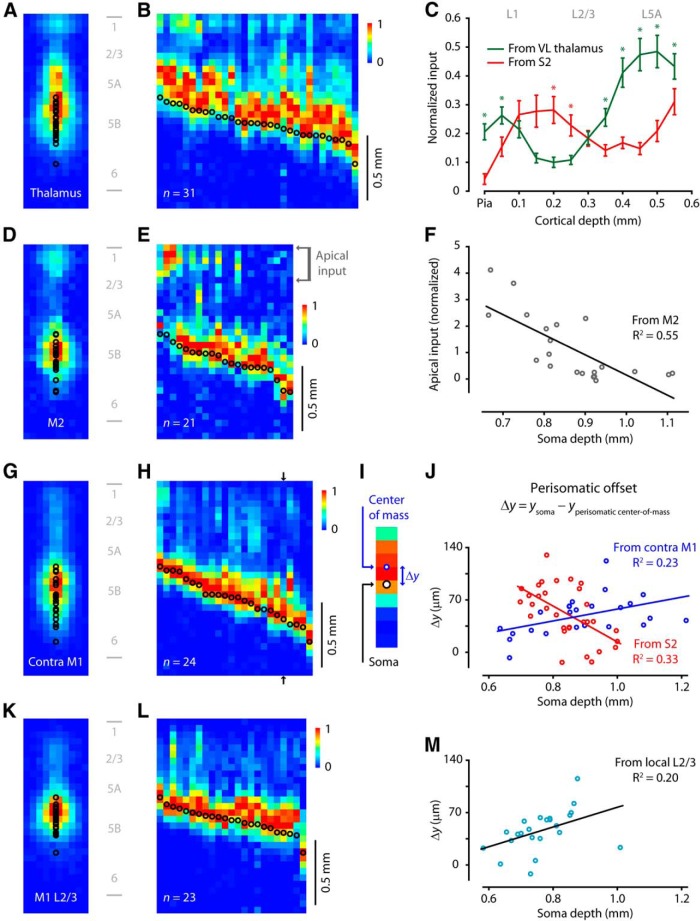
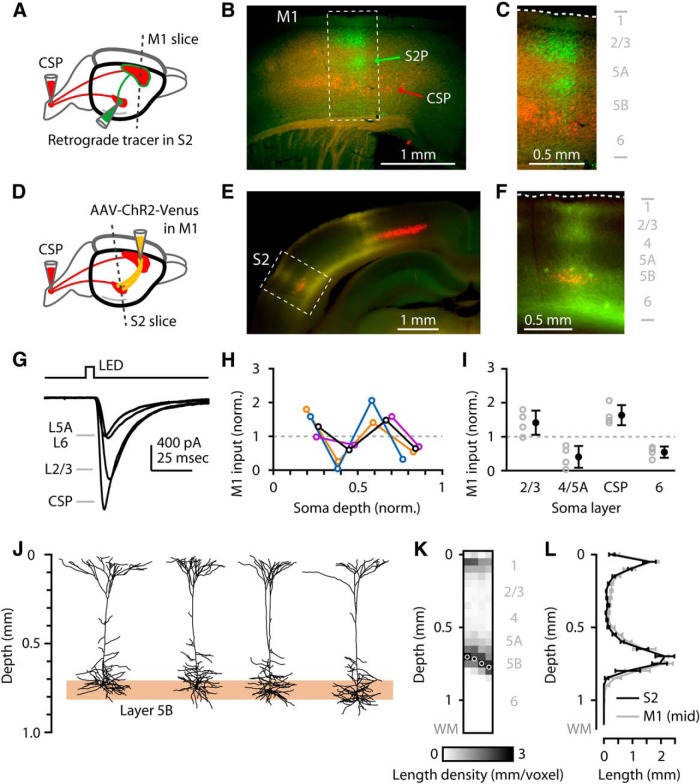
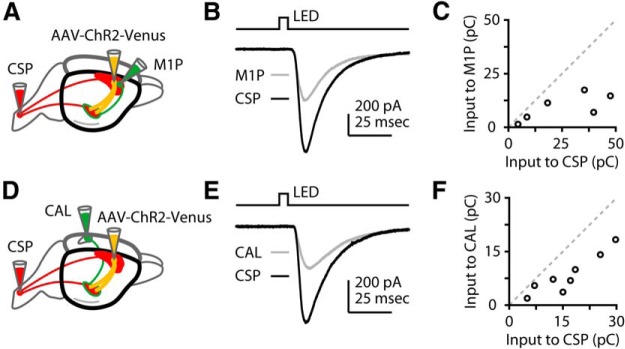
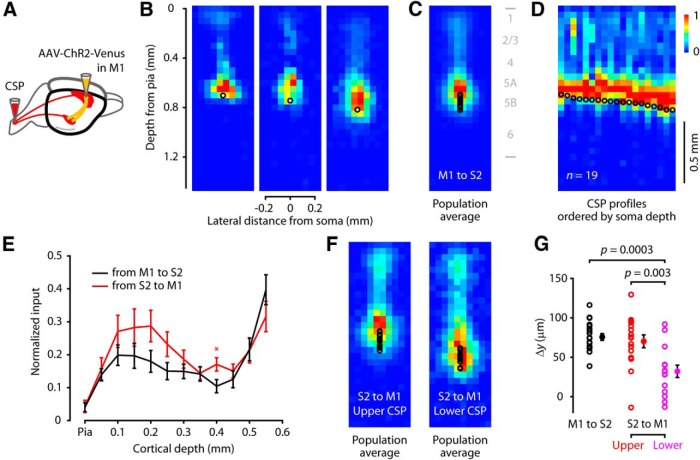
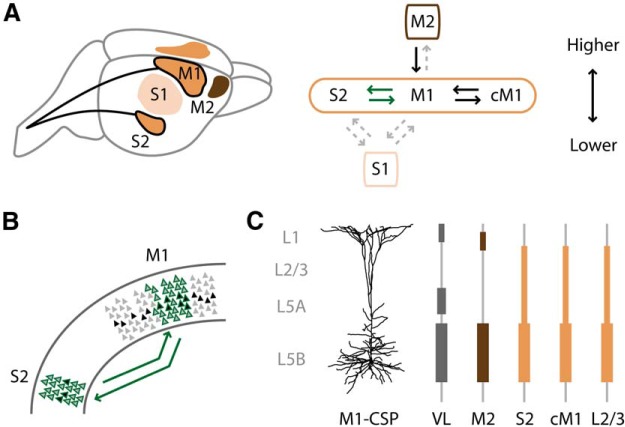
Primary motor (M1) and secondary somatosensory (S2) cortices, although anatomically and functionally distinct, share an intriguing cellular component: corticospinal neurons (CSP) in layer 5B. Here, we investigated the long-range circuits of CSPs in mouse forelimb-M1 and S2. We found that interareal projections (S2 → M1 and M1 → S2) monosynaptically excited pyramidal neurons across multiple layers, including CSPs. Area-specific differences were observed in the relative strengths of inputs to subsets of CSPs and other cell types, but the general patterns were similar. Furthermore, subcellular mapping of the dendritic distributions of these corticocortical excitatory synapses onto CSPs in both areas also showed similar patterns. Because layer 5B is particularly thick in M1, but not S2, we studied M1-CSPs at different cortical depths, quantifying their dendritic morphology and mapping inputs from additional cortical (M2, contralateral M1, and local layer 2/3) and thalamic (VL nucleus) sources. These results indicated that CSPs exhibit area-specific modifications on an otherwise conserved synaptic organization, and that different afferents innervate M1-CSP dendritic domains in a source-specific manner. In the cervical spinal cord, CSP axons from S2 and M1 partly converged on middle layers, but S2-CSP axons extended further dorsally, and M1-CSP axons ventrally. Thus, our findings identify many shared features in the circuits of M1 and S2 and show that these areas communicate via mutual projections that give each area monosynaptic access to the other area's CSPs. These interareally yoked CSP circuits may enable M1 and S2 to operate in a coordinated yet differentiated manner in the service of sensorimotor integration.

Keywords: corticocortical; corticospinal; motor; somatosensory; subcellular.


Figures

Figure 1.
Figure 1.
S2 axons monosynaptically excite M1 neurons across all layers. A, Labeling paradigm. Retrograde tracer injections were made in the spinal cord and M1, and S2 slices were examined for labeling of CSP (red) and M1-projecting corticocortical (M1P) neurons (green). B, Left, Epifluorescence image of labeling pattern in S2 slice. D, Dorsal; L, lateral. Right, Higher-magnification view of laminar distribution of retrogradely labeled neurons. WM, White matter. C, Labeling paradigm. Retrograde tracer was injected in the spinal cord, AAV-eGFP was injected in S2, and M1 slices were prepared to visualize S2 axons in M1. D, Left, Epifluorescence image, showing S2 axons (green) and CSPs (red) in M1. D, Dorsal; M, medial. Right, Higher-magnification image, showing S2 axons in all layers (green; arrows) overlapping with M1-CSPs (red; arrow). E, Labeling paradigm. Retrograde tracer was injected in the spinal cord, AAV-ChR2-Venus was injected in S2, and M1 slices were prepared to visualize and photostimulate S2 axons while recording from CSP and other M1 neurons. F, Left, Example epifluorescence image. Right, Example voltage-clamp traces of photo-evoked responses. Wide-field illumination with a gated LED was used to photostimulate the ChR2-expressing S2 axons (yellow) while recording from M1 neurons in different layers (layer 2/3, etc., as indicated). G, Laminar profiles from several slices, plotted together after normalization (to the mean input per slice). Soma depth was normalized: 0 = pia; 1 = white matter. The black profile corresponds to the example traces in G. H, Same data as in G, but with the values pooled across profiles by layer (gray) and averaged (black) (mean ± SEM).
Figure 2.
Figure 2.
S2 axons similarly excite CSP, S2-projecting, and callosally projecting neurons in layer 5B of M1. A, Labeling paradigm. Retrograde tracers were injected into the spinal cord and S2 cortex to label CSP and S2-projecting (S2P) neurons, and AAV-ChR2-Venus was injected into S2. B, Example traces, recorded from an adjacent pair of CSP and S2P neurons in layer 5B. C, Group data, showing pairwise responses from CSP and S2P neurons. D, Labeling paradigm. Retrograde tracers were injected into the spinal cord and contralateral M1 cortex to label CSP and CAL neurons, and AAV-ChR2-Venus was injected into S2. E, Example traces, recorded from an adjacent pair of CSP and CAL neurons in layer 5B. F, Group data, showing pairwise responses responded from CSP and CAL neurons.
Figure 3.
Figure 3.
S2 axons excite M1-CSP over a narrow horizontal range, strongest in upper layer 5B. A, Recording paradigm. M1 slice indicating four horizontal positions for CSP recordings, and labeled S2 axons. B, Example traces recorded from CSPs at different horizontal positions across the S2 axon zone; colors represent relative positions in A. C, Example horizontal profile corresponding to the traces in B. Horizontal distance is relative to a medial landmark. D, Profiles from three animals. Profiles were amplitude-normalized to the average value per profile and horizontally centered (equal area under the curve on each side of zero). Black curve represents Gaussian fit to the pooled data points after normalization and alignment. E, Recording paradigm. M1 slice indicating CSP recordings made over a range of soma depths. F, Example traces recorded within a single slice; colors represent relative depths in E. G, Normalized profiles. A single profile, corresponding to the traces in F, is highlighted (black line). H, Pooled values from G and linear fit.
Figure 4.
Figure 4.
Dendritic morphology of M1-CSP is mostly independent of soma depth. A, Three examples of 3D-reconstructed CSP neurons at upper, middle, deep depths in band (2D projections). B, Length density maps for each of the example neurons. C, Overlay of example maps separated by color, illustrating overlap in layer 1, but differential coverage in deep layers. D, Additional examples of 3D-reconstructed CSP neurons (n = 11), ordered by soma depth and aligned to pia (2D projections; scale as in A). E, Vertical length density profiles for n = 24 CSP neurons, ordered by soma depth, aligned to pia (left panel); aligned to soma (right panel). Colored bars under the plot indicate the three laminar regions used to group neurons as upper (red), middle (green), and lower (blue) CSP in subsequent analysis (F). F, Relationship between soma depth and length density, for the total dendritic arbors, and separated into perisomatic, tuft, and intervening (mid) dendritic compartments. *Significant depth dependence. G, Group analysis of upper, middle, and deep CSPs, grouped by soma depth as indicated in D.
Figure 5.
Figure 5.
S2 axons innervate M1-CSP perisomatically and along apical dendrites, except in layer 1. A, sCRACM technique. Left, Brightfield image of motor cortex and recording pipette, with overlay indicating laser photostimulation grid (array of blue dots with 30 rows, 10 columns, 50 μm spacing). Stimulation sites along a selected column are indicated with colored circles. Middle, Example traces with colors corresponding to the stimulation sites in the column highlighted at left, ranging from superficial (purple) to deep (orange). Right, sCRACM map: the integral of each trace is converted to pixel intensity. Arrows point to the pixels corresponding to the four example traces. B, Schematic showing injection paradigm (left), and image of S2 axons (yellow) in M1, with labeled CSPs (red). C, S2 to M1: three example maps; black circles represent CSP soma position. D, Average sCRACM map (n = 31 neurons). E, Input profiles by soma depth. Each CSP neuron's sCRACM map was converted to a single vertical profile (vector), and the collection of profiles was pooled and ordered by soma position.
Figure 6.
Figure 6.
Axons from four other sources innervate M1-CSPs in source-specific subcellular input patterns. A, Average sCRACM map of thalamic input to M1-CSPs (n = 31 neurons). B, Input profiles by soma depth. Each CSP neuron's sCRACM map was converted to a single vertical profile (vector), and the collection of profiles was pooled and sorted by soma position. C, Comparison of thalamic (green) and S2 (red) input to the apical arbor (average across 31 neurons for each source ± SEM). *Statistically significant difference (p < 0.05, Wilcoxon rank-sum test). D, Average sCRACM map of M2 input to M1-CSPs (n = 21 neurons). E, Input profiles by soma depth. F, Plot of apical input versus soma depth. Apical input was calculated as the sum over the top 275 μm of each map (region indicated in E). Line indicates linear regression. G, Average sCRACM map of contralateral M1 input to M1-CSPs (n = 24 neurons). H, Input profiles by soma depth. I, Illustration of center-of-mass calculation. A zoomed-in view of the perisomatic rows from a single profile (black arrows in H) is shown. The perisomatic offset (Δy) is the soma depth minus the center of mass of the perisomatic input (over the range ±225 μm from the soma). J, Perisomatic offset versus soma depth. Blue represents input from contralateral M1. Red represents input from S2. Lines indicate linear regressions. K, Average sCRACM map of layer 2/3 inputs to M1-CSPs (n = 23 neurons). L, Input profiles by soma depth. M, Location of perisomatic input from layer 2/3 relative to soma position, plotted as a function of soma depth. For each profile, the input depth was calculated as the center of mass across the perisomatic pixels.
Figure 7.
Figure 7.
M1 axons monosynaptically excite S2 neurons across all layers. A, Injection paradigm. Retrograde tracer injections were made in the spinal cord and in S2, and M1 slices were examined for labeling of CSP and S2-projecting corticocortical (S2P) neurons. B, Low-magnification epifluorescence image showing retrograde labeling pattern in M1 slice (CSP red, S2P green). C, Higher-magnification view of the labeling pattern. D, Injection paradigm. Retrograde tracer was injected in spinal cord, AAV-ChR2-Venus was injected in M1, and S2 slices were prepared to visualize and photostimulate M1 axons while recording from CSP and other S2 neurons. E, Low-magnification epifluorescence image showing M1 axons (yellow) and CSPs (red) in S2. F, Higher-magnification image showing M1 axons (yellow) overlapping with S2-CSPs (red; arrow). G, Example traces. Wide-field illumination with a gated LED was used to photostimulate the ChR2-expressing M1 axons while recording from S2 neurons in different layers (as indicated). H, Laminar profiles of M1 input to S2. Each colored line indicates a profile obtained in a single slice. Data were normalized to the mean value per profile. Soma depth was normalized: 0 = pia; 1 = white matter. The black profile corresponds to the example traces in G. I, Same experiments as in the previous panel, but with the values (gray) pooled across profiles by layer and averaged (black, mean ± SEM). J, Four 3D-reconstructed S2-CSP neurons (2D projections) from different depths in layer 5B (shaded region). K, Vertical length density profiles for the neurons in J, aligned to the pia. L, Group average of the length density as a function of cortical depth for S2-CSP (black) and for a subset of M1-CSP (gray, n = 4) at matching soma depths.
Figure 8.
Figure 8.
M1 axons excite layer 5B neurons in S2 with a bias toward CSP. A, Labeling paradigm. Retrograde tracers were injected into the spinal cord and M1 cortex to label CSP and M1-projecting (M1P) neurons, and AAV-ChR2-Venus was injected into M1. B, Example traces, recorded from an adjacent pair of CSP and M1P neurons in layer 5B. C, Group data, showing pairwise responses from CSP and M1P neurons. D, Labeling paradigm. Retrograde tracers were injected into the spinal cord and contralateral S2 cortex to label CSP and CAL neurons, and AAV-ChR2 was injected into M1. E, Example traces, recorded from an adjacent pair of CSP and CAL neurons in layer 5B. F, Group data, showing pairwise responses from CSP and CAL neurons.
Figure 9.
Figure 9.
M1 axons innervate S2-CSP dendrites much like the S2 → M1-CSP subcellular input pattern. A, Labeling paradigm. Retrograde tracer was injected into the spinal cord to label CSP neurons, and AAV-ChR2-Venus was injected into M1. B, Three example maps; black circles represent CSP soma position. C, Average sCRACM map of M1 input to S2-CSPs (n = 19 neurons). D, Input profiles by soma depth. Each CSP neuron's sCRACM map was converted to a single vertical profile (vector), and the collection of profiles was pooled and ordered by soma position. E, Comparison of input (average ± SEM for each source) to the apical arbor from M1 to S2-CSP (black, n = 19 neurons) and from S2 to M1-CSP (red, n = 31 neurons). A single bin was significantly different and is indicated with an asterisk (p < 0.05, Wilcoxon rank-sum test). F, Average sCRACM map of S2 input to upper M1-CSPs (n = 16 neurons; left), and to lower M1-CSPs (n = 15 neurons, right). G, Location of interareal perisomatic input relative to soma position. For each profile, the input depth was calculated as the center of mass across the perisomatic pixels. The offset for M1 to S2-CSPs differs compared with S2 input to lower M1-CSPs, but not compared with upper M1-CSPs.
Figure 10.
Figure 10.
M1-CSP and S2-CSP axons differentially project to cervical spinal cord. A, Labeling paradigm. AAV-tdTomato was injected into M1, and AAV-eGFP was injected into S2. B, Two-photon image taken at the level of the pyramidal decussation. Red: M1 axons; green: S2 axons. The axons travel together in the decussation (their overlap appearing as yellow). In the gray matter of the spinal cord, the M1 axons are distributed mostly medially and the S2 axons mostly laterally; both are mostly in the dorsal half of the cord. C, Image from same animal at the level of C1. D, Higher-magnification view of the region of interest marked by the box in the preceding panel.
Figure 11.
Figure 11.
Schematics summarizing some of the findings. A, Hierarchical relationships among sensorimotor areas. The approximate anatomical locations of M1, S2, M2, and S1 are depicted on the left, and the hierarchical relationships are depicted on the right, with S2 and M1 at approximately the same level. cM1, Contralateral M1. Bold arrows indicate interareal projections studied here; gray dashed arrows indicate known projections not studied here. B, Interareal projections between M1 and S2. The presynaptic and postsynaptic neurons were distributed across multiple cortical layers (green-outlined pyramids). Corticospinal neurons (black-filled pyramids) were among the postsynaptic neurons that were innervated. Whereas most of S2 was involved in these interareal projections, a subregion of M1 was involved, similar to findings in the rat (for the S2 → M1 projection) (Smith and Alloway, 2013). C, Subcellular innervation of M1-CSP dendrites by different afferent sources. The vertical positions and the widths of the shaded boxes show qualitatively the laminar location and relative strength of input. VL, Ventrolateral nucleus of thalamus.

Similar articles

Cited by

References

    1. Alloway KD. Information processing streams in rodent barrel cortex: the differential functions of barrel and septal circuits. Cereb Cortex. 2008;18:979–989. doi: 10.1093/cercor/bhm138. - DOI - PubMed
    1. Anderson CT, Sheets PL, Kiritani T, Shepherd GMG. Sublayer-specific microcircuits of corticospinal and corticostriatal neurons in motor cortex. Nat Neurosci. 2010;13:739–744. doi: 10.1038/nn.2538. - DOI - PMC - PubMed
    1. Bachmann LC, Lindau NT, Felder P, Schwab ME. Sprouting of brain stem-spinal tracts in response to unilateral motor cortex stroke in mice. J Neurosci. 2014;34:3378–3389. doi: 10.1523/JNEUROSCI.4384-13.2014. - DOI - PMC - PubMed
    1. Brecht M, Sakmann B. Dynamic representation of whisker deflection by synaptic potentials in spiny stellate and pyramidal cells in the barrels and septa of layer 4 rat somatosensory cortex. J Physiol. 2002;543:49–70. doi: 10.1113/jphysiol.2002.018465. - DOI - PMC - PubMed
    1. Burton H. Second somatosensory cortex and related areas. In: Jones EG, Peters A, editors. Cerebral cortex: sensory-motor areas and aspects of cortical connectivity. New York: Plenum; 1986. pp. 31–98.

Publication types

MeSH terms

LinkOut - more resources