. 2015 Feb 18;35(7):2975-91.
doi: 10.1523/JNEUROSCI.2700-14.2015.

Mapping of functionally characterized cell classes onto canonical circuit operations in primate prefrontal cortex

Affiliations

Mapping of functionally characterized cell classes onto canonical circuit operations in primate prefrontal cortex

Salva Ardid et al. J Neurosci. .

Abstract

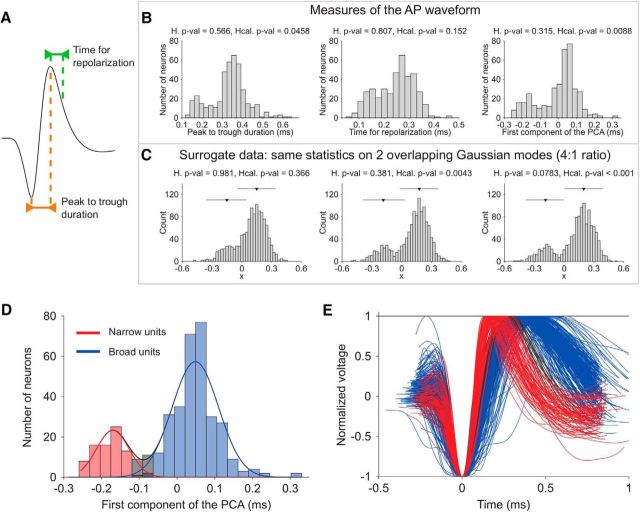
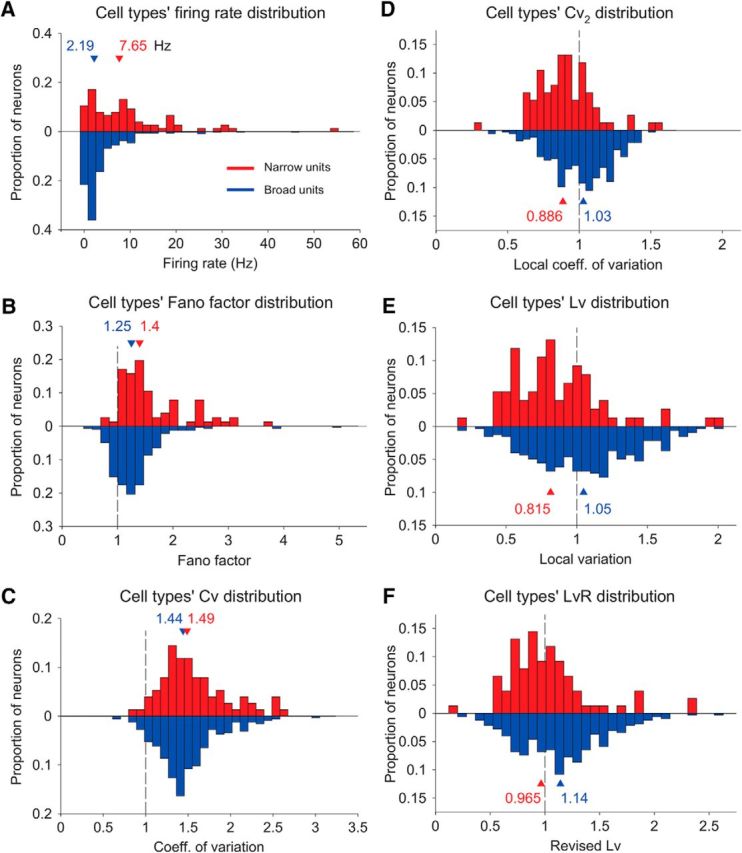
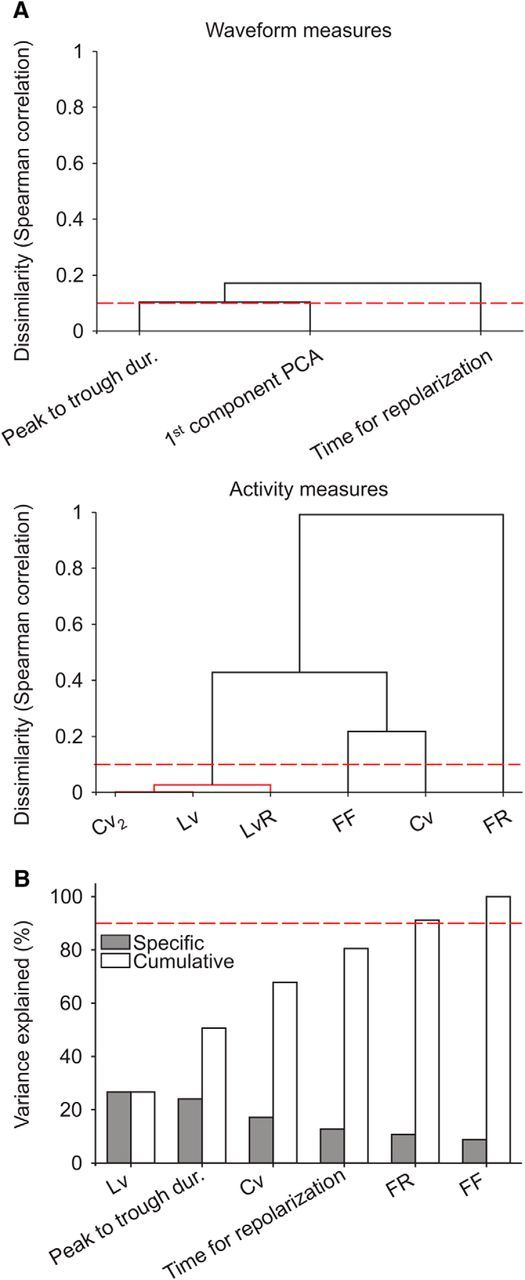
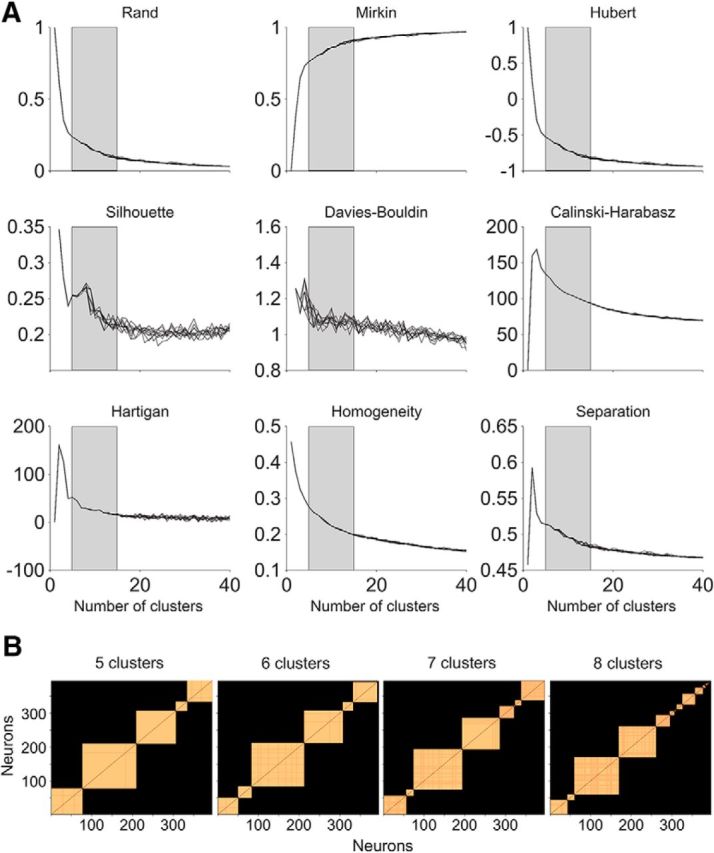
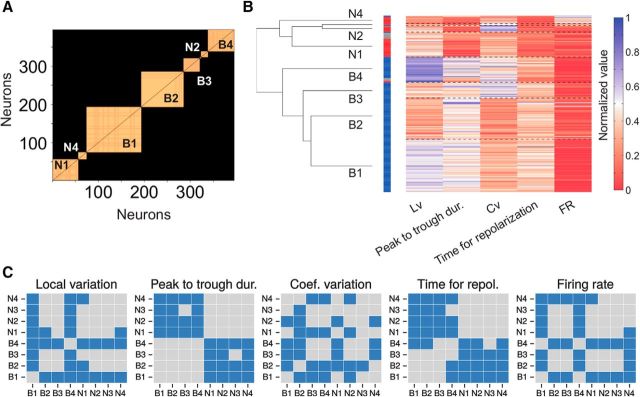
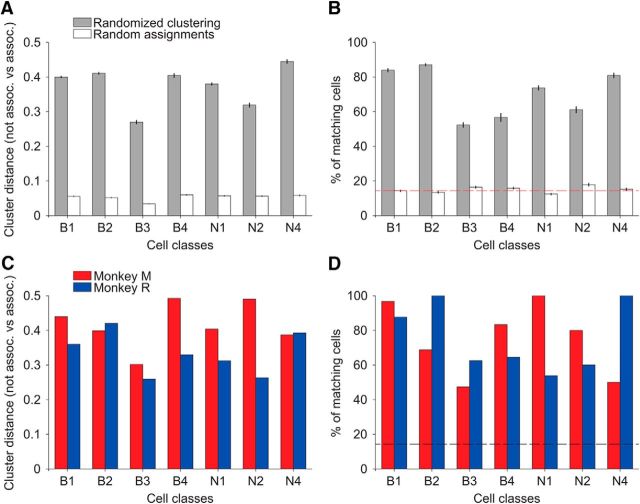
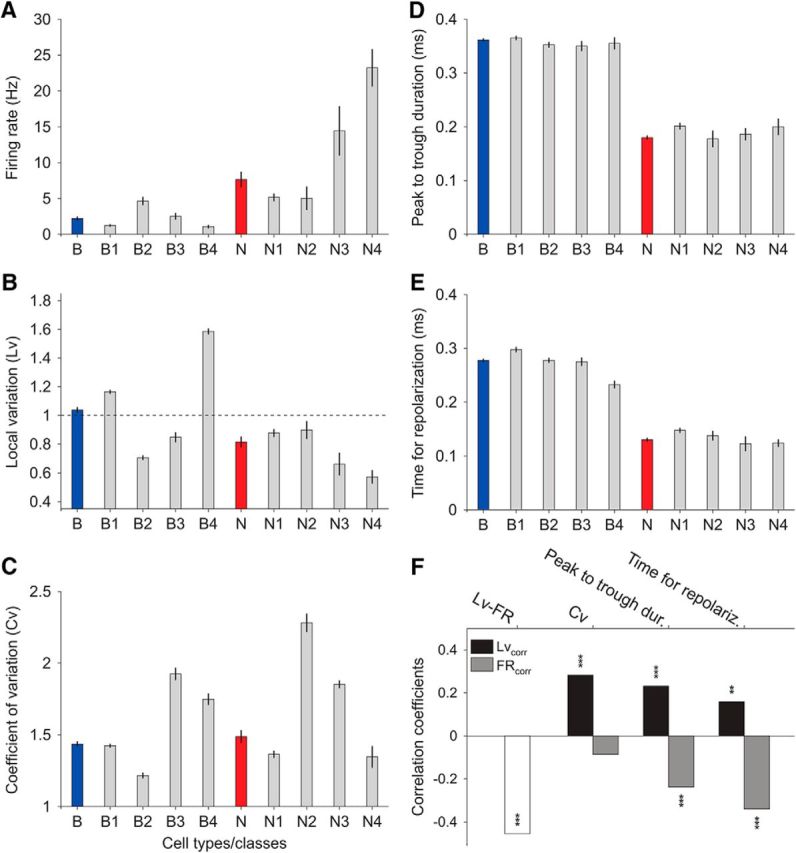
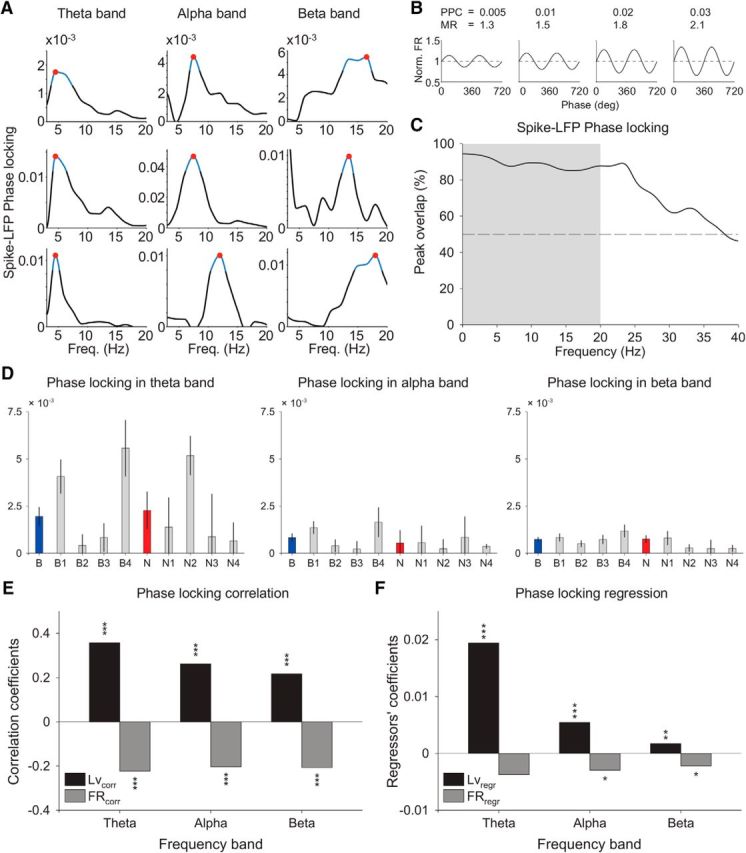
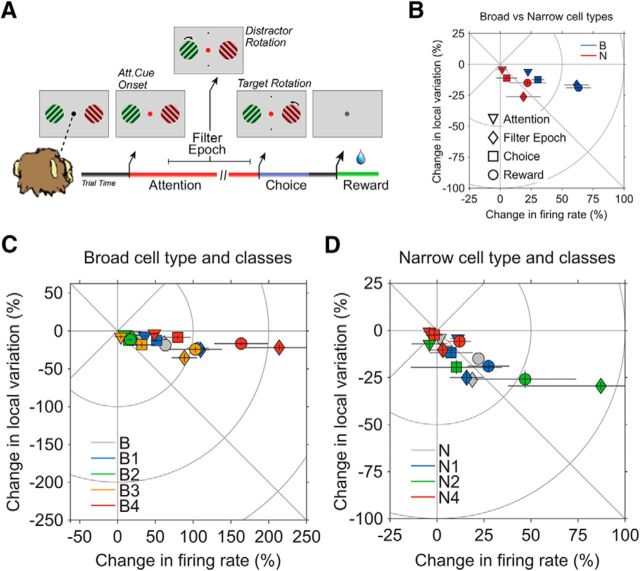
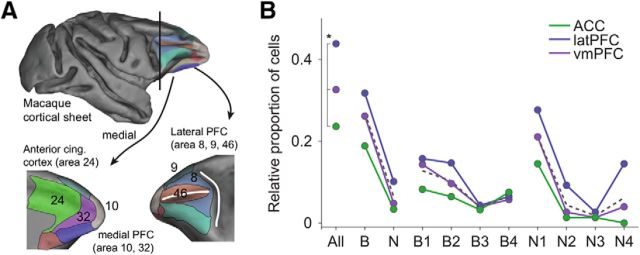
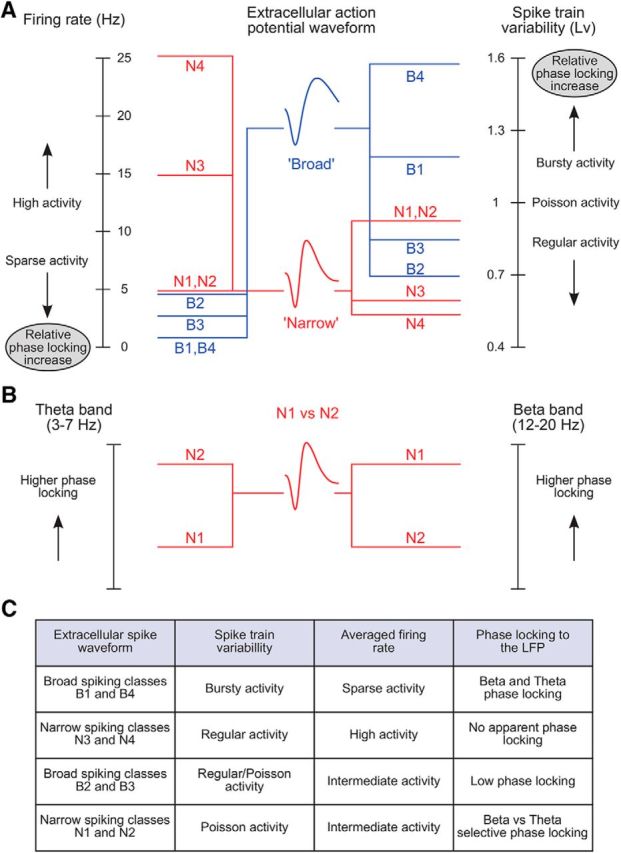
Microcircuits are composed of multiple cell classes that likely serve unique circuit operations. But how cell classes map onto circuit functions is largely unknown, particularly for primate prefrontal cortex during actual goal-directed behavior. One difficulty in this quest is to reliably distinguish cell classes in extracellular recordings of action potentials. Here we surmount this issue and report that spike shape and neural firing variability provide reliable markers to segregate seven functional classes of prefrontal cells in macaques engaged in an attention task. We delineate an unbiased clustering protocol that identifies four broad spiking (BS) putative pyramidal cell classes and three narrow spiking (NS) putative inhibitory cell classes dissociated by how sparse, bursty, or regular they fire. We speculate that these functional classes map onto canonical circuit functions. First, two BS classes show sparse, bursty firing, and phase synchronize their spiking to 3-7 Hz (theta) and 12-20 Hz (beta) frequency bands of the local field potential (LFP). These properties make cells flexibly responsive to network activation at varying frequencies. Second, one NS and two BS cell classes show regular firing and higher rate with only marginal synchronization preference. These properties are akin to setting tonically the excitation and inhibition balance. Finally, two NS classes fired irregularly and synchronized to either theta or beta LFP fluctuations, tuning them potentially to frequency-specific subnetworks. These results suggest that a limited set of functional cell classes emerges in macaque prefrontal cortex (PFC) during attentional engagement to not only represent information, but to subserve basic circuit operations.

Keywords: anterior cingulate cortex; cell types; clustering; nonhuman primates; synchronization; variability.


Figures

Figure 1.
Figure 1.
Two distinct cell types in macaque prefrontal cortex: broad and narrow spiking cells. A, Illustration of the two features used to characterize extracellular APs: the peak-to-trough duration and the time for repolarization. B, Distribution across cells of the peak-to-trough durations (left), the time for repolarization (middle), and the first component of the PCA, linear combination of the two raw measures (right). The calibrated Hartigan's dip test discarded unimodality with a highly reliable significance only on the distribution resultant from the PCA analysis. C, Sensitivity of original versus calibrated Hartigan's dip test to reject unimodality on surrogate data with modes of different size. We confirmed that the calibrated version is more sensitive by using overlapping Gaussian modes in a 4:1 ratio (similar to the ratio between broad and narrow cell types in B). Triangles represent the median and lines represent the SE of each mode. Middle, Best reproduces the two modes in the PCA distribution (B, right). D, The distributions of narrow spiking cells and broad spiking cells were better fitted with two rather than one Gaussian component. Three sets of cells were then identified according to a conservative criterion: broad cells (blue), narrow cells (red), and nonreliably characterized cells (gray). See Materials and Methods for further details. E, Normalized APs of all cells, showing distinct AP shapes of narrow (red) and broad (blue) cells. Gray-coded APs mark the cells that were classified as intermediate between narrow and broad in D.
Figure 2.
Figure 2.
Distinct firing properties in the two cell types. A–F, Characterization of the spike trains of narrow spiking cells (red) and broad spiking cells (blue) according to the average firing rate (A), the Fano factor (B), the coefficient of variation (C), the local coefficient of variation (D), the local variation (E), and the revised local variation (F). From them all, only the distributions of coefficient of variations between narrow and broad cell types (C) did not reach a significant difference.
Figure 3.
Figure 3.
Preclustering analysis disregarding redundant and uninformative measures. Measures were previously normalized to be in the same range [0,1]. A, Dissimilarity among cell features. We used a cutoff of 0.1 as a criterion for the dissimilarity between measures (red dashed line). Top, Dendrogram of waveform measures based on nearest distance, using Spearman correlation as a metric. The two raw measures of the waveform, the peak-to-trough duration and time for repolarization, were above threshold and passed this filter. The first component of the PCA, linear combination of the two waveform measures, was only represented to ease the comparison with the two raw measures. Bottom, Analogous dendrogram for activity measures. The local variation, local coefficient of variation, and revised local variation were below threshold and then considered mutually redundant. From the three, the local variation was more representative of the centroid (center of the branch in the dendrogram) and then considered in posterior analyses. B, Amount of information brought by cell features. Cell features were progressively incorporated to the subsequent clustering analysis until a cutoff of 90% of the total variance explained in the dataset was reached (red dashed line). The remaining feature, the Fano factor, was disregarded under the criterion that it was barely informative about the gross variability.
Figure 4.
Figure 4.
Estimating the number of distinct cell classes in the prefrontal microcircuit. A, A committee of metrics was used to narrow down the range of number of clusters. We limited the range of proper numbers of clusters in the K-means algorithm (from the original [1, 40] range to [5, 15]; gray-shaded area) based on the near-asymptotic behavior of a set of indices that evaluate the quality of the clustering: Rand, Mirkin, Hubert, Silhouette, Davies–Bouldin, Calinski–Harabasz, Hartigan, Homogeneity, and Separation. The different lines that appear in each part correspond to different initializations (n = 10). See text for details. B, Distribution of cells after imposing k distinct clusters. We used the symmetric reverse Cuthill–McKee permutation to ease visualization of how the different neurons clustered together and the proportion of neurons that remained unclustered after imposing k in [5, 15] in the K-means algorithm (only k in [5, 8] shown). This permutation was applied to sparse pairwise matrices that, for each k, encoded the probability for any two neurons to belong to the same cluster. This probability is represented in the each part in orange scale. A lower cutoff for probabilities <90% was used (see text for details), so they appear in black. The result of the permutation is a reorganization of neurons, so the highest probabilities appear closest to the diagonal.
Figure 5.
Figure 5.
Seven reliable cell classes emerge from clustering five cell features: two properties of the extracellular spike waveform, two measures of the spike train statistics, and the firing rate magnitude. A, Distribution of the seven classes of cells. We used the symmetric reverse Cuthill–McKee permutation to ease visualization of how the different neurons clustered together and the proportion of neurons that remained unclustered (n = 4) after imposing seven clusters in the K-means algorithm (tested k in [5,15]; Fig. 4B). B, Heat map of cell features (x-axis) across all cells (y-axis) with red to blue corresponding to increasing normalized values. Dashed lines show cell class borders with the dendrogram on the left showing the square Euclidean distances between clusters' centroids. The color bar on the left encodes cell type: narrow/broad/unclassified cells in red/blue/gray, respectively. C, How cell properties contributed to distinguish among cell classes. For each of the five measures that characterize neurons, we applied a Kruskal–Wallis test with Bonferroni correction for multiple comparisons to address whether individual measures were significantly different (blue), or not (gray), between each pair of cell classes.
Figure 6.
Figure 6.
Validation of the identified cell classes appearing in Figure 5. A, B, Validating the meta-clustering analysis by using dataset randomization (n = 200 realizations). Dataset randomization with repetitions guarantees the same sample size with respect to control. A, Validation according to cluster distance. In each realization, each cluster was associated to the closest cell class in Figure 5, e.g., B1. From all realizations and for each cell class, the difference between the mean of the intradistances (i.e., all clusters that were associated to the same cell class, e.g., B1) with respect to the extradistances (i.e., all clusters that were not associated to that cell class, e.g., B2–B4 and N1–N4) is plotted (gray bars). The white bars show the respective results from random assignation. B, Validation according to the proportion of cell matches. In each realization, the proportion was the number of consistently associated cells to a class, over the total number of control cells in the class that was selected by the randomization procedure. As in A, gray bars refer to dataset randomization (mean and SE) and white bars to random assignation (mean and SE). The red dashed line represents the proportion of cells as if cells would evenly distribute among the seven reliable cell classes. C, D, Validating the meta-clustering analysis by splitting the datasets of the two monkeys. C, Validation according to cluster distance. Analogous analysis to A for each monkey dataset (Monkey M in red and Monkey R in blue). D, Validation according to proportion of cell matches. Analogous analysis to B for each monkey dataset. The black dashed line represents the proportion of cells as if cells would evenly distribute among the seven reliable cell classes.
Figure 7.
Figure 7.
Comparison of each cell property among cell classes. A, Firing rate in cell classes and their respective cell type. B–E, Same for local variation, coefficient of variation, peak-to-trough duration, and time for repolarization, respectively. F, Correlation of cell properties to the firing pattern. Given the systematic negative correlation between firing rate and local variation across cell types and respective classes (A vs B), we evaluated across all cells the Pearson correlation between local variation and firing rate, and then how other cell properties correlated to each of these two.
Figure 8.
Figure 8.
Functional relationship between phase locking and firing pattern. A, Spike-LFP phase-locking cell exemplars in theta (3–7 Hz), alpha (7–12 Hz), and beta (12–20 Hz) frequency bands. The peak in phase-locking strength is represented by the red dot and the blue line reflects the frequency region in which the phase locking was reliable and significant. See Material and Methods for more specific details about the phase-locking analysis. B, PPC and its relation with the modulation of firing rate (MR = FRpeak/FRtrough). MR represents the highest firing rate modulation. C, Reliable frequency localization (±5%) of the phase-locking peak with and without spike removal interpolation. Approximately 90% of the peaks within theta, alpha, and beta bands (up to 20 Hz) stayed largely unaltered after spike removal interpolation. This analysis confirms that spikes leak to the LFP mostly on higher frequency bands (>25 Hz). D, Weighted phase-locking strength in cell types and their respective cell classes. Weighted phase locking for each cell was scaled by the Rayleigh statistics across frequencies within a band (see text). Left, The median and SE of each group of cells in the theta band. Center, Same for the alpha band. Right, Same for the beta band. E, Phase-locking correlation with the firing pattern. Local variation and firing rate were highly correlated with the weighted phase-locking strength in theta, alpha, and beta bands (p < 0.001, Pearson correlation). F, Coefficients and significance of regressors in a frequency band-specific regression analysis of the weighted PPC with respect to the five cell properties (only local variation and firing rate shown). D–F, These observations remained qualitatively unaltered if raw PPC was used instead of weighted PPC (data not shown).
Figure 9.
Figure 9.
Epoch-specific shift in firing pattern. A, Selective attention task. Monkeys had to keep fixation to a centered point through the course of a trial, while presented in front of two peripheral grating stimuli. First, both grating stimuli changed their color to either green or red, the location of which was random. Then, the fixation point changed its color to match one of the two gratings, and the monkeys had to use this cue instruction to covertly attend the relevant stimulus. Monkeys had then to wait until the relevant stimulus rotated, filtering out a potential rotation of the distractor stimulus, and finally report it with a saccadic response to one of two target locations (top vs bottom) in association with a clockwise versus counterclockwise rotation. Monkeys only received reward after a correct consecution of the task in the trial. See Material and Methods for more specific details of the task. For the subsequent analysis of epoch-dependent change in firing pattern, we preselected epochs with high cognitive demand: Attention, Filter Epoch, Choice, and Reward. B, Epoch-specific change in firing pattern for broad and narrow spiking cell types. Solid lines in each data point represent SEs associated to the changes in firing rate and local variation. C, D, Epoch-specific change in firing pattern within broad (C) and narrow (D) cell classes. Cells in N3 were not considered in the analysis because they were not informative about any reliable cell class and, given its small sample size (n = 4), their basic contribution was to bring noise to the plot representation, diminishing the salience of the other truly representative narrow cell classes.
Figure 10.
Figure 10.
Anatomical topography of cell classes. A, Illustration of the three anatomical subdivisions in prefrontal and anterior cingulate cortex where cells were recorded on semi-inflated cortical sheets (see Materials and Methods). B, The proportion of cells recorded within the anterior cingulate cortex and ventromedial (vm) and lateral (lat) prefrontal cortex was significantly different among the three regions (Bonferroni corrected p value for multiple comparisons: p < 0.0167, n = 3). Region-specific cell types or cell classes did not significantly differ from this original recording bias (Bonferroni corrected p value for multiple comparisons: p > 0.005, n = 10). Dashed lines represent the averaged proportion of cells across regions. Note that the proportion of cell classes was normalized for each of the groups independently (All-B-N, B1–B4, and N1–N4) to ease a visual comparison between the different subgroups.
Figure 11.
Figure 11.
Schematic overview relating cell class-specific firing rate, spike train variability, and phase locking. A, Left, Firing rates in cell classes span from sparse to high activity, which specifically relate to broad and narrow action potential waveforms. Right, Local spike train variability (Lv) in classes of cells maps onto cells with broad and narrow waveforms. Within each cell type, cell classes show a systematic relationship, so that the higher the level of irregularity (regular to Poisson to burstiness), the more sparse is the activity and the higher is the phase-locking strength. Shown links are based on the specific properties of each cell class presented in Figures 7, A and B (median firing rate and local variation, respectively), and 8D (phase-locking strength). B, N1 and N2 cell classes possess similar firing rate and local variability but diverge in their preference to synchronize to the local field potential in beta and theta frequency bands, respectively. C, Four highly different sets of firing properties in the prefrontal microcircuit.

References

    1. Akam T, Kullmann DM. Oscillatory multiplexing of population codes for selective communication in the mammalian brain. Nat Rev Neurosci. 2014;15:111–122. doi: 10.1038/nrn3668. - DOI - PMC - PubMed
    1. Ardid S, Wang X-J. A tweaking principle for executive control: neuronal circuit mechanism for rule-based task switching and conflict resolution. J Neurosci. 2013;33:19504–19517. doi: 10.1523/JNEUROSCI.1356-13.2013. - DOI - PMC - PubMed
    1. Asaad WF, Eskandar EN. A flexible software tool for temporally-precise behavioral control in Matlab. J Neurosci Methods. 2008a;174:245–258. doi: 10.1016/j.jneumeth.2008.07.014. - DOI - PMC - PubMed
    1. Asaad WF, Eskandar EN. Achieving behavioral control with millisecond resolution in a high-level programming environment. J Neurosci Methods. 2008b;173:235–240. doi: 10.1016/j.jneumeth.2008.06.003. - DOI - PMC - PubMed
    1. Ascoli GA, Alonso-Nanclares L, Anderson SA, Barrionuevo G, Benavides-Piccione R, Burkhalter A, Buzsaki G, Cauli B, Defelipe J, Fairen A, Feldmeyer D, Fishell G, Fregnac Y, Freund TF, Gardner D, Gardner EP, Goldberg JH, Helmstaedter M, Hestrin S, Karube F, et al. Petilla terminology: nomenclature of features of GABAergic interneurons of the cerebral cortex. Nat Rev Neurosci. 2008;9:557–568. doi: 10.1038/nrn2402. - DOI - PMC - PubMed

Publication types