. 2015 Feb 18;35(7):2992-3000.
doi: 10.1523/JNEUROSCI.4432-14.2015.

Cell assemblies of the basal forebrain

Affiliations

Cell assemblies of the basal forebrain

David Tingley et al. J Neurosci. .

Abstract

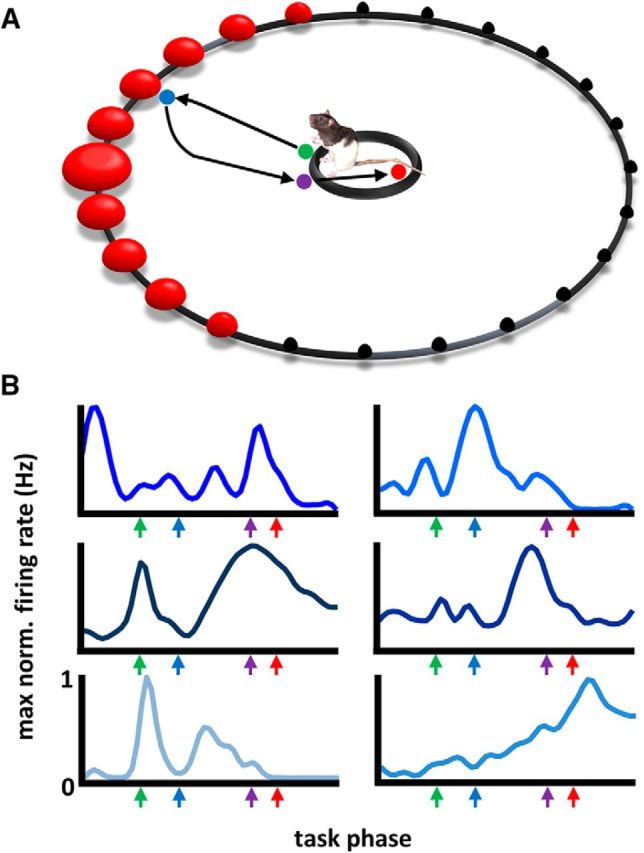
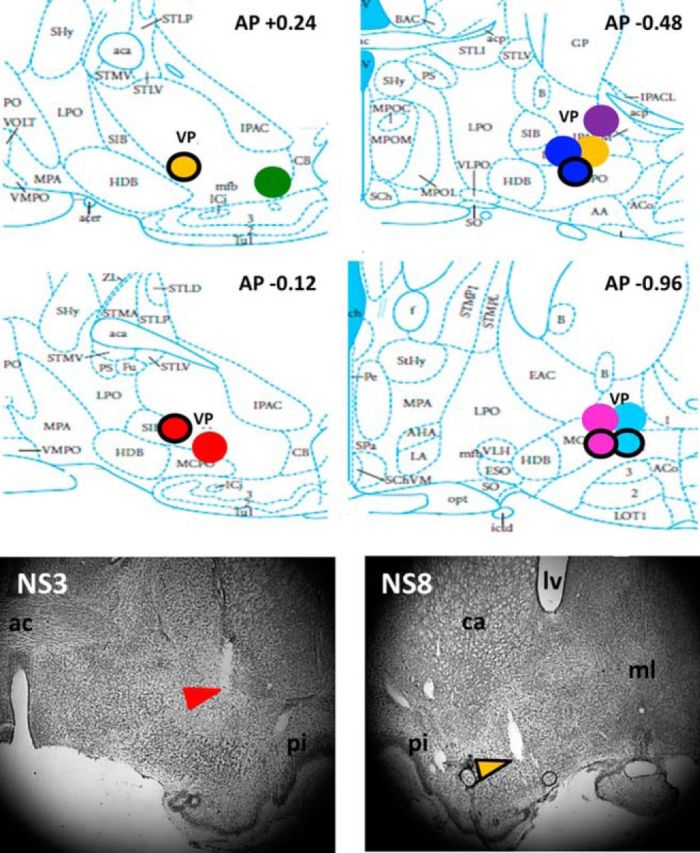
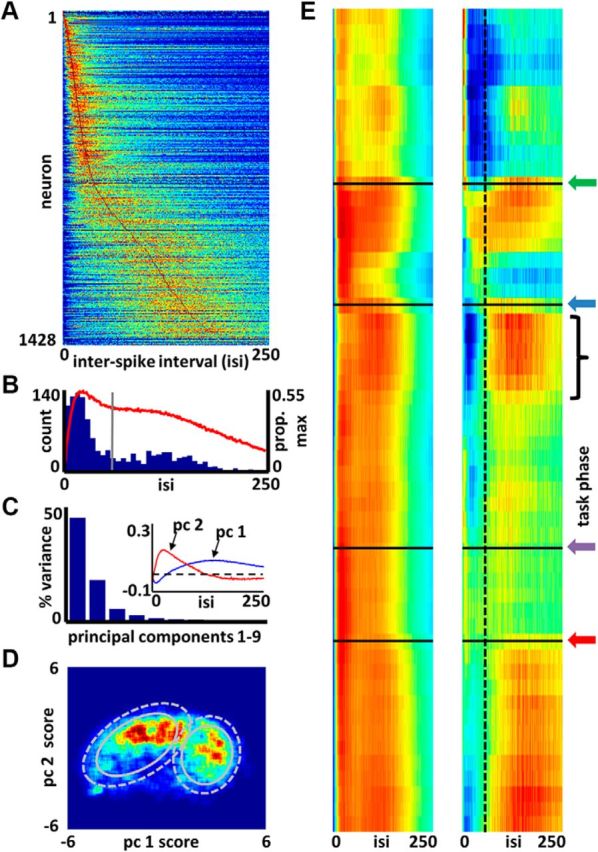
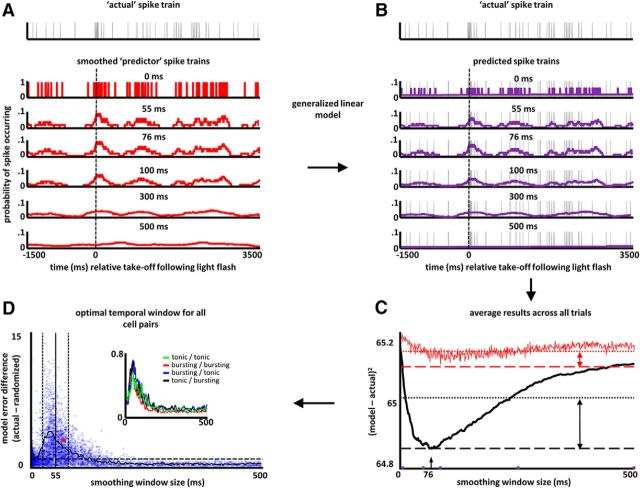
The basal forebrain comprises several heterogeneous neuronal subgroupings having modular projection patterns to discrete sets of cortical subregions. Each cortical region forms recurrent projections, via prefrontal cortex, that reach the specific basal forebrain subgroups from which they receive afferents. This architecture enables the basal forebrain to selectively modulate cortical responsiveness according to current processing demands. Theoretically, optimal functioning of this distributed network would be enhanced by temporal coordination among coactive basal forebrain neurons, or the emergence of "cell assemblies." The present work demonstrates assembly formation in rat basal forebrain neuronal populations during a selective attention task. Neuron pairs exhibited coactivation patterns organized within beta-frequency time windows (55 ms), regardless of their membership within distinct bursting versus nonbursting basal forebrain subpopulations. Thus, the results reveal a specific temporal framework for integration of information within basal forebrain networks and for the modulation of cortical responsiveness.

Keywords: assembly; beta; corticopetal; generalized linear model.


Figures

Figure 1.
Figure 1.
Multiple single-neuron recordings of basal forebrain neurons during performance of a selective-attention task. A, Schematic of the arena used for the selective attention task. A 1.2-m-diameter environment with 46 cm walls, having 36 evenly spaced light sources each 6.5 cm above the surface (red spheres). A trial began when the animal stood upon a 25 cm platform at the arena center with head orientation such that the location of any individual trial's light flash lies somewhere within the 120° space that is centered on the longitudinal axis of the animal's head. A light flash (∼150 ms) from a single location triggers a journey to identify the spatial location of the flash with a nose-poke. Return to the center plate yields 1/2-piece Cheerio reward if the correct light source was identified. The size of the red spheres depicts the approximate trial-to-trial probability for light flash locations (black spheres depict zero probability). B, Mean firing rate vectors from six example neurons. Firing rates were normalized by their maximum firing rate and range from 0 to 1 (y-axes). Colored arrows across the x-axes mark the behavioral events (light flash, nose poke, plate cross, and reward) after a time normalization procedure is used to align events across trials (see Materials and Methods for a full description of the time normalization procedure). For a full description of BF neuron activity during this task, see Tingley et al., 2014.
Figure 2.
Figure 2.
Multiple single neuron recordings in basal forebrain subregions substantia innominata and ventral pallidum. Top, Summary of recording sites (N = 8 rats, 12 stereotrode bundle placements) in subregions ventral pallidum and substantia innominata of the basal forebrain. Differently colored, filled circles represent different animals. Circles with a black ring represent location of recording sites for analogous positions in the left hemisphere. Bottom, Example histology depicting electrode placement for two rats. Colored arrows correspond to red and yellow circles above and point to marker lesions made at final electrode depths. ml, Midline; ac, anterior commissure; ca, caudate; lv, lateral ventricle; pi, piriform cortex.
Figure 3.
Figure 3.
Task-phase-specific biases in firing of basal forebrain bursting and nonbursting neuron subtypes. A, Color map of ISIHs (maximum-normalized; blue, red = 0–1) for all BF neurons. Neurons (y-axis) are sorted according to the time bin (x-axis) associated with the maximum number of spike intervals. B, Frequency distribution for the peak locations (blue bars, left y-axis) for ISIHs of all neurons. Vertical gray line marks the mean of the distribution, effectively splitting the bimodal distribution into bursting and nonbursting neuron types. The red line (right y-axis) is the average of all maximum-normalized ISIHs of A indicating overall balance in burst versus nonburst firing for the population as a whole. C, Principal components analysis derived from the vectors shown in A yields two components (1, 2) that explain much (62%) of the variance in the observed ISIHs. Inset, eigenvectors for these components. D, Cell density map (blue, red = 0–22 neurons) showing that the ISIHs of most BF neurons cluster into one of two categories based on their principal component 1 (nonbursting) and 2 (bursting) scores. A Gaussian mixture model (K = 2) applied to the density map defined two clusters. Ellipses designate their means plus 1 (solid) or 2 (dashed) SD. E, Left, Average normalized ISIH (x-axis) for the subpopulation of neurons showing activity rates >80% of their maximum rate is shown for each task phase (y-axis). Time/task phase proceeds down the y-axis (trial start = top; trial end = bottom), and arrows represent the moments of: light flash (green), nose-poke (blue), plate-cross (purple), and reward obtainment (red). Right, Average ISIH for the same populations of highly active neurons at each task phase but following subtraction of the average overall ISIH for a randomly selected population of neurons (blue, red = −0.1–0.1). This panel reveals deviations from expectation in the proportion of bursting versus nonbursting neurons highly active at any given task phase. Nonbursting neurons, for example, come to dominate the population of active cells as the animal begins the journey back to the center plate (black bracket). Dashed vertical line (x-axis = 65 ms) reflects the mean peak ISIH interval across all cells, also shown as the gray line in B.
Figure 4.
Figure 4.
Basal forebrain cell assemblies operate at beta frequencies. A, Gray trace at top depicts the spiking activity for a single neuron (the actual) on a single trial. Red traces below depict the spiking activity for a simultaneously recorded neuron, using successively wider temporal smoothing filters. Time on the x-axis is absolute (non-normalized) and taken relative to the time (dashed vertical line) at which the animal accelerates toward the nose-poke following light flash (as determined from position tracking data). B, By use of a generalized linear model, the smoothed vectors (red traces) are used to generate models of the actual neuron's spike train (purple traces, filter sizes given above each). C, Example results from this “cell assembly analysis” of the BF neuron pair shown in A, Black trace is the sum-squared error (y-axis) of each model with different temporal smoothing windows (x-axis). Red trace is the sum-squared error for each model, when trial numbers are randomly shuffled. Fine dashed black and red traces give the mean sum-squared error for each set of models (i.e., randomized and nonrandomized data). D, Scatter plot of the amount of prediction improvement (y-axis) for each neuron pair at that neuron pair's optimal prediction time window (x-axis). The y-axis values reflect, for each pair, the ratio of the black and red arrow lengths in C. Red dot corresponds to the neuron pair used in AC. Points above a y-axis value of 1 correspond to greater prediction for actual versus trial-randomized spike trains. Vertical full and dashed black lines correspond to the mean (55 ms) ±1 SD, respectively, of the distribution of x-axis values. The prominent collection of points with high prediction values at 55 ms and congregation of optimal prediction windows at 55 ms are both consistent with organization of BF cell assemblies at beta frequencies. Black trace depicts the mean y-axis value for neuron pairs having optimal prediction at each of the time windows. Inset depicts the mean prediction improvement (beyond chance) for each prediction time window and organized into four types of neuron pairs based on their bursting/nonbursting status [green = 1762 nonbursting (actual)/nonbursting (predictor) pairs, red = 1792 bursting/bursting pairs, blue = 1502 bursting/nonbursting pairs, black = 1502 nonbursting/bursting pairs]. Both bursting and nonbursting neurons are temporally organized over the same range of beta frequencies.

Similar articles

Cited by

References

    1. Alam MN, Szymusiak R, Gong H, King J, McGinty D. Adenosinergic modulation of rat basal forebrain neurons during sleep and waking: neuronal recording with microdialysis. J Physiol. 1999;521:679–690. doi: 10.1111/j.1469-7793.1999.00679.x. - DOI - PMC - PubMed
    1. Bakin JS, Weinberger NM. Induction of a physiological memory in the cerebral cortex by stimulation of the nucleus basalis. Proc Natl Acad Sci U S A. 1996;93:11219–11224. doi: 10.1073/pnas.93.20.11219. - DOI - PMC - PubMed
    1. Baxter MG, Bucci DJ, Gorman LK, Wiley RG, Gallagher M. Selective immunotoxic lesions of basal forebrain cholinergic cells: effects on learning and memory in rats. Behav Neurosci. 1995;109:714–722. doi: 10.1037/0735-7044.109.4.714. - DOI - PubMed
    1. Bhattacharyya A, Veit J, Kretz R, Bondar I, Rainer G. Basal forebrain activation controls contrast sensitivity in primary visual cortex. BMC Neurosci. 2013;14:55. doi: 10.1186/1471-2202-14-55. - DOI - PMC - PubMed
    1. Bi GQ, Poo MM. Synaptic modifications in cultured hippocampal neurons: dependence on spike timing, synaptic strength, and postsynaptic cell type. J Neurosci. 1998;18:10464–10472. - PMC - PubMed

Publication types

LinkOut - more resources