. 2015 Feb 18;35(7):3056-72.
doi: 10.1523/JNEUROSCI.3047-14.2015.

7 tesla FMRI reveals systematic functional organization for binocular disparity in dorsal visual cortex

Affiliations

7 tesla FMRI reveals systematic functional organization for binocular disparity in dorsal visual cortex

Nuno R Goncalves et al. J Neurosci. .

Abstract

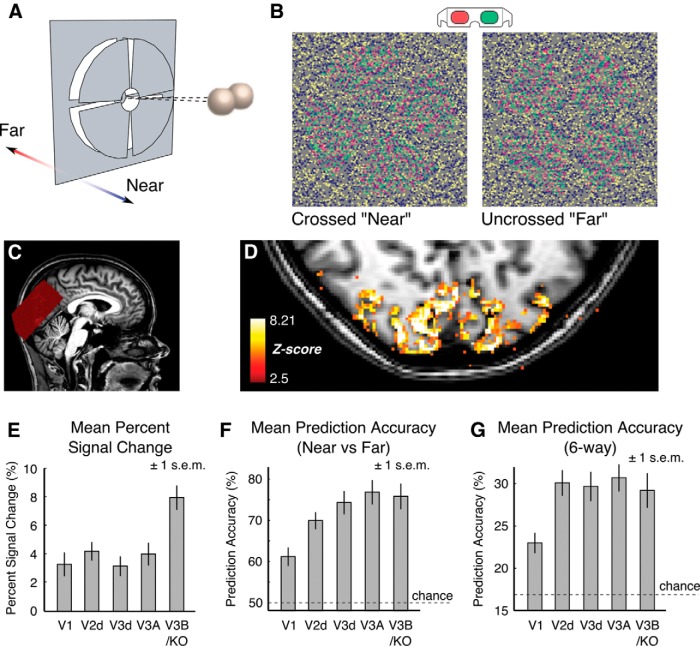
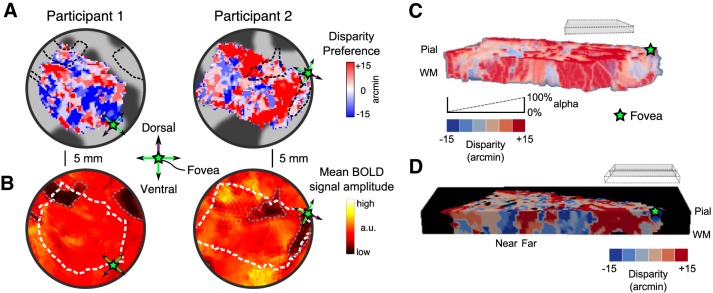
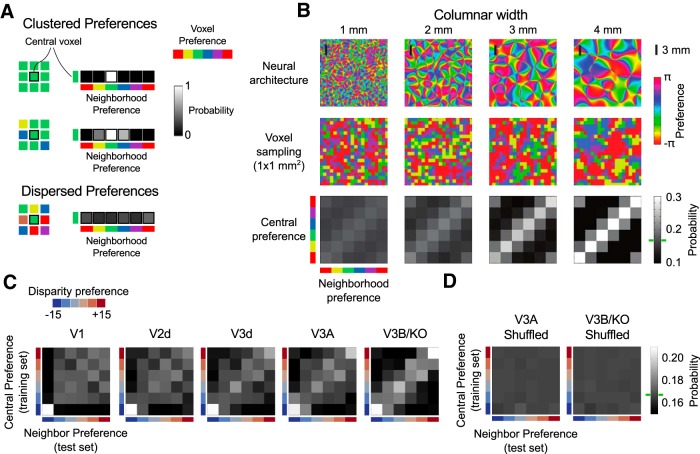
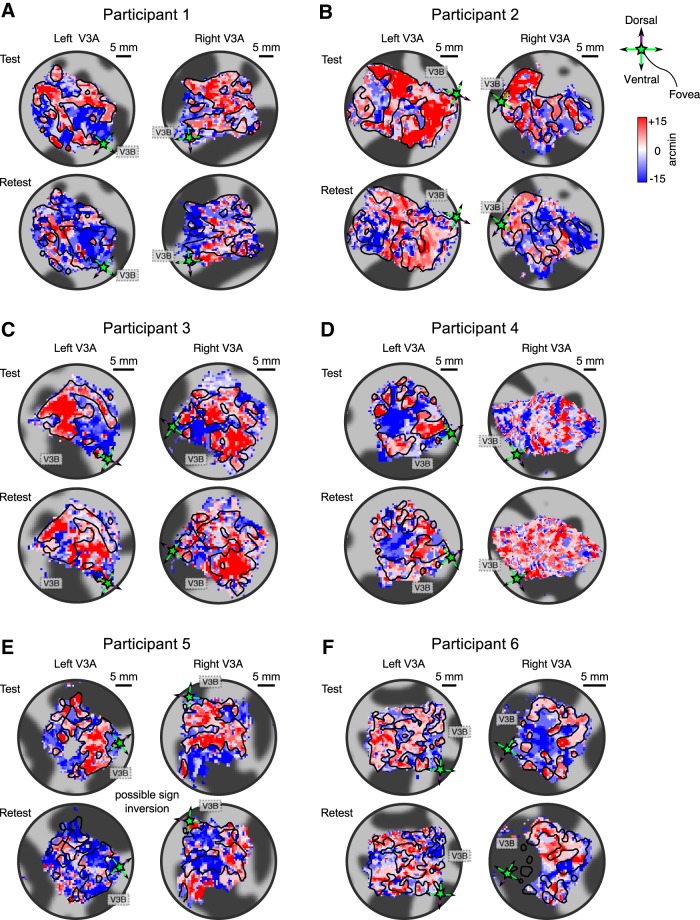
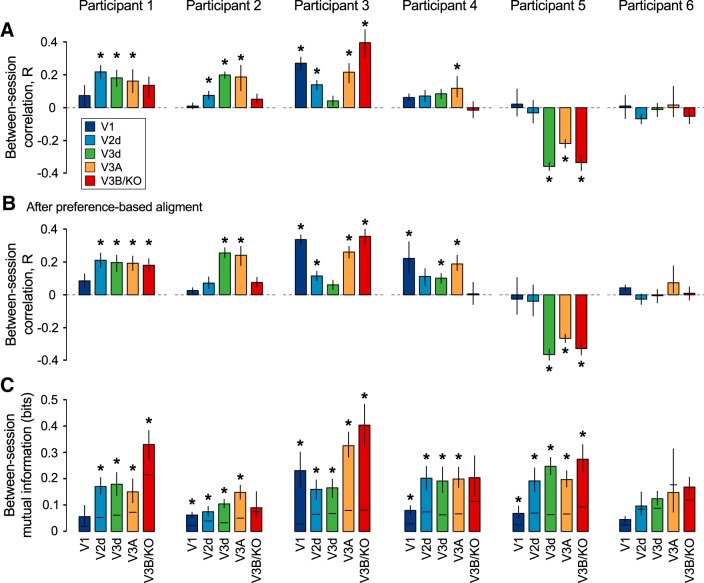
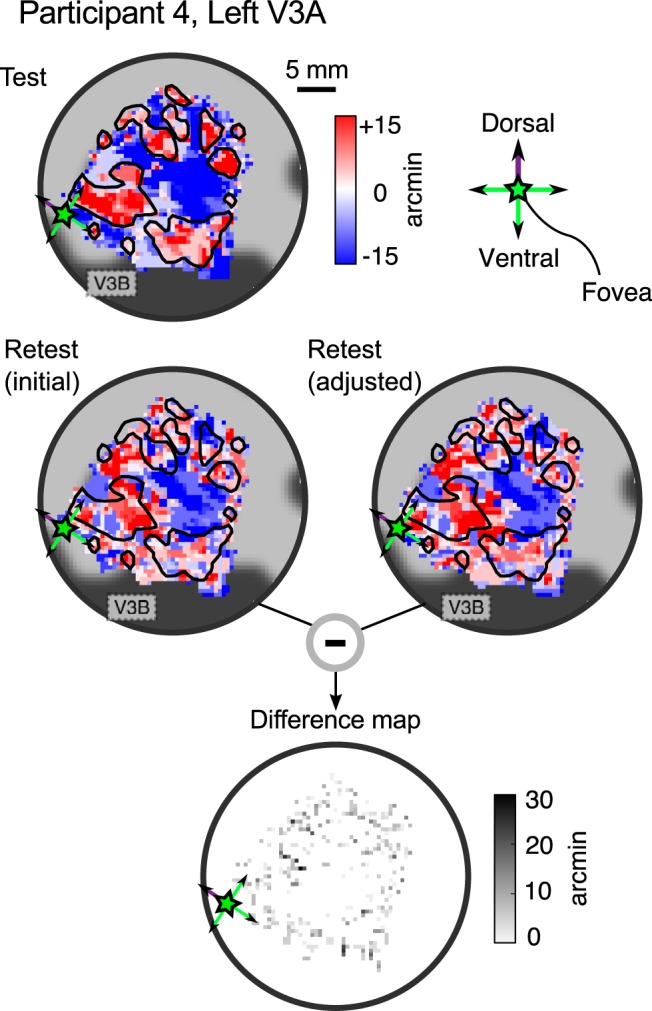
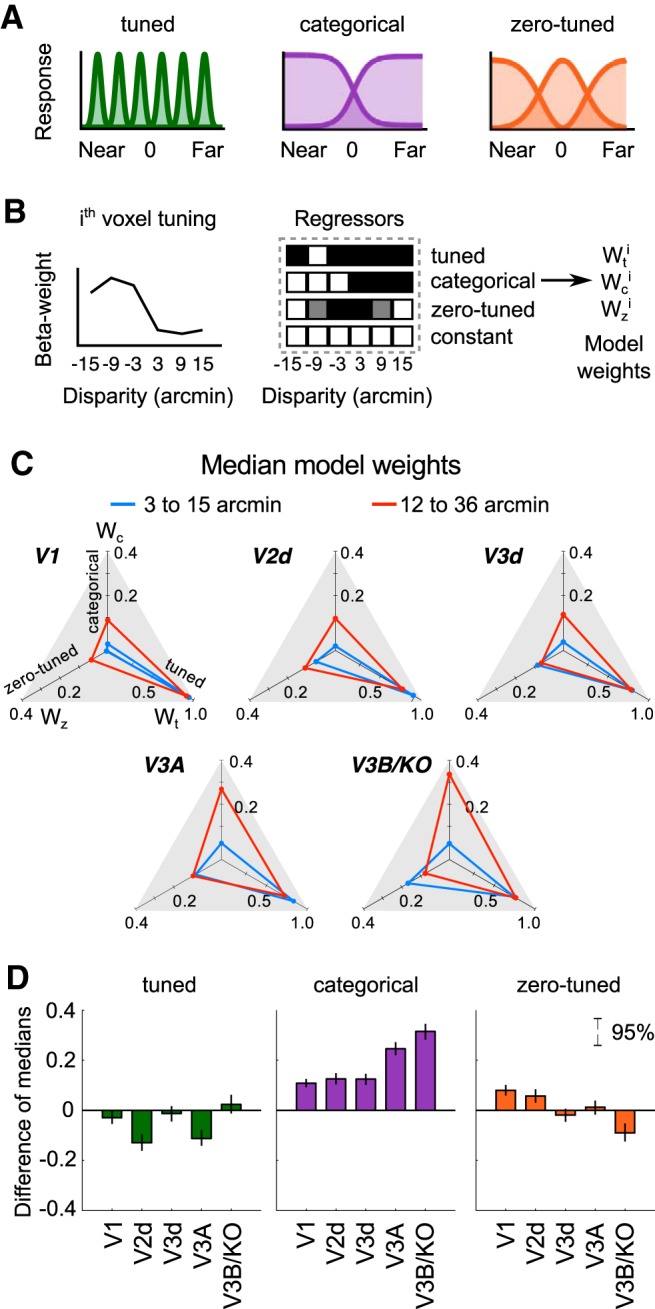
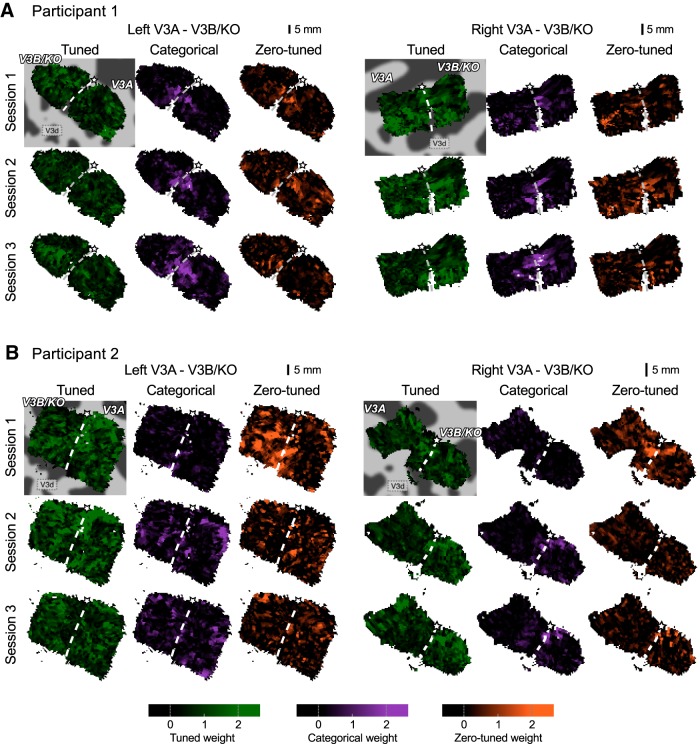
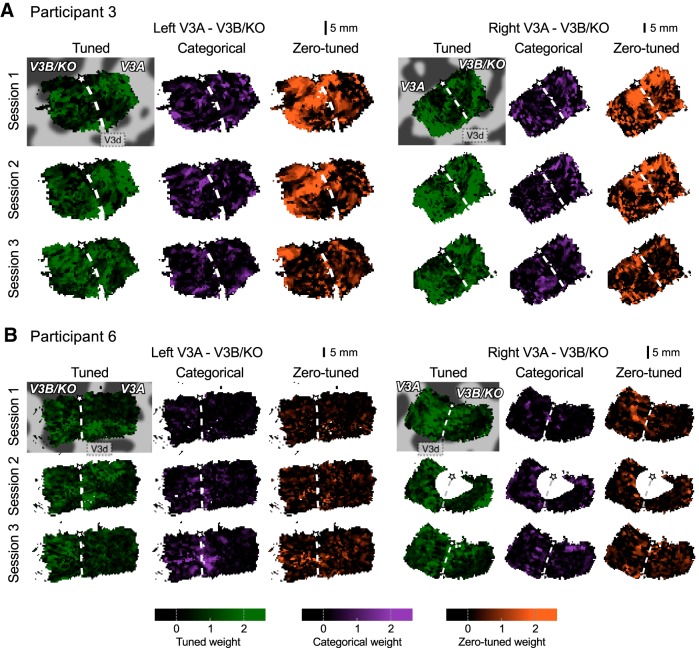
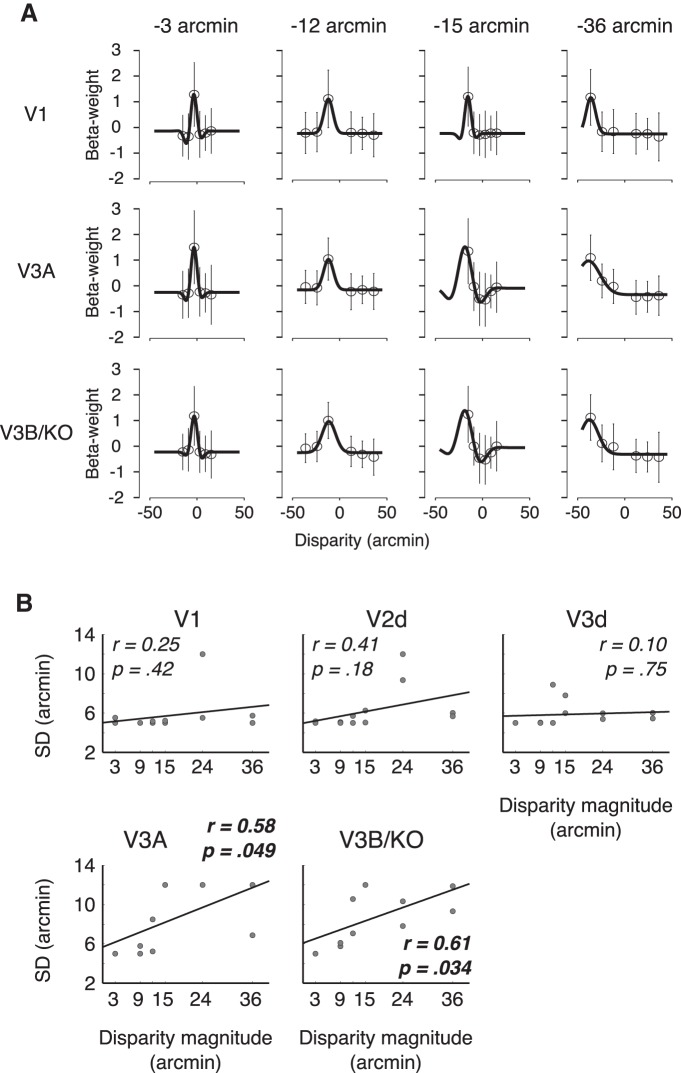
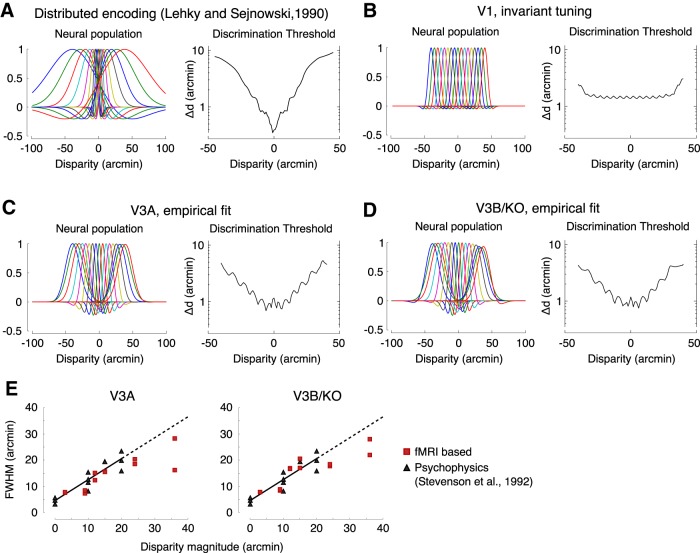
The binocular disparity between the views of the world registered by the left and right eyes provides a powerful signal about the depth structure of the environment. Despite increasing knowledge of the cortical areas that process disparity from animal models, comparatively little is known about the local architecture of stereoscopic processing in the human brain. Here, we take advantage of the high spatial specificity and image contrast offered by 7 tesla fMRI to test for systematic organization of disparity representations in the human brain. Participants viewed random dot stereogram stimuli depicting different depth positions while we recorded fMRI responses from dorsomedial visual cortex. We repeated measurements across three separate imaging sessions. Using a series of computational modeling approaches, we report three main advances in understanding disparity organization in the human brain. First, we show that disparity preferences are clustered and that this organization persists across imaging sessions, particularly in area V3A. Second, we observe differences between the local distribution of voxel responses in early and dorsomedial visual areas, suggesting different cortical organization. Third, using modeling of voxel responses, we show that higher dorsal areas (V3A, V3B/KO) have properties that are characteristic of human depth judgments: a simple model that uses tuning parameters estimated from fMRI data captures known variations in human psychophysical performance. Together, these findings indicate that human dorsal visual cortex contains selective cortical structures for disparity that may support the neural computations that underlie depth perception.

Keywords: V3A; binocular disparity; fMRI; psychophysics; ultra-high-field imaging; visual cortex.


Figures

Figure 1.
Figure 1.
Schematic illustration of the stimuli and basic functional activations. A, Diagram of the depth arrangement in the stimuli. Four disparity-defined wedges were simultaneously presented at 1 of 6 disparity-defined depths during each imaging session (±3, 9, and 15 arcmin in sessions 1 and 2; ±12, 24, and 36 arcmin in Session 3). B, The depth of the wedges was defined by manipulating disparity in random dot stereograms, which were viewed through red-green anaglyphs attached to prism glasses. C, BOLD signals were acquired from dorsomedial visual cortex. Slice placement is illustrated here on a near midsagittal slice in Participant 1. D, Signal changes in response to stimulus delivery (stimulus vs rest) for Participant 1, showing that activity is localized to the gray matter. E, Mean percent-signal change for stimulation versus blank periods across all subjects and sessions (N = 16). Error bars represent the SEM. F, Mean prediction accuracy for the discrimination of crossed “near” versus uncrossed “far” disparities across early and dorsal visual areas (two-way classification). Chance level (50%) is indicated by the dashed gray line. Error bars depict the SEM across subjects and sessions (N = 16). G, Mean prediction accuracy for the discrimination of individual disparity conditions presented within each session (six-way classification). Chance performance (16.7%) is indicated by the dashed gray line. Error bars depict the SEM across subjects and sessions (N = 16).
Figure 2.
Figure 2.
Spatial distribution of peak disparity responses in area V3A for two participants. A, Peak disparity responses in left V3A of Participants 1 and 2 (first session). The peak disparity response of each voxel is mapped onto flattened representations of the cortex. Dark and light gray areas represent sulci and gyri, respectively. Peak disparity responses were sampled from three intermediate layers of the cortical sheet (at relative depths of 0.4, 0.5, and 0.6) and averaged across depths. B, Mean BOLD signal amplitude in the same ROIs. Dark areas indicate areas of low absolute signal in the EPI images, and are likely to represent large veins. The white dashed line represents the outline of left V3A shown above. Gray dashed lines delineate areas with low signal amplitude in both maps. Coarse clusters of peak disparity responses do not overlap with the potential location of large veins. C, The same ROI in Participant 2, but now represented across 11 relative points through the entire range of the cortical sheet (0 to 1 relative depth, sampled at increments of 0.1). The flattened representations for each cortical depth were stacked together and an opacity gradient was applied to aid visualization of peak disparity response across the cortical depth. Note that to assist visualization the cortical depth, dimension is not drawn to scale. D, Sliced view of peak disparity responses in the same ROI (Participant 2, left V3A). Data are cut through the cortical depth along a line extending from the foveal representation of V3A up to the periphery near the border with V3d.
Figure 3.
Figure 3.
Local clustering of peak voxel responses to disparity (“preferences”) in simulated and empirical datasets. A, Simplified 2D illustration of clustered and disperse preferences for a given voxel. Individual voxels and their neighbors will often share similar peak responses if there is spatial clustering (top and middle). If there is no organization, no relationship should be observed between the peak responses of a target voxel and its neighbors (bottom). B, Simulation of columnar architectures for orientation (after Rojer and Schwartz, 1990) with periodicity varying from 1 to 4 mm (top) and the respective preference maps after simulating voxel sampling using six equidistant conditions (middle). Bottom, The correspondence between the preference of target voxels and their neighborhood is shown in form of a probability matrix for each columnar width. In each matrix, the ith row represents the average probability distribution of preferences around voxels preferring the ith disparity and the probability value is represented in grayscale (green horizontal line on the color bar indicates chance level, 0.167, given six response options). Maps that are clustered display a clear diagonal structure, demonstrating that nearby voxels tend to share similar preferences. C, The same matrix representation for empirical disparity maps from visual areas V1, V2d, V3d, V3A, and V3B/KO. Green horizontal bar on the color bar indicates chance level (0.167). A diagonal structure emerges along the dorsal cortical hierarchy. Note the different grayscale range from part B for empirical fMRI measurements. D, Results of a similar analysis after randomly shuffling the disparity preferences in V3A and V3B/KO. In this case, we do not observe any diagonal structure.
Figure 4.
Figure 4.
Maps of peak disparity responses from area V3A obtained in different imaging sessions. Flattened representations were obtained by averaging disparity preferences across three intermediate layers in the cortex (0.4, 0.5, and 0.6) so as to avoid distortions caused by macrovasculature near the pial surface. Green pentagrams represent the location of the foveal representation used to identify the border between area V3A and V3B/KO (using retinotopic mapping). The dorsal direction is indicated by the purple arrow aligned with the vertex of the pentagram. Additional labels indicate the position of area V3B/KO to aid orientation. AD, Consistent distribution of disparity responses can be observed in four participants (Participant 1, left V3A; Participant 2, left and right V3A; Participant 3 right V3A; Participant 4 left V3A). Overlaid contours represent the edges of the uncrossed disparity/”far” (red) region from Session 1. These were calculated by binarizing the maps and then applying an edge detection algorithm. The outlines were omitted in D (right V3A) because the fine scale changes in this map mean that superimposed contours masked the data and therefore hindered visualization. E, The distribution of peak disparity responses in Participant 5 reveals similar structures between sessions, but the color map appears to be inverted. F, No correspondence between disparity maps is evident for Participant 6. Slice positioning in the second session was not optimal, with the result that not all of right hemisphere V3A was fully sampled (bottom right).
Figure 5.
Figure 5.
Quantifying correspondence between disparity maps acquired in different imaging sessions. A, Correlation between peak disparity responses. Data show the median Pearson correlation coefficients between voxels' peak responses in Session 1 versus Session 2 obtained by bootstrapping (10,000 resamples). Error bars represent 68% confidence intervals and stars indicate bootstrapped significance at the p < 0.05 level. B, As in A except that the alignment between the data in the two sessions was improved using an additional alignment procedure. C, Information shared between maps acquired in different sessions. Bars represent the mutual information between maps, with error bars covering the 68% confidence interval. Horizontal lines represent the 97.5 percentile for a bootstrapped control distribution (10,000 estimates) calculated after randomly shuffling labels of peak disparity response.
Figure 6.
Figure 6.
Spatial adjustment introduced by the additional alignment step illustrated for Participant 3, left V3A, which showed the maximal benefit of this procedure. Top, Map of peak disparity responses obtained in the first imaging session (reproduced from Fig. 4D). Middle, Maps obtained in the second imaging session before (left, reproduced from Fig. 4D) and after (right) adjustment using the additional alignment step. Bottom, Difference map illustrating that only minor differences are introduced by the additional alignment step.
Figure 7.
Figure 7.
Modeling voxel responses using simplified models of disparity selectivity. A, Representation of the descriptive models of disparity selectivity proposed by Poggio et al. (1988). B, Schematic representation of our model-based approach. For each individual voxel, we assembled regressors based on the hypothetical responses for each model type given the peak disparity response of the voxel. After linear regression, we obtain three weights that approximate the contribution of each model for the response profile of individual voxels. C, Model weights at different disparity magnitudes. The median weights (across voxels) for each model are mapped onto a radar plot with three axis (one for each model). Blue lines represent data from the first two imaging sessions (pooled), during which disparity ranged from 3 to 15 arcmin. Red lines represent the distribution of weights observed at disparities ranging from 12 to 36 arcmin (third session). D, Difference in medians between the distributions illustrated in C for all ROIs. Bars represents the median difference (in medians) obtained by bootstrapping (10,000 resamples). Error bars represent 95% confidence intervals.
Figure 8.
Figure 8.
Cortical representation of model weights in areas V3A and V3B/KO in the left and right hemispheres of Participant 1 (A) and Participant 2 (B). The pentagram on each map represents the position of the fovea and the white dashed line the division between V3A and V3B/KO established using retintopic mapping. A, Categorical responses (purple) were persistently identified around the foveal representation dividing V3A and V3B/KO (both hemispheres) even when different disparity levels were presented (Session 3). B, An apparent correspondence between tuned responses was found across Sessions 1 and 2, but not Session 3 (left hemisphere).
Figure 9.
Figure 9.
Cortical representation of model weights in areas V3A and V3B/KO in the left and right hemispheres of Participant 3 (A) and Participant 6 (B). This figure follows the format presented in Figure 8. A, Evident correspondence between “tuned” and “zero-tuned” weights was identified across the first two imaging sessions. Correspondence was not observed for the third session, where disparity magnitude was increased. B, Apparent correspondence was absent for Participant 6. Note that the voxel slice placement for Session 2 meant that we omitted coverage of a considerable portion of V3A and V3B/KO in the right hemisphere.
Figure 10.
Figure 10.
Voxel response profiles at different disparity magnitudes. We modeled voxel responses using Gabor filters and examined the relationship between the Gabor parameters and preferred disparity magnitude. A, Pooled voxel responses in areas V1, V3A, and V3B/KO modeled by Gabor filters for four preferred disparities (−3, −12, −15, and −36 arcmin). Gabor models were fit to sets of voxels sharing the same preferred disparity, resulting in 12 groups per ROI. Error bars represent the SD across voxels. B, Relationship between response profile width (SD of the Gaussian envelope) and peak disparity response for early and dorsal visual areas. Each datum represents a group of individual voxels that share the same disparity preference (1 of the 12 preferred disparities examined in our experiments: ±3, 9, 12, 15, 24, and 36 arcmin). A significant positive trend between tuning width and disparity magnitude was found in V3A and V3B/KO, but not in earlier visual areas.
Figure 11.
Figure 11.
Population encoding mechanisms and stereo-acuity at different disparities. A, Distributed encoding model proposed by Lehky and Sejnowski (1990). A population of 17 nonuniform, largely overlapping units (left) produces a disparity discrimination curve (right) similar to stereo-acuity judgments made by human observers (Badcock and Schor, 1985). B, Interval encoding model derived from voxel response profiles in V1. A population of 17 units with uniform, narrow tuning produces a disparity discrimination curve uncharacteristic of the human visual system. C, D, A neural encoding model derived from the voxel response profiles in areas V3A and V3B/KO (left), and the simulated discriminative performance of these models (right). The performance of these models is more similar to the idealized patterns of psychophysical performance (part A) than a model derived from V1 activity (part B). E, Plot of disparity magnitude against detector tuning width based on psychophysical data published by Stevenson et al. (1992) and our fMRI estimates in V3A and V3B/KO. The trend line reproduces that fit by Stevenson et al. (1992), with blue data points representing their published data (their Fig. 7) as obtained by a “data thief” procedure implemented in MATLAB. Red data points represent fits from on our fMRI measurements. The dashed portion of the fit extends the line of best fit beyond the range of disparities tested by Stevenson et al. (1992).

Similar articles

Cited by

References

    1. Adams DL, Zeki S. Functional organization of macaque V3 for stereoscopic depth. J Neurophysiol. 2001;86:2195–2203. - PubMed
    1. Anzai A, Chowdhury SA, DeAngelis GC. Coding of stereoscopic depth information in visual areas V3 and V3A. J Neurosci. 2011;31:10270–10282. doi: 10.1523/JNEUROSCI.5956-10.2011. - DOI - PMC - PubMed
    1. Backus BT, Fleet DJ, Parker AJ, Heeger DJ. Human cortical activity correlates with stereoscopic depth perception. J Neurophysiol. 2001;86:2054–2068. - PubMed
    1. Badcock DR, Schor CM. Depth-increment detection function for individual spatial channels. J Opt Soc Am A. 1985;2:1211–1216. doi: 10.1364/JOSAA.2.001211. - DOI - PubMed
    1. Ban H, Preston TJ, Meeson A, Welchman AE. The integration of motion and disparity cues to depth in dorsal visual cortex. Nat Neurosci. 2012;15:636–643. doi: 10.1038/nn.3046. - DOI - PMC - PubMed

Publication types