. 2015 Feb 18;35(7):3112-23.
doi: 10.1523/JNEUROSCI.0836-14.2015.

Cell-specific activity-dependent fractionation of layer 2/3→5B excitatory signaling in mouse auditory cortex

Affiliations

Cell-specific activity-dependent fractionation of layer 2/3→5B excitatory signaling in mouse auditory cortex

Ankur Joshi et al. J Neurosci. .

Abstract

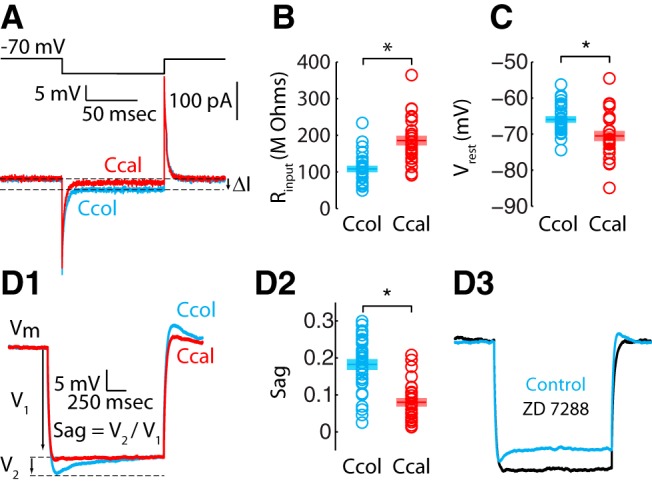
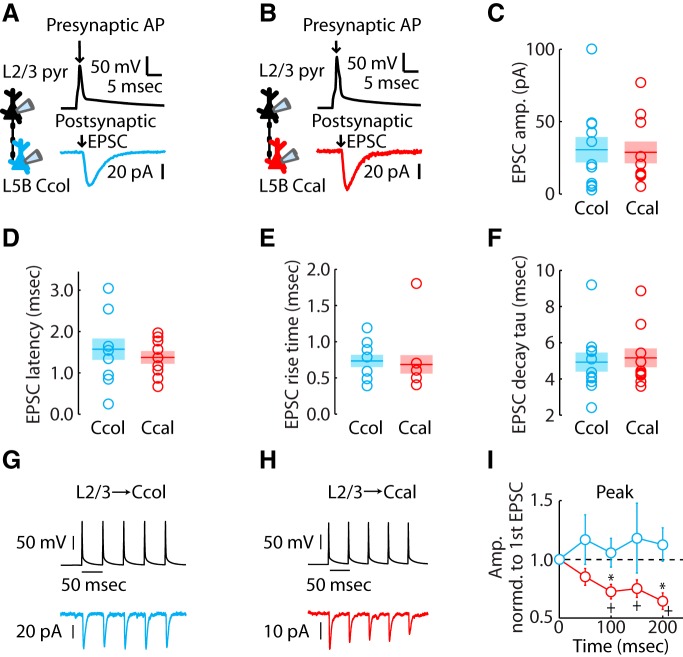
Auditory cortex (AC) layer 5B (L5B) contains both corticocollicular neurons, a type of pyramidal-tract neuron projecting to the inferior colliculus, and corticocallosal neurons, a type of intratelencephalic neuron projecting to contralateral AC. Although it is known that these neuronal types have distinct roles in auditory processing and different response properties to sound, the synaptic and intrinsic mechanisms shaping their input-output functions remain less understood. Here, we recorded in brain slices of mouse AC from retrogradely labeled corticocollicular and neighboring corticocallosal neurons in L5B. Corticocollicular neurons had, on average, lower input resistance, greater hyperpolarization-activated current (Ih), depolarized resting membrane potential, faster action potentials, initial spike doublets, and less spike-frequency adaptation. In paired recordings between single L2/3 and labeled L5B neurons, the probabilities of connection, amplitude, latency, rise time, and decay time constant of the unitary EPSC were not different for L2/3→corticocollicular and L2/3→corticocallosal connections. However, short trains of unitary EPSCs showed no synaptic depression in L2/3→corticocollicular connections, but substantial depression in L2/3→corticocallosal connections. Synaptic potentials in L2/3→corticocollicular connections decayed faster and showed less temporal summation, consistent with increased Ih in corticocollicular neurons, whereas synaptic potentials in L2/3→corticocallosal connections showed more temporal summation. Extracellular L2/3 stimulation at two different rates resulted in spiking in L5B neurons; for corticocallosal neurons the spike rate was frequency dependent, but for corticocollicular neurons it was not. Together, these findings identify cell-specific intrinsic and synaptic mechanisms that divide intracortical synaptic excitation from L2/3 to L5B into two functionally distinct pathways with different input-output functions.

Keywords: auditory cortex; cortical mechanisms; intrinsic mechanisms; short-term plasticity; synaptic mechanisms.


Figures

Figure 1.
Figure 1.
Localization and identification of AC corticocollicular (Ccol) and L5B corticocallosal (Ccal) neurons. A, Labeling of corticocollicular and corticocallosal neurons with fluorescent tracers. Projection neurons in the AC were retrogradely labeled by injecting different colored fluorescent latex microspheres in the contralateral AC and the ipsilateral inferior colliculus. B, Low magnification images (4×) show the full extent of AC and labeled Ccal (top) and Ccol neurons (bottom). C, Merged image showing intermingling but no double labeling of corticocollicular (green) and corticocallosal (red) neurons in L5B of AC. D–H, In vivo localization of AC areas by FA imaging of sound-evoked activity was performed in 11 experiments. D1–D3, Bright-field (D1), green (D2), and red (D3) fluorescent images of a representative coronal slice that was labeled in vivo with sulforhodamine. The bright-field image (D1) indicates the rhinal fissure and the location of primary auditory cortex estimated from the stereotaxic coordinate mouse brain atlas (Franklin and Paxinos, 2001). The green fluorescent image (D2) shows retrogradely labeled corticocollicular neurons in L5B that are present in A1 and extend toward the rhinal fissure. The red fluorescent image (D3) shows the in vivo applied sulforhodamine spot. Sulforhodamine was applied to the pial surface in vivo and here identifies A1 in this coronal brain slice (FA-assisted A1 identification was performed as shown in E and F). D3 also shows retrogradely labeled corticocallosal neurons that extend medially and laterally from A1. The upper and lower layer 5B boundaries are indicated by dashed lines (WM stands for white matter). E, Image of cortical surface indicating caudal (C), rostral (R), dorsal (D), and ventral (V) direction. F, In response to amplitude-modulated tones (carrier frequency of 5 kHz and modulation frequency of 20 Hz, 40–50 dB), FA image shows peaks of activity corresponding to A1 and non-A1 auditory cortical areas. The more caudal (left) of the two domains of activation is A1 and the more rostral (right) of the two domains is the AAF. Image is an average of 10 trials and is from a frame taken 1 s after stimulus onset. Images were smoothed using a spatial filter with a 100 μm space constant. G, The average (10 trials) relative fluorescence from regions of interest at the peak of A1 (blue) and AAF (magenta) area. The horizontal bar indicates the duration of the auditory stimulus. H, The distance between the centers of 5 kHz activation of A1 and AAF (974 ± 27 μm, n = 11).
Figure 2.
Figure 2.
Dendritic morphology of corticocollicular and corticocallosal neurons in L5B of AC. A, Example reconstructions. B, Horizontal profile of the total dendritic length in the perisomatic/L5B region, showing the mean ± SEM for corticocollicular (blue; n = 6) and corticocallosal (red; n = 6) neurons. Each neuron's horizontal profile was calculated as the average in a 150 μm wide band extending horizontally across the perisomatic region, as indicated in A. No significant differences were found at any of the locations (rank sum test). Inset, Total dendritic length, plotted as the mean ± SEM for the two cell types (lines) along with the individual values (circles). The samples were not significantly different (rank sum test). C, Horizontal profile of the dendritic length in the apical tuft, showing the mean ± SEM for corticocollicular (blue; n = 6) and corticocallosal (red; n = 6) neurons. Each neuron's horizontal profile was calculated as the average in a 150 μm wide band extending horizontally across the apical tuft region, as indicated in A. Locations where values differed significantly are marked with an asterisk (p < 0.05, rank sum test). D, Vertical profiles, calculated as the dendritic length in 50 μm bins and plotted as the mean ± SEM for the two cell types; no differences were found (rank sum test). Inset, Each profile was first normalized to the soma (distance = 1), rebinned, and plotted as the mean ± SEM; no differences were found (rank sum test).
Figure 3.
Figure 3.
Intrinsic subthreshold properties of AC corticocollicular (Ccol) and L5B corticocallosal (Ccal) neurons are distinct. A, Hyperpolarizing pulses (top) in voltage-clamp recording mode result in transient current responses (bottom). The difference between baseline and steady-state hyperpolarized current (ΔI) is used to calculate the input resistance of Ccol and Ccal neurons. B, The average input resistance is significantly lower for Ccol neurons (108.11 ± 7.06 MΩ, n = 32 vs 185 ± 11.27 MΩ, n = 29; p < 0.0001). C, The average resting membrane voltage, Vm, is significantly more depolarized for Ccol neurons (−65.98 ± 0.70 mV, n = 32 vs −70.54 ± 1.22 mV, n = 29; p = 0.0014). D1, Hyperpolarizing current injection reveals sag potentials in Ccol and Ccal neurons. Sag is measured by dividing the difference between the minimum voltage hyperpolarization and the steady-state hyperpolarized voltage. D2, The average sag is significantly higher for Ccol neurons (0.18 ± 0.01, n = 32, vs 0.08 ± 0.01, n = 20; p < 0.0001). D3, Sag potentials are abolished by ZD7288 (black trace) indicating that they are mediated by hyperpolarization-activated cyclic nucleotide-gated channels (average sag in control = 0.10 ± 0.01; post-ZD7288 = 0.01 ± 0.01, n = 3, p < 0.01).
Figure 4.
Figure 4.
AP properties and spike-frequency adaptation of AC corticocollicular (Ccol) and L5B corticocallosal (Ccal) neurons are distinct. A, AP waveforms of representative Ccol and Ccal neurons. Arrows indicate AP width. B, On average, Ccol neurons have narrower APs (1.00 ± 0.04 ms, n = 32, vs 1.26 ± 0.07 ms, n = 29; p = 0.0016). C, On average, Ccol neurons have a more hyperpolarized AP threshold (−40.70 ± 0.59 mV, n = 32, vs −36.95 ± 0.65 mV, n = 29; p < 0.0001). D, Representative firing of Ccol and Ccal neurons in response to increasing depolarizing current (0–400 pA, 50 pA increments). E, Firing frequency as a function of injected current amplitude for Ccal and Ccol neurons (f–I relationship). The slope of the f–I curve between 150 and 250 pA is used to calculate the slope (gain) of the f–I curve. F, The f–I slope is significantly steeper for Ccol neurons (0.11 ± 0.01 Hz/pA, n = 32 vs 0.08 ± 0.004 Hz/pA, n = 29, p = 0.0007). G, The smallest current step that elicited firing is significantly higher for Ccol neurons (162.50 ± 8.09 pA, n = 32 vs 131.03 ± 7.12 pA, n = 29, p = 0.005 rank sum test; numbers next to circles indicate the number of neurons that fire under this current injection). H, Temporal patterning of action potential generation was analyzed by calculating instantaneous firing frequencies (i.e., inverse of the interspike interval). I, Ccol neurons often start to fire with a faster initial doublet (inset, marked by the arrow) at the onset of current injection compared with Ccal neurons. Spike frequency decreases (adapts) over time in Ccal neurons while it remains nearly constant in Ccol neurons. J1, J2, Instantaneous firing frequency as a function of time for Ccal and Ccol neurons. Initial instantaneous frequency for Ccol neurons is high, which indicates more fast-doublet firing. Insets illustrate instantaneous firing frequency in Ccol and Ccal neurons after the initial fast doublet. K, The average adaptation ratio, AR = f9/f2 (see H and I for representative traces), is significantly lower for Ccal neurons and close to 1 for Ccol neurons (0.70 ± 0.02, n = 29, vs 0.97 ± 0.03, n = 32, p < 0.0001). L, The average fast-doublet index, FDI = f1/f2 (see H and I inset for representative traces), is significantly higher in Ccol neurons (7.50 ± 1.18, n = 32, vs 1.73 ± 0.09, n = 29, p < 0.0001).
Figure 5.
Figure 5.
Paired recordings reveal similar basal synaptic properties but pathway-specific short-term plasticity of corticocollicular and L5B corticocallosal neurons; L2/3→corticocallosal connections depress, but L2/3→corticocollicular connections do not depress. A, Example unitary L2/3→corticocollicular connection. B, Example unitary L2/3→corticocallosal connection. C, Average unitary EPSC amplitude (L2/3→Ccal = 28.90 ± 8.20 pA; L2/3→Ccol = 30.90 ± 8.80, p > 0.05). D, Average unitary EPSC latency (L2/3→Ccol = 1.60 ± 0.30 ms, n = 11; L2/3→Ccal = 1.40 ± 0.10 ms, n = 10, p > 0.05). E, Average unitary EPSC rise time (L2/3→Ccal = 0.70 ± 0.10 ms; L2/3→Ccol = 0.70 ± 0.10 ms, p > 0.05). F, Average unitary EPSC decay tau (L2/3→Ccal = 5.10 ± 0.50 ms; L2/3→Ccol = 4.90 ± 0.50 ms, p > 0.05). G, An example of AP train in presynaptic L2/3 neuron eliciting a series of EPSCs in a Ccol neuron. H, An example of AP train in presynaptic L2/3 neuron eliciting an EPSC train in an L5B Ccal neuron. I, Average peak amplitudes of the EPSCs in the train, normalized to the peak amplitude of the first EPSC. Asterisks indicate significant differences between L2/3→Ccol (n = 11) and L2/3→Ccal (n = 10) connections (at time = 100 ms, L2/3→Ccal = 0.72 ± 0.06, L2/3→Ccol = 1.06 ± 0.12, p = 0.037; at time = 200 ms, L2/3→Ccal = 0.64 ± 0.07, L2/3→Ccol = 1.12 ± 0.14, p = 0.01). Pluses indicate significant differences compared with the first EPSC within L2/3→corticocallosal or L2/3→corticocollicular connections (compared with the first L2/3→Ccal EPSC, at time = 100 ms, L2/3→Ccal = 0.72 ± 0.06, p = 0.002; at time = 150 ms, L2/3→Ccal = 0.75 ± 0.07, p = 0.01; at time = 200 ms, L2/3→Ccal = 0.64 ± 0.07, p = 0.0009).
Figure 6.
Figure 6.
Synaptic dynamics of L2/3→corticocollicular and L2/3→corticocallosal connections in current-clamp mode. A, Example unitary L2/3→corticocollicular connection. B, Example unitary L2/3→corticocallosal connection. C, Average unitary EPSP amplitude (L2/3→Ccol = 0.80 ± 0.20; L2/3→Ccal = 1.00 ± 0.30 mV, p > 0.05). D, Average unitary EPSP latency (L2/3→Ccol = 2.10 ± 0.30 ms, n = 11; L2/3→Ccal = 1.60 ± 0.10 ms, n = 8, p > 0.05). E, Average unitary EPSP rise time (L2/3→Ccol = 1.5 ± 0.1 ms; L2/3→Ccal = 1.60 ± 0.20 ms, p > 0.05). F, Average unitary EPSP decay tau (L2/3→Ccol = 19.00 ± 2.60 ms; L2/3→Ccal = 36.50 ± 2.00 ms, p = 0.0001). G, Overlay of traces from A and B, normalized to the first EPSP. H, Average peak amplitudes of the EPSPs in the train, normalized to the amplitude of the first EPSP. No significant differences are observed between or within groups. I, Trough amplitudes, normalized to the amplitude of the first EPSP. Asterisk indicates significant differences between L2/3→Ccol and L2/3→Ccol connections (at time = 50 ms, L2/3→Ccal = 0.28 ± 0.06, L2/3→Ccol = −0.03 ± 0.09, p = 0.024; at time = 100 ms, L2/3→Ccal = 0.32 ± 0.06, L2/3→Ccol = 0.00 ± 0.10, p = 0.028; at time = 200 ms, L2/3→Ccal = 0.26 ± 0.06, L2/3→Ccol = −0.04 ± 0.1, p = 0.039). J, Trough-subtracted peak EPSP amplitudes, normalized to the amplitude of the first EPSP. Peak–trough values were obtained by subtracting the peak amplitude of the EPSP from the trough amplitude of the preceding EPSP; this resulted in four peak–trough values at 50, 100, 150, and 200 ms. The first value at time = 0 ms is not a peak–trough value: it is the normalized amplitude of the peak of the first EPSP. Asterisk indicates significant differences between L2/3→Ccol and L2/3→Ccal connections (at time = 100 ms, L2/3→Ccol = 1.13 ± 0.15; L2/3→Ccal = 0.63 ± 0.06, p = 0.016). Pluses indicate significant differences within L2/3→CCol or L2/3→CCal connections. Compared with the first L2/3→Ccal peak–trough, at time = 50 ms, L2/3→Ccal = 0.80 ± 0.08, p = 0.038; at time = 100 ms, L2/3 →Ccal = 0.63 ± 0.06, p = 0.0003; at time = 150 ms, L2/3→Ccal = 0.62 ± 0.09, p = 0.004; at time = 200 ms, L2/3→Ccal = 0.67 ± 0.10, p = 0.012.
Figure 7.
Figure 7.
In response to L2/3 stimulation, the spiking of corticocallosal, but not corticocollicular, neurons is frequency dependent. A, An example of an EPSC train in a Ccol neuron elicited by a train of 20 Hz extracellular stimulation of L2/3. B, An example of an EPSC train in a Ccal neuron elicited by a train of 20 Hz extracellular stimulation of L2/3. Dotted line in A–I indicates normalization to first EPSC/P. C, Average peak amplitudes of the EPSCs from trains as in A and B, normalized to the peak amplitude of the first EPSC. Red asterisks indicate significant differences compared with first EPSC within L2/3→corticocallosal connection (compared with the first EPSC peak, at peak 3, L2/3→Ccal = 0.88 ± 0.03, p = 0.003; at peak 4, L2/3→Ccal = 0.77 ± 0.04, p < 0.0001; at peak 5, L2/3→Ccal = 0.70 ± 0.03, p < 0.0001; n = 14). Cyan asterisks indicate significant differences compared with the first EPSC peak for the L2/3→corticocollicular connection (compared with the first EPSC peak, at peak 2, L2/3→Ccol = 1.25 ± 0.04, p = 0.0002; at peak 3, L2/3→Ccol = 1.23 ± 0.07, p = 0.01; n = 9). D, An example of an EPSC train in a Ccol neuron elicited by a train of 10 Hz extracellular stimulation of L2/3. E, An example of an EPSC train in a Ccal neuron elicited by a train of 10 Hz extracellular stimulation of L2/3. F, Average peak amplitudes of the EPSCs from trains as in D and E, normalized to the peak amplitude of the first EPSC. Asterisks indicate significant differences compared with the first EPSC within L2/3→corticocallosal connection (compared with the first EPSC peak, at peak 2, L2/→Ccal = 0.88 ± 0.03, p = 0.0002; at peak 3, L2/3→Ccal = 0.78 ± 0.03, p < 0.0001; at peak 4, L2/3→Ccal = 0.72 ± 0.03, p < 0.0001; at peak 5, L2/3→Ccal = 0.72 ± 0.03, p < 0.0001; n = 14). There is no significant difference in the EPSC train for L2/3→Ccol connection (n = 9). G, An example of an EPSP train in a Ccol neuron elicited by a train of 10 Hz extracellular stimulation of L2/3. H, An example of an EPSP train in a Ccal neuron elicited by a train of 10 Hz extracellular stimulation of L2/3. I, Average peak amplitudes of the EPSPs from trains as in G and H, normalized to the peak amplitude of the first EPSP. Red asterisks indicate significant differences compared with the first EPSC within L2/3→corticocallosal connection (compared with the first EPSC peak, at peak 3, L2/3→Ccal = 0.86 ± 0.03, p < 0.0001; at peak 4, L2/3→Ccal = 0.81 ± 0.03, p < 0.0001; at peak 5, L2/3→Ccal = 0.78 ± 0.03, p < 0.0001; n = 14). Cyan asterisk indicates a significant difference compared with the first EPSC within L2/3→corticocollicular connection (compared with the first EPSC peak, at peak 2, L2/3→Ccol = 1.12 ± 0.04, p = 0.01; n = 9). J, An example of spikes elicited in a Ccol neuron by three trains of extracellular stimulation of L2/3 (10 pulses in each train, delivered in succession at 20, 10, and 20 Hz, respectively). The breaks (/ /) indicate that at the end of each stimulation train, a 10 s pause was introduced before the starting the next train. K, Average data for the example shown in J; number of spikes fired in each train have been normalized to the number of spikes fired in the first 20 Hz train. Ccol neurons fire a similar number of spikes at 20 and 10 Hz (compared with 20 Hz train 1, at 10 Hz train 2, Ccol neurons fired an average of 1.04 ± 0.16 spikes, p = 0.78; 20 Hz train 1 and 20 Hz train 3 are not significantly different, p = 0.5; n = 5). L, Example traces, as the one in J, but for Ccal neurons. M, Average data for the example shown in L; number of spikes fired in each train have been normalized to the number of spikes fired in the first 20 Hz train. Ccal neurons fire significantly fewer spikes at 10 Hz compared with those at 20 Hz (compared with 20 Hz train 1, at 10 Hz train 2, Ccal neurons fired an average of 0.55 ± 0.07 spikes, p = 0.0002; 20 Hz train 1 and 20 Hz train 3 are not significantly different, p = 0.5289; n = 6).

Similar articles

Cited by

References

    1. Abbott LF, Regehr WG. Synaptic computation. Nature. 2004;431:796–803. doi: 10.1038/nature03010. - DOI - PubMed
    1. Akintunde A, Buxton DF. Origins and collateralization of corticospinal, corticopontine, corticorubral and corticostriatal tracts: a multiple retrograde fluorescent tracing study. Brain Res. 1992;586:208–218. doi: 10.1016/0006-8993(92)91629-S. - DOI - PubMed
    1. Anderson CT, Sheets PL, Kiritani T, Shepherd GM. Sublayer-specific microcircuits of corticospinal and corticostriatal neurons in motor cortex. Nat Neurosci. 2010;13:739–744. doi: 10.1038/nn.2538. - DOI - PMC - PubMed
    1. Apicella AJ, Wickersham IR, Seung HS, Shepherd GM. Laminarly orthogonal excitation of fast-spiking and low-threshold-spiking interneurons in mouse motor cortex. J Neurosci. 2012;32:7021–7033. doi: 10.1523/JNEUROSCI.0011-12.2012. - DOI - PMC - PubMed
    1. Atencio CA, Schreiner CE. Laminar diversity of dynamic sound processing in cat primary auditory cortex. J Neurophysiol. 2010a;103:192–205. doi: 10.1152/jn.00624.2009. - DOI - PMC - PubMed

Publication types

MeSH terms

LinkOut - more resources