. 2015 Feb 18;35(7):3174-89.
doi: 10.1523/JNEUROSCI.2370-14.2015.

Differential dynamics of spatial attention, position, and color coding within the parietofrontal network

Affiliations

Differential dynamics of spatial attention, position, and color coding within the parietofrontal network

Elaine Astrand et al. J Neurosci. .

Abstract

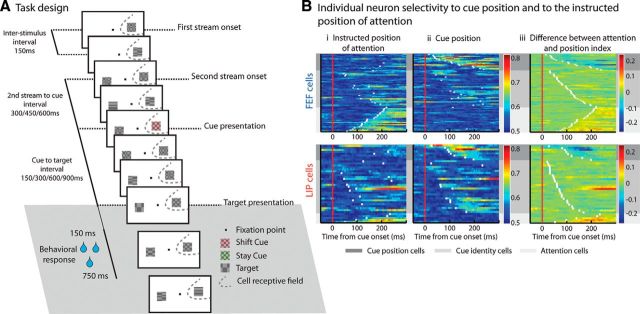
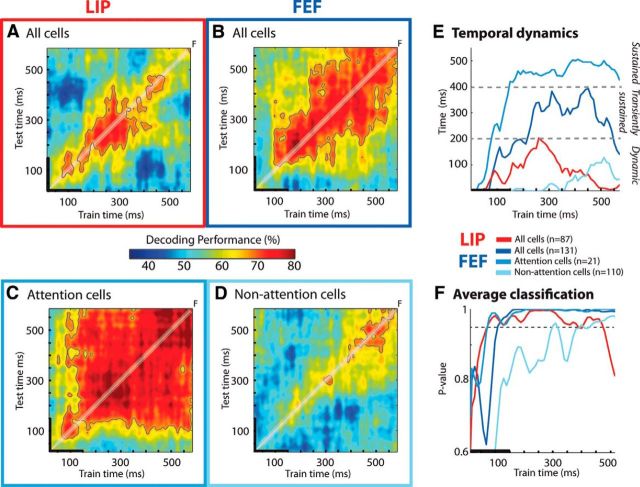
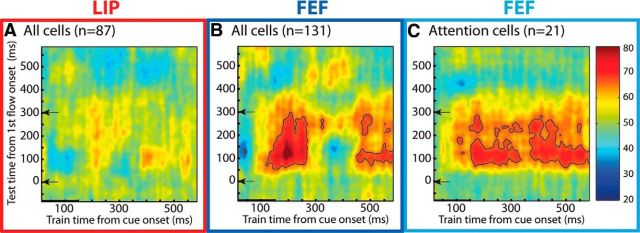
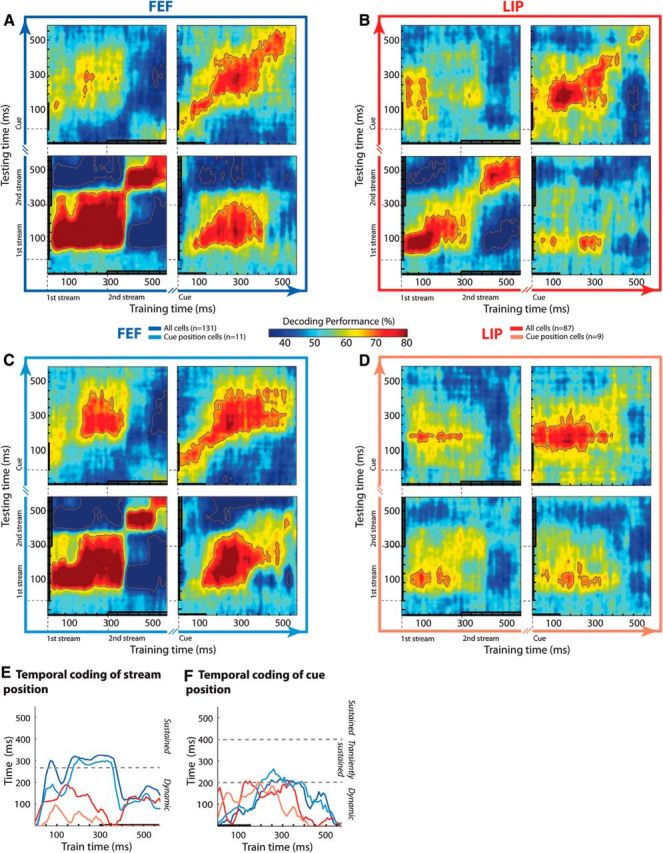
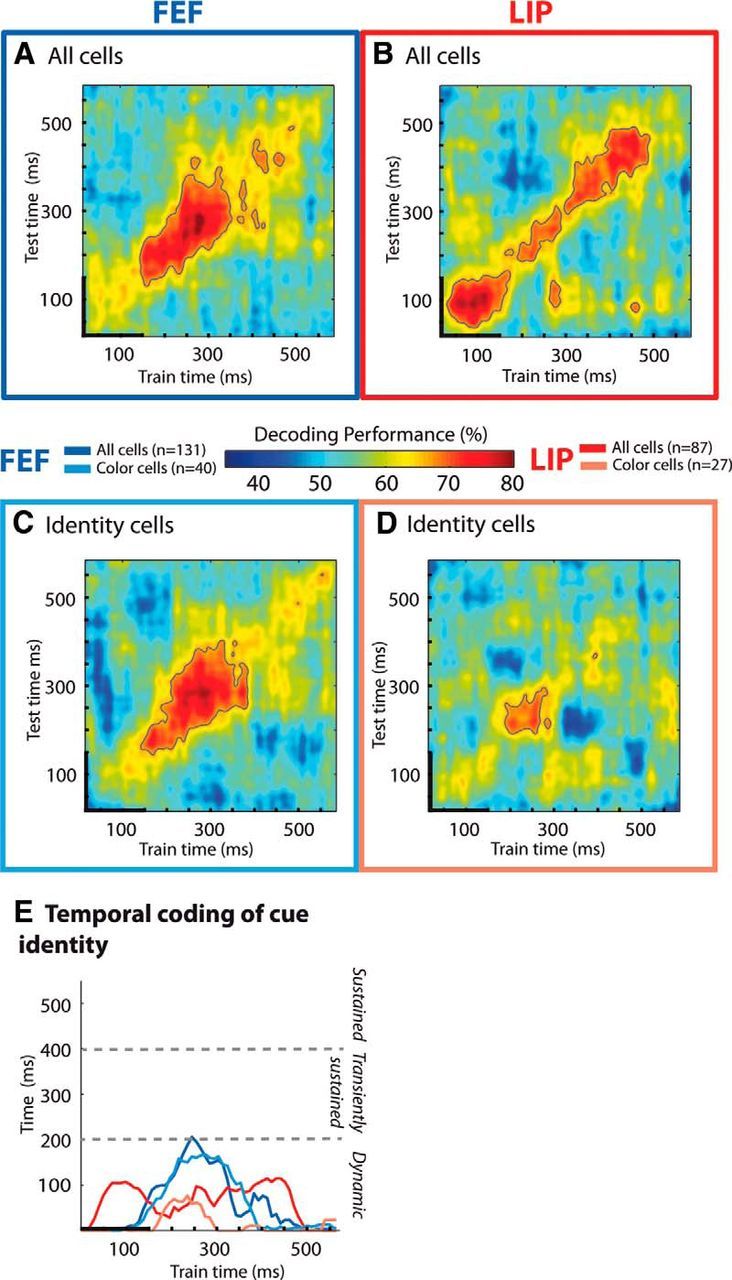
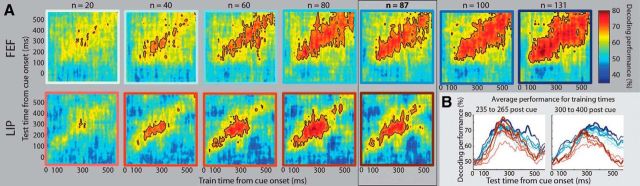
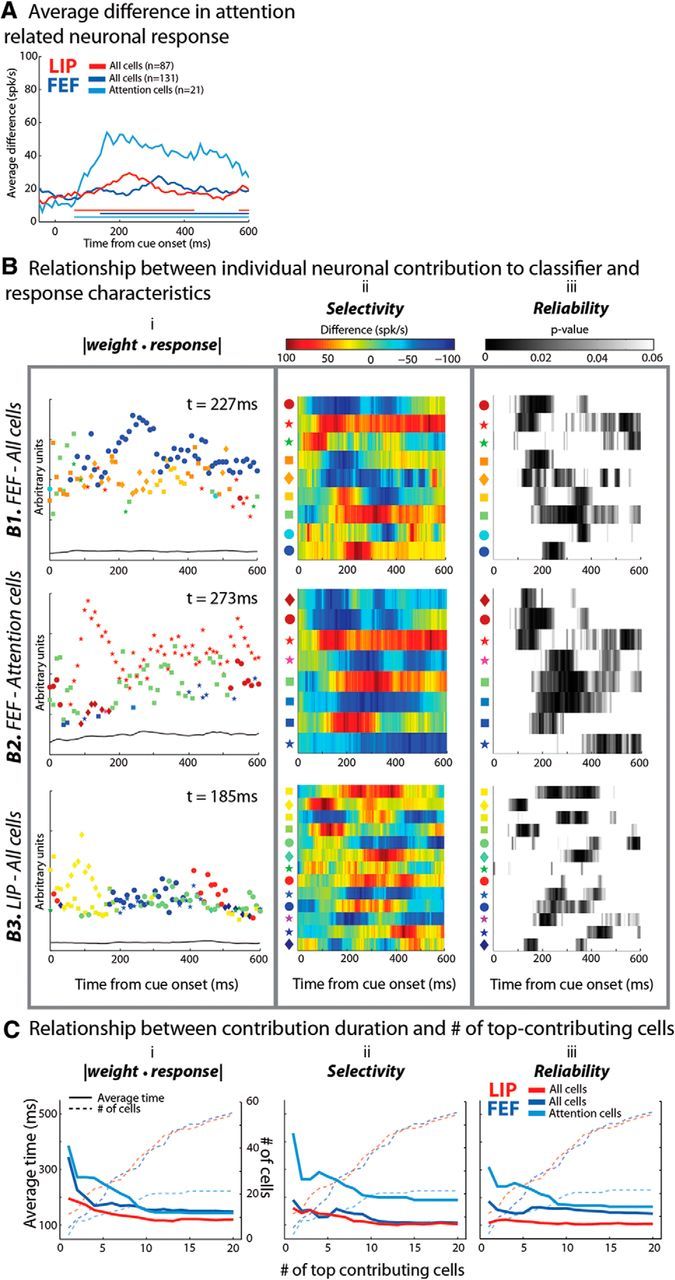
Despite an ever growing knowledge on how parietal and prefrontal neurons encode low-level spatial and color information or higher-level information, such as spatial attention, an understanding of how these cortical regions process neuronal information at the population level is still missing. A simple assumption would be that the function and temporal response profiles of these neuronal populations match that of its constituting individual cells. However, several recent studies suggest that this is not necessarily the case and that the single-cell approach overlooks dynamic changes in how information is distributed over the neuronal population. Here, we use a time-resolved population pattern analysis to explore how spatial position, spatial attention and color information are differentially encoded and maintained in the macaque monkey prefrontal (frontal eye fields) and parietal cortex (lateral intraparietal area). Overall, our work brings about three novel observations. First, we show that parietal and prefrontal populations operate in two distinct population regimens for the encoding of sensory and cognitive information: a stationary mode and a dynamic mode. Second, we show that the temporal dynamics of a heterogeneous neuronal population brings about complementary information to that of its functional subpopulations. Thus, both need to be investigated in parallel. Last, we show that identifying the neuronal configuration in which a neuronal population encodes given information can serve to reveal this same information in a different context. All together, this work challenges common views on neural coding in the parietofrontal network.

Keywords: attention; dynamic coding; frontal eye fields; lateral intraparietal area; prefrontal cortex; stationarity.


Figures

Figure 1.
Figure 1.
Task description. The experimental procedure is a cued-target detection based on a dual rapid serial visual presentation paradigm (Yantis et al., 2002, Ibos et al., 2009). The monkey is required to maintain its gaze on the central fixation point all throughout the trial. A first stream of stimuli, that is a succession of visual stimuli every 150 ms, is presented either within (as here) or opposite the fixation point from the cell's receptive field (RF). Three hundred milliseconds later, a second stream appears opposite the first stream from the fixation point. One-hundred and fifty, 300, or 450 ms (here, 300 ms) following the second-stream onset, a cue is presented within the first stream. This cue can be a green stay cue indicating to the monkey that the target has an 64% probability to appear within this very same stream or a red shift cue (as here), indicating that the target has a 64% probability to appear within the opposite stream. On 80% of the trials, the target is presented 150, 300, 600, or 900 ms from cue onset. On 80% of these target trials (64% of all trials), the target location is correctly predicted by the cue (valid target, as here). On 20% of these target trials (16% of all trials), the target location is incorrectly predicted by the cue (invalid target). On the remaining 20% of trials, no target is presented (catch trials), so as to discourage false alarms. The target is composed of just one horizontal and one vertical spatial cycle, whereas distractor items are composed of up to six horizontal and vertical spatial cycles. The monkey is rewarded for responding by a bar release, between 150 and 750 ms following target presentation, and for holding on to the bar when no target is presented. B, Individual neuron selectivity to the instructed position of attention (Bi) and to cue position (Bii) in time, as measured from an receiver operating characteristic (ROC) analysis, and (Biii) difference in attention and position index in time. This difference serves to classify the cells into cue position cells (dark gray shading), cue identity cells (intermediate gray shading), and attention cells (light gray shading). See text for details. B was adapted from Ibos et al., 2013.
Figure 2.
Figure 2.
Impact of changes in the neuronal response characteristics onto the decision boundary of a linear regression classifier model, when discriminating between the population response to a Class 1 stimulus or to a Class 2 event. A, Change in average firing rate, while the neuronal response selectivity s to Classes 1 and 2 remain constant. B, Change in the neuronal selectivity from s1 to s2, whereas reliability remains constant. C, Change in the neuronal reliability, while the neuronal response selectivity s and the average firing rate remain constant. The response firing rate of neuron 1 to class 1 (in blue) or Class 2 events (in red) is plotted against the response firing rate of neuron 2 to the same events. Each star represents the combined response of the neurons to a given event. The circles are centered on the mean response of each neuron to each class, the radius of the circles corresponding to the neuron's SD. Sharp colors represent the neuronal responses before the change in response. Lighter colors represent the neuronal responses following the change in response. The decision boundary before (respectively, after) the change in neuronal response is represented by a solid black line (respectively, dashed black line).
Figure 3.
Figure 3.
Temporal dynamics of spatial attention signals. Full cross-temporal classification analysis on the entire FEF population (A), the entire LIP population (B), the attention-specific FEF subpopulation (C), and the non-attention FEF subpopulation (D). A–D, Classifiers configured to optimally classify spatial attention from population activities are defined at every time step within 600 ms following cue onset and before target presentation (x-axis, thick black line: cue presentation, from 0 to 150 ms). The performance of each of these classifiers is tested on independent population activities during the same time interval (y-axis, thick black line: cue presentation, from 0 to 150 ms). This performance is represented in a color code, cyan representing chance classification, yellow to red scales representing above chance classification rates and blue scales representing below chance classification rates. Ninety-five percent classification confidence interval limits, as assessed by a nonparametric random-permutation test, are represented by a dark gray contour. E, Time above the 95% confidence interval for classifiers configured to optimally classify spatial attention from the neuronal population activities defined at the different training times, for the entire LIP population (red), the entire FEF population (dark blue), the attention-selective FEF population (intermediate blue), and the non-attention-selective FEF population (light blue). F, Average classification confidence (p values) over the diagonal ±10 ms with which spatial attention is extracted at each time from cue onset, by a classifier trained at the same time step (AD, gray shaded cross-section F). The dashed line corresponds to the 95% confidence interval limit. Colors as in E.
Figure 4.
Figure 4.
Spatial attention signals following first-stream onset. Cross-temporal analysis classification analysis between postcue spatial attention related signals (x-axis, thick black line: cue presentation, from 0 to 150 ms) and post-first-stream onset spatial attention-related signals (y-axis, first-stream onset: arrow at 0 ms; second-stream onset: arrow at 300 ms), for the LIP entire population (A), the FEF entire population (B), and the FEF attention-selective population (C). All else as in Figure 3.
Figure 5.
Figure 5.
Temporal dynamics of spatial position signals. Full cross-temporal classification analysis on the entire FEF population (A), the entire LIP population (B), the position-specific FEF subpopulation (C), and the position-specific LIP subpopulation (D). AD, Left, Bottom, Classifiers configured to optimally classify spatial position of first stream from population activities are defined at every time step within 600 ms following first-stream onset and before cue presentation (x-axis, black line with 0 ms onset: first-stream presentation; black line with 300 ms onset: second-stream presentation). The performance of each of these classifiers is tested on independent population activities during the same time interval (y-axis, black line with 0 ms onset: first-stream presentation; black line with 300 ms onset: second-stream presentation). Left, Top, Classifiers configured to optimally classify spatial position of cue from population activities are defined at every time step within 600 ms following first-stream onset and before cue presentation (x-axis, black line with 0 ms onset: first-stream presentation; black line with 300 ms onset: second-stream presentation). The performance of each of these classifiers is tested on independent population activities during 600 ms following cue onset, aligned on cue onset (y-axis, thick black line: cue presentation, from 0 to 150 ms). Right, Bottom, Same as above, x-axis, thick black line: cue presentation, from 0 to 150 ms; y-axis, black line with 0 ms onset: first-stream presentation, black line with 300 ms onset: second-stream presentation. Right, Top, Same as above, x-axis and y-axis: thick black line: cue presentation. E, Time above the 95% confidence interval for classifiers configured to optimally classify stream position from the neuronal population activities defined at the different training times, for the different neuronal populations (colors as in AD). F, Time above the 95% confidence interval for classifiers configured to optimally classify cue position from the neuronal population activities defined at the different training times. All as in E.
Figure 6.
Figure 6.
Temporal dynamics of color signals. Full cross-temporal classification analysis on the entire FEF population (A), the entire LIP population (B), the color-specific FEF subpopulation (C), and the color-specific LIP subpopulation (D). E, Time above the 95% confidence interval for classifiers configured to optimally classify cue identity from the neuronal population activities defined at the different training times, for the different neuronal populations (colors as in AD). All as in Figure 3.
Figure 7.
Figure 7.
Temporal dynamics as a function of population size. A, Full cross-temporal classification analysis for decoding the position of spatial attention on populations of different size, drawn randomly from the entire FEF population (A, top row) or from the entire LIP population (A, bottom row). B, Decoding performances in time, from cue onset to 00 ms into the cue to target interval, for each population (FEF, blue shades; LIP, red shades) and each population size (color as in A), for two fixed training windows (B, left, 235–265 ms postcue; B, right, 300–400 ms postcue). Statistical significance is indicated, for each plot by a thicker line plots.
Figure 8.
Figure 8.
Relationship between the population temporal dynamics and the underlying individual neuronal responses. A, Average population difference in attention-related response, for the entire FEF population (dark blue, n = 131), FEF attention-selective cells (light blue, n = 21), and the entire LIP population (red, n = 87). Activities aligned on cue onset. The colored straight lines show time-points when the selectivity is statistically different from the baseline (see text for details). B, Relationship between classification weights and individual neuronal response characteristics. Bi, Contribution to the readout of the classifier (as assessed by |weight · response| of the top-two contributing cells, in time steps of 10 ms, for classifiers defined on the entire FEF population (B1, horizontal), the FEF attention-selective population (B2, horizontal), and the entire LIP population (B3, horizontal). Each cell is color- and shape-coded. The black curves represent the average contribution over all cells. Bii, Attention selectivity in time (defined as defined as the spike-rate difference between attention to the left vs right) of these top-contributing cells. Biii, Attentional response reliability in time (defined as the p value of this selectivity, as assessed by two-tail nonparametric random permutation tests) of these top-contributing cells. C, Average contribution time as a function of the number of top-contributing cell criteria, (Ci) to the readout of the classifier, (Cii) to attention selectivity, and (Ciii) to attentional response reliability. Colors as in A. Continuous lines: average time (for selectivity: above baseline ±3 SD, for reliability: p < 0.05). Dashed lines: number of cells, as the top-contributing cell criteria increases.

Similar articles

Cited by

References

    1. Anton-Erxleben K, Stephan VM, Treue S. Attention reshapes center-surround receptive field structure in macaque cortical area MT. Cereb Cortex. 2009;19:2466–2478. doi: 10.1093/cercor/bhp002. - DOI - PMC - PubMed
    1. Armstrong KM, Chang MH, Moore T. Selection and maintenance of spatial information by frontal eye field neurons. J Neurosci. 2009;29:15621–15629. doi: 10.1523/JNEUROSCI.4465-09.2009. - DOI - PMC - PubMed
    1. Astrand E, Enel P, Ibos G, Dominey PF, Baraduc P, Ben Hamed S. Comparison of classifiers for decoding sensory and cognitive information from prefrontal neuronal populations. PLoS ONE. 2014a;9:e86314. doi: 10.1371/journal.pone.0086314. - DOI - PMC - PubMed
    1. Astrand E, Wardak C, Ben Hamed S. Selective visual attention to drive cognitive brain-machine interfaces: from concepts to neurofeedback and rehabilitation applications. Front Syst Neurosci. 2014b;8:144. doi: 10.3389/fnsys.2014.00144. - DOI - PMC - PubMed
    1. Barak O, Tsodyks M, Romo R. Neuronal population coding of parametric working memory. J Neurosci. 2010;30:9424–9430. doi: 10.1523/JNEUROSCI.1875-10.2010. - DOI - PMC - PubMed

Publication types

LinkOut - more resources