. 2015 Feb 18;35(7):3263-75.
doi: 10.1523/JNEUROSCI.3920-13.2015.

Spiral ganglion degeneration and hearing loss as a consequence of satellite cell death in saposin B-deficient mice

Affiliations

Spiral ganglion degeneration and hearing loss as a consequence of satellite cell death in saposin B-deficient mice

Omar Akil et al. J Neurosci. .

Abstract

Saposin B (Sap B) is an essential activator protein for arylsulfatase A in the hydrolysis of sulfatide, a lipid component of myelin. To study Sap B's role in hearing and balance, a Sap B-deficient (B(-/-)) mouse was evaluated. At both light and electron microscopy (EM) levels, inclusion body accumulation was seen in satellite cells surrounding spiral ganglion (SG) neurons from postnatal month 1 onward, progressing into large vacuoles preceding satellite cell degeneration, and followed by SG degeneration. EM also revealed reduced or absent myelin sheaths in SG neurons from postnatal month 8 onwards. Hearing loss was initially seen at postnatal month 6 and progressed thereafter for frequency-specific stimuli, whereas click responses became abnormal from postnatal month 13 onward. The progressive hearing loss correlated with the accumulation of inclusion bodies in the satellite cells and their subsequent degeneration. Outer hair cell numbers and efferent function measures (distortion product otoacoustic emissions and contralateral suppression) were normal in the B(-/-) mice throughout this period. Alcian blue staining of SGs demonstrated that these inclusion bodies corresponded to sulfatide accumulation. In contrast, changes in the vestibular system were much milder, but caused severe physiologic deficits. These results demonstrate that loss of Sap B function leads to progressive sulfatide accumulation in satellite cells surrounding the SG neurons, leading to satellite cell degeneration and subsequent SG degeneration with a resultant loss of hearing. Relative sparing of the efferent auditory and vestibular neurons suggests that alternate glycosphingolipid metabolic pathways predominate in these other systems.

Keywords: auditory; cochlea; prosaposin; saposin B; spiral ganglion; sulfatide.


Figures

Figure 1.
Figure 1.
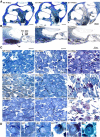
Light microscopy of the cochlea and SG neurons of B−/− mice during development. A, B, Cochlea and organ of Corti at low (A) and high (B) magnification. Rosenthal's canal (RC) is occupied by SG cells and cochlear nerve fibers in the WT (shown at P15mo), while similar views of the B−/− mouse are marked by increasing loss of SG and cochlear nerve fibers at P8mo and P15mo. These images also document normal organ of Corti morphology, including IHCs and OHCs and the stria vascularis in both WT and B−/− mice through P15mo. NF, Nerve fibers; TC, tunnel of Corti. Scale bar, 200 μm. C, Light micrographs of semithin sections (5 μm) of SGs of B−/− mice at P1mo, P2mo, P4mo, P6mo, P8mo, and P15mo. WT mice at P1mo, P6mo, and P8mo are included for comparison. Overall morphology between the SGs of the B−/− and the WT mice is similar, but abnormal inclusions in the satellite cells are first seen at P1mo in B−/− mice (black arrow) when compared with normal SGs of WT (white arrow) mice. These inclusions in the satellite cells increase progressively with age (arrows) and are associated with loss of SG neurons in B−/− mice at P6mo and older. At P15mo, nonmyelinated SG type 2 neurons are clearly visualized and normal appearing (arrowheads), whereas myelinated type 1 neurons SG cell numbers are severely reduced in B−/− mice. Scale bar, 10 μm. D, Magnified view of the SG neurons and surrounding normal satellite cells in WT mice (white arrows) and increasing inclusions in the satellite cells in B−/− mice (black arrows).
Figure 2.
Figure 2.
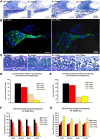
Cochlea SG neurons and nerve fiber assessment in the B−/− mice during development. A, Toluidine blue-stained sections of the radial cochlea nerve fibers during development stages show a progressive cochlea fiber loss with age in the B−/− mice when compared with the WT littermates (black arrows). Scale bar, 30 μm. B, Immunofluorescence of the cochlea nerve fibers with anti-neurofilament antibody (a marker of afferent and efferent neuronal auditory nerves; Berglund and Ryugo, 1991) stain shows that the P6mo B−/− mouse cochlear section has significantly less labeling of the cochlear nerve fibers compared with the WT littermate, documenting the presence of fewer fibers in the B−/− compared with the WT mice. Scale bar, 50 μm. C, Toluidine blue-stained sections, cut tangentially through the osseous spiral lamina to reveal cochlear nerve fibers in cross section, show a progressive cochlear fiber loss with age in B−/− mice compared with WT littermates, similar to that observed for the radial cochlea nerve fibers in light microscopy (A) and immunofluorescence (B). Scale bar, 10 μm. D, Quantitative assessment of cochlea nerve fiber numbers in B−/− mice during development. Loss of nerve fibers is first documented at P4mo and increased at P8mo and P15mo, when only 43 and 15% of nerve fibers remain, respectively. E, The cochlear Schwann cell counts were done in a similar manner and confirm that the loss of cochlear neuronal fibers is accompanied by the loss of Schwann cells at P8mo and at P15mo in B−/− mice. F, Quantitative assessment of cochlea SG cell counts through P15mo. The loss of cochlear SG neurons mirrors the loss of cochlea nerve fibers in B−/− mice. At P4mo, there was a greater loss of SG neurons in the base compared with the midturns and apical turns, but by P8mo and beyond no differences in cell counts were noted between turns. G, Though overall SG neuronal counts, Schwann cells, and nerve fibers are reduced (Fig. 2D–F), the SG cell size was significantly increased in the apical turns and midturns of B−/− mice at P4mo and P8mo, but at P15mo this increase in cell size was significant for all cochlear turns.
Figure 3.
Figure 3.
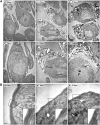
EM of the SG neurons and the myelin sheaths of B−/− mice. A, SG neurons from WT (P8mo) and B−/− (P8mo and P15mo) mice at lower magnification. Scale bars: top, 2 μm; bottom, 1 μm. WT mice demonstrate normal SG morphology (left column). In contrast, inclusions were seen in B−/− mouse ears where satellite cells are packed with lucent material containing inclusion bodies with large vacuoles mixed with large electron dense material. These inclusions in the satellite cells greatly increase in B−/− mice at P15mo. The separation of the myelin sheath from the SG neuron seen in WT mice is likely artifactual, due to specimen processing. N, SG nucleus; SC, satellite cells; SC+ I, satellite cells plus inclusions; black arrows, inclusions in SG cytoplasm. B, At P8mo, SG myelin sheaths in B−/− mice are so thin they seem to disappear. Meanwhile, SG myelin sheaths in the WT littermates at P8mo are clearly visible. Scale bar, 300 nm.
Figure 4.
Figure 4.
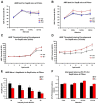
ABR measurement of B−/− mice. ABR was used to test hearing in B−/−, Het, and WT mice at varying ages (P1mo, P3mo, P4mo, P6mo, P8mo, P13mo, and P15mo) using broadband clicks and tone-burst stimuli (8, 16, and 32 kHz). A, At P4mo, ABR thresholds demonstrate no significant differences in hearing between the B−/− (n = 10), Het (n = 12), and WT (n = 15) mice. B, At P8mo, significant increases in the ABR threshold for each of the tone-burst stimuli (8, 16, and 32 kHz) are noted, though click responses are not significantly different at this age. C, There are no differences seen in click stimuli between WT and B−/− mice until P13mo. Afterward the B−/− auditory thresholds become significantly elevated. D, In contrast to click stimuli, the frequency-specific ABR thresholds are significantly elevated at P6mo and older for each of the sound stimuli (8, 16, and 32 kHz; only 16 kHz is shown). E, There is a significant decrease in ABR wave I amplitudes in the B−/− mice measured at different intensity levels (86, 76, 66, and 56 dB SPL) when compared with the WT littermates (Fig. 4E), likely as a consequence of the reduction in auditory neurons. F, ABR P2–P1interpeak latencies showed a small but significant increase at P8mo between B−/− and WT mice.
Figure 5.
Figure 5.
OHC and efferent function of B−/− mice. A–E, OHC and efferent auditory function in B−/− mice were measured using DPOAE (A, B), CS-DPOAE (C, D), and cochlear whole-mount immunofluorescent staining using anti-myosin 7a antibody and rhodamine phalloidin staining (E). At P4mo, DPOAE (A) and CS-DPOAE (C) demonstrate no significant differences between WT and B−/− mice. Likewise, at P8mo, no differences are noted in these measures in WT and B−/− mice (B, D). E, Hair cell counts using representative samples of surface preparations show a normal complement of OHC and no OHC loss at all locations along the cochlea. Scale bar, 20 μm. OHC rows 1–3 are indicated by OHC1, OHC2, and OHC3, respectively.
Figure 6.
Figure 6.
Vestibular function in B−/− mice. A–D, Light microscopy of the ampullae nerve fibers (A), vestibular ganglion neurons (B), and the VsEP recordings (C, D) of B−/− mice during development. A, The general organization of the ampulla appears unaltered (normal hair cell and supporting cell morphology) with no noticeable vestibular fiber loss in B−/− mice at older ages when compared with WT mice. At P8mo–P15mo, inclusion bodies are seen (black arrows) though there is not an accompanying loss of vestibular neurons. Scale bar, 30 μm. B, Vestibular ganglion of B−/− mouse shows the same inclusion bodies as the cochlea SG but with less degeneration from P8mo to P15mo. Scale bar, 30 μm. C, Representative VsEP intensity series for WT (left) and B−/− (right) mice. The first two positive response peaks are labeled P1 and P2, respectively. Stimulus levels are shown in decibels (re: 1.0 g/ms) and ranged from +6 dB to −18 dB. At +6 dB, VsEPs were collected without the forward masker (UM) and later with the masker (M) throughout the testing. Each stimulus level shows two response waveforms to demonstrate response replication. As the stimulus level is reduced, peak-to-peak amplitudes decrease and latencies increase until no response is observed at levels below threshold. VsEP thresholds for these representative animals were scored at −13.5 dB re: 1.0 g/ms for WT and absent response for B−/−. Total time represented for each waveform is 10 ms. D, Representative VsEP waveforms recorded at the maximum stimulus level (+6 dB re: 1.0 g/ms) for three WT (top) and three B−/− (bottom) mice. WT mice showed normal vestibular function, and VsEPs were completely absent from B−/− mice. The first two response peaks are labeled P1 and P2, respectively. Two waveforms are shown for each animal to demonstrate response replication. Total time represented for each waveform is 10 ms.
Figure 7.
Figure 7.
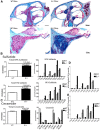
Liquid chromatography/mass spectrometry analysis of sulfatide levels in B−/− cochlear SGs. A, Significant alcian blue staining of the B−/− cochlear SGs (blue stain) is seen when compared with the WT cochlear SGs, indicative of sulfatide accumulation in SG neurons of B−/− mice. The whole cochlear section (top, low magnification; scale bar, 200 μm) and a higher magnification of the SGs (bottom; scale bar, 50 μm) are shown. B, Most of the NFA sulfatide (top) and HFA sulfatide (bottom) species were increased in B−/− mouse SGs compared with WT mouse SGs. Total NFA sulfatides and HFA sulfatides were increased in B−/− mouse SGs by 1.74-fold and 1.44-fold, respectively, when compared with that of WT mice SGs. C, C18 ceramide and total ceramides show no significant increase in the B−/− SGs when compared with that of WT SGs. D, Most NFA sulfatides are increased when normalized to C18 ceramide in the same sample. E, Most HFA sulfatide species are also significantly increased when normalized to C18 ceramide in the same sample. Total sulfatides in B−/− SGs were increased by 1.65-fold compared with WT SGs, mirroring the increased alcian blue staining on SGs in cochlea (A).

References

    1. Ahn VE, Faull KF, Whitelegge JP, Fluharty AL, Privé GG. Crystal structure of saposin B reveals a dimeric shell for lipid binding. Proc Natl Acad Sci U S A. 2003;100:38–43. doi: 10.1073/pnas.0136947100. - DOI - PMC - PubMed
    1. Akil O, Chang J, Hiel H, Kong JH, Yi E, Glowatzki E, Lustig LR. Progressive deafness and altered cochlear innervation in knock-out mice lacking prosaposin. J Neurosci. 2006;26:13076–13088. doi: 10.1523/JNEUROSCI.3746-06.2006. - DOI - PMC - PubMed
    1. Akil O, Seal RP, Burke K, Wang C, Alemi A, During M, Edwards RH, Lustig LR. Restoration of hearing in the VGLUT3 knockout mouse using virally mediated gene therapy. Neuron. 2012;75:283–293. doi: 10.1016/j.neuron.2012.05.019. - DOI - PMC - PubMed
    1. Berglund AM, Ryugo DK. Neurofilament antibodies and spiral ganglion neurons of the mammalian cochlea. J Comp Neurol. 1991;306:393–408. doi: 10.1002/cne.903060304. - DOI - PubMed
    1. Ciaffoni F, Tatti M, Boe A, Salvioli R, Fluharty A, Sonnino S, Vaccaro AM. Saposin B binds and transfers phospholipids. J Lipid Res. 2006;47:1045–1053. doi: 10.1194/jlr.M500547-JLR200. - DOI - PubMed

Publication types

MeSH terms

Supplementary concepts

LinkOut - more resources