

Regulation of epithelial-mesenchymal transition in breast cancer cells by cell contact and adhesion
- PMID: 25698877
- PMCID: PMC4325704
- DOI: 10.4137/CIN.S18965
Regulation of epithelial-mesenchymal transition in breast cancer cells by cell contact and adhesion
Abstract
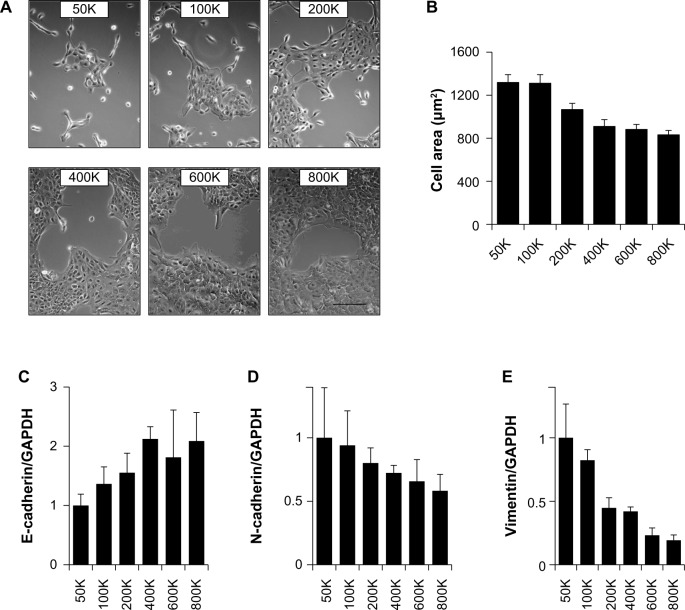
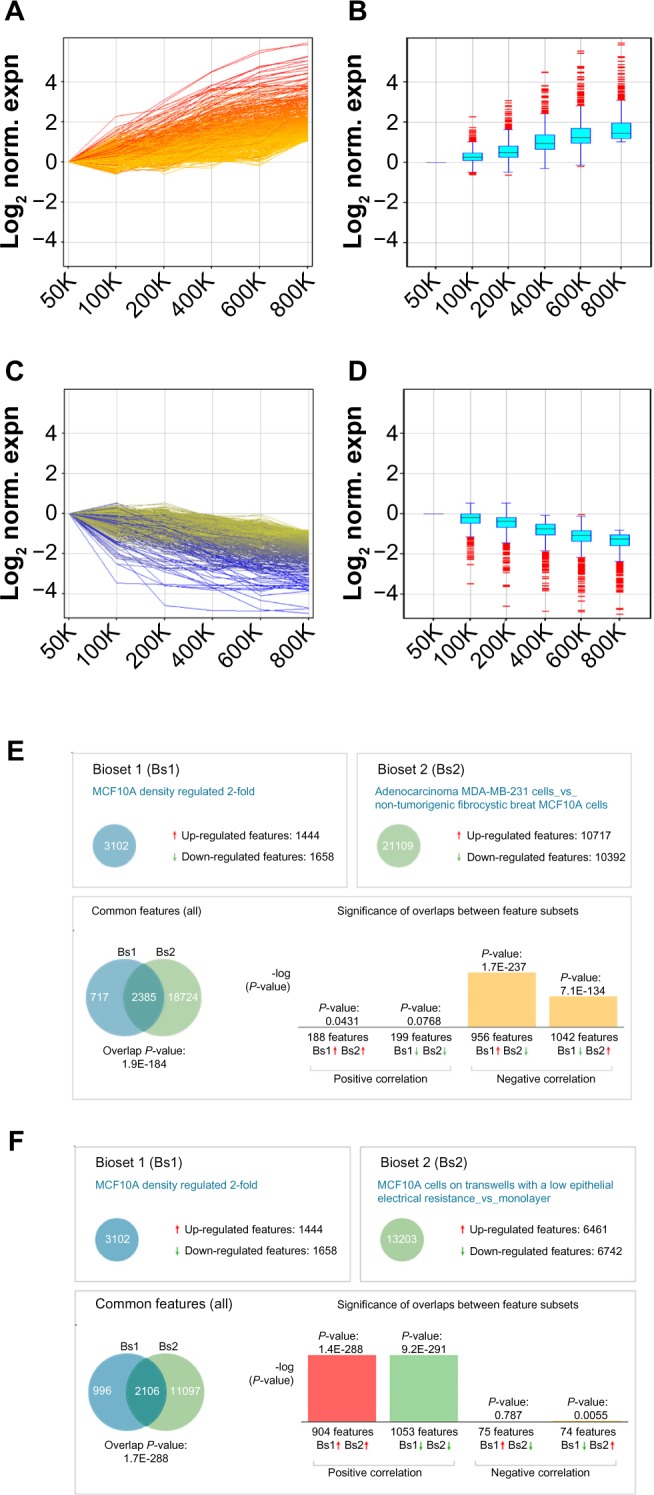
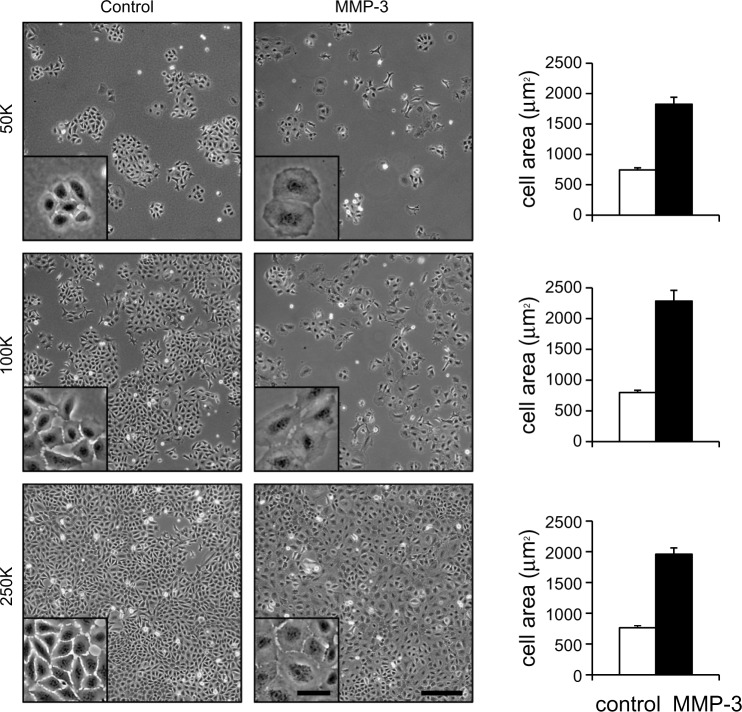
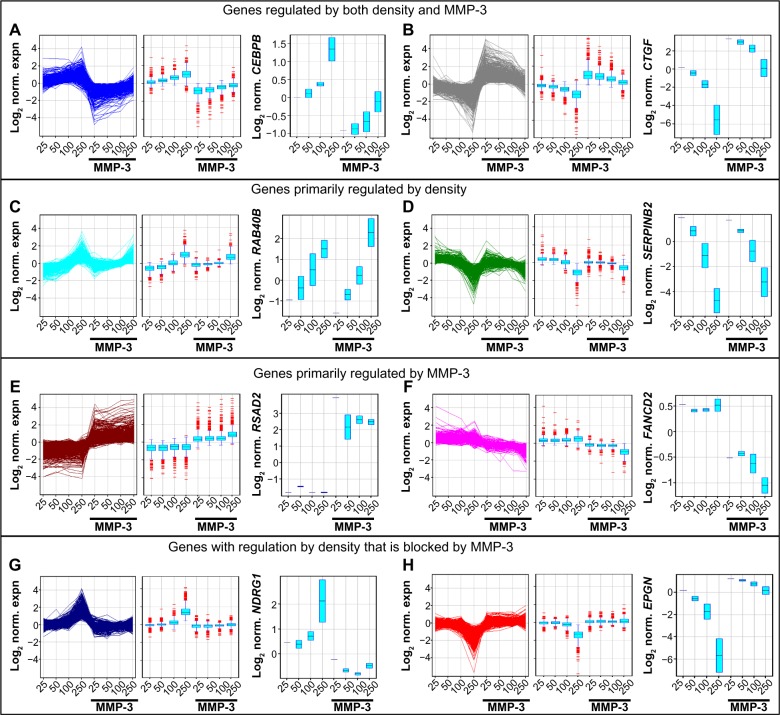
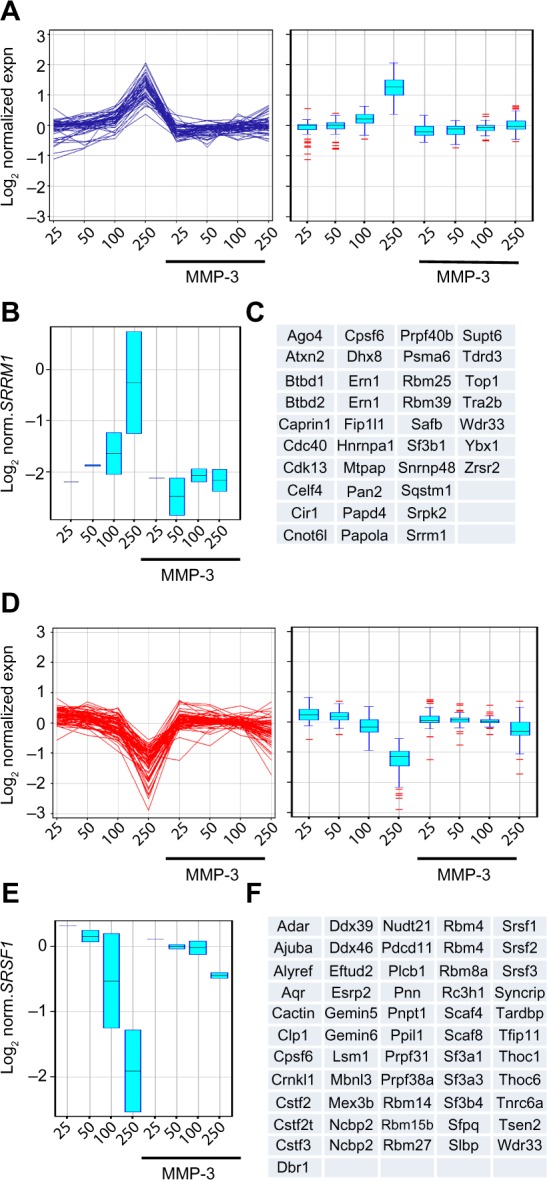
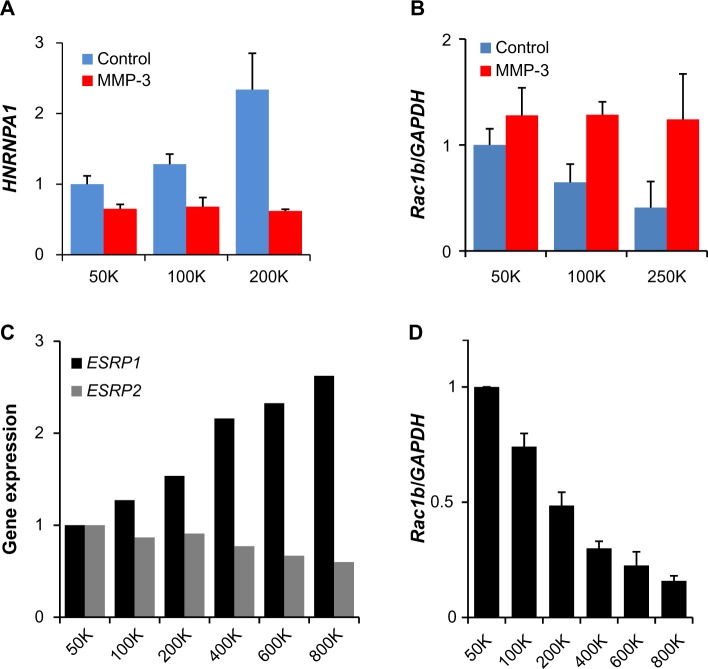
Epithelial-mesenchymal transition (EMT) is a physiological program that is activated during cancer cell invasion and metastasis. We show here that EMT-related processes are linked to a broad and conserved program of transcriptional alterations that are influenced by cell contact and adhesion. Using cultured human breast cancer and mouse mammary epithelial cells, we find that reduced cell density, conditions under which cell contact is reduced, leads to reduced expression of genes associated with mammary epithelial cell differentiation and increased expression of genes associated with breast cancer. We further find that treatment of cells with matrix metalloproteinase-3 (MMP-3), an inducer of EMT, interrupts a defined subset of cell contact-regulated genes, including genes encoding a variety of RNA splicing proteins known to regulate the expression of Rac1b, an activated splice isoform of Rac1 known to be a key mediator of MMP-3-induced EMT in breast, lung, and pancreas. These results provide new insights into how MMPs act in cancer progression and how loss of cell-cell interactions is a key step in the earliest stages of cancer development.
Keywords: breast cancer; cell contact; epithelial-mesenchymal transition; extracellular matrix; mammary epithelial cells; matrix metalloproteinases.
Figures
Similar articles
-
Matrix metalloproteinase-induced epithelial-mesenchymal transition in breast cancer.J Mammary Gland Biol Neoplasia. 2010 Jun;15(2):201-12. doi: 10.1007/s10911-010-9177-x. Epub 2010 May 5. J Mammary Gland Biol Neoplasia. 2010. PMID: 20440544 Free PMC article. Review.
-
Matrix metalloproteinase-induced malignancy in mammary epithelial cells.Cells Tissues Organs. 2007;185(1-3):104-10. doi: 10.1159/000101310. Cells Tissues Organs. 2007. PMID: 17587815 Review.
-
ROS-induced epithelial-mesenchymal transition in mammary epithelial cells is mediated by NF-kB-dependent activation of Snail.Oncotarget. 2014 May 15;5(9):2827-38. doi: 10.18632/oncotarget.1940. Oncotarget. 2014. PMID: 24811539 Free PMC article.
-
Change in cell shape is required for matrix metalloproteinase-induced epithelial-mesenchymal transition of mammary epithelial cells.J Cell Biochem. 2008 Sep 1;105(1):25-33. doi: 10.1002/jcb.21821. J Cell Biochem. 2008. PMID: 18506791 Free PMC article.
-
Matrix metalloproteinase-9 cooperates with transcription factor Snail to induce epithelial-mesenchymal transition.Cancer Sci. 2011 Apr;102(4):815-27. doi: 10.1111/j.1349-7006.2011.01861.x. Epub 2011 Feb 9. Cancer Sci. 2011. PMID: 21219539
Cited by
-
Young age at diagnosis is associated with worse prognosis in the Luminal A breast cancer subtype: a retrospective institutional cohort study.Breast Cancer Res Treat. 2018 Dec;172(3):689-702. doi: 10.1007/s10549-018-4950-4. Epub 2018 Sep 17. Breast Cancer Res Treat. 2018. PMID: 30225619 Free PMC article.
-
PRSS3/Mesotrypsin and kallikrein-related peptidase 5 are associated with poor prognosis and contribute to tumor cell invasion and growth in lung adenocarcinoma.Sci Rep. 2019 Feb 12;9(1):1844. doi: 10.1038/s41598-018-38362-0. Sci Rep. 2019. PMID: 30755669 Free PMC article.
-
TMEM87a/Elkin1, a component of a novel mechanoelectrical transduction pathway, modulates melanoma adhesion and migration.Elife. 2020 Apr 1;9:e53308. doi: 10.7554/eLife.53308. Elife. 2020. PMID: 32228863 Free PMC article.
-
Epithelial Cell Mechanoresponse to Matrix Viscoelasticity and Confinement Within Micropatterned Viscoelastic Hydrogels.Adv Sci (Weinh). 2025 May;12(18):e2408635. doi: 10.1002/advs.202408635. Epub 2025 Feb 14. Adv Sci (Weinh). 2025. PMID: 39950757 Free PMC article.
-
Protein kinase TTK promotes proliferation and migration and mediates epithelial-mesenchymal transition in human bladder cancer cells.Int J Clin Exp Pathol. 2018 Oct 1;11(10):4854-4861. eCollection 2018. Int J Clin Exp Pathol. 2018. PMID: 31949560 Free PMC article.
References
Grants and funding
LinkOut - more resources
Full Text Sources
Molecular Biology Databases
Research Materials
Miscellaneous
