

Identification and Expression Analysis of Ribosome Biogenesis Factor Co-orthologs in Solanum lycopersicum
- PMID: 25698879
- PMCID: PMC4325683
- DOI: 10.4137/BBI.S20751
Identification and Expression Analysis of Ribosome Biogenesis Factor Co-orthologs in Solanum lycopersicum
Abstract
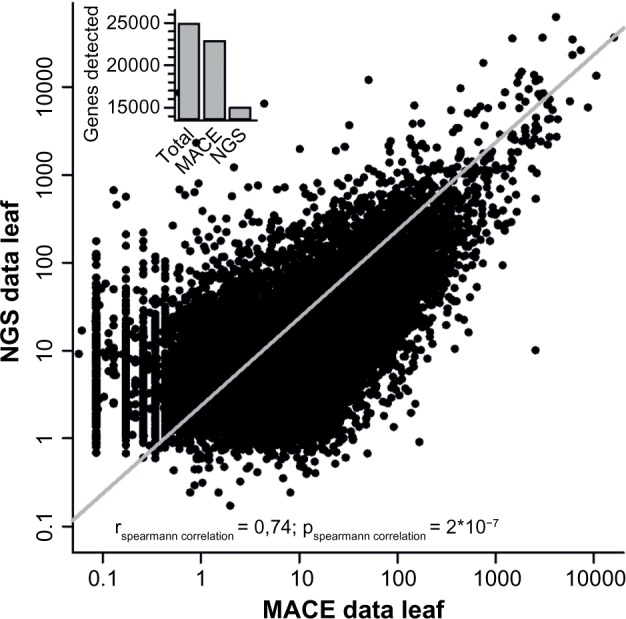
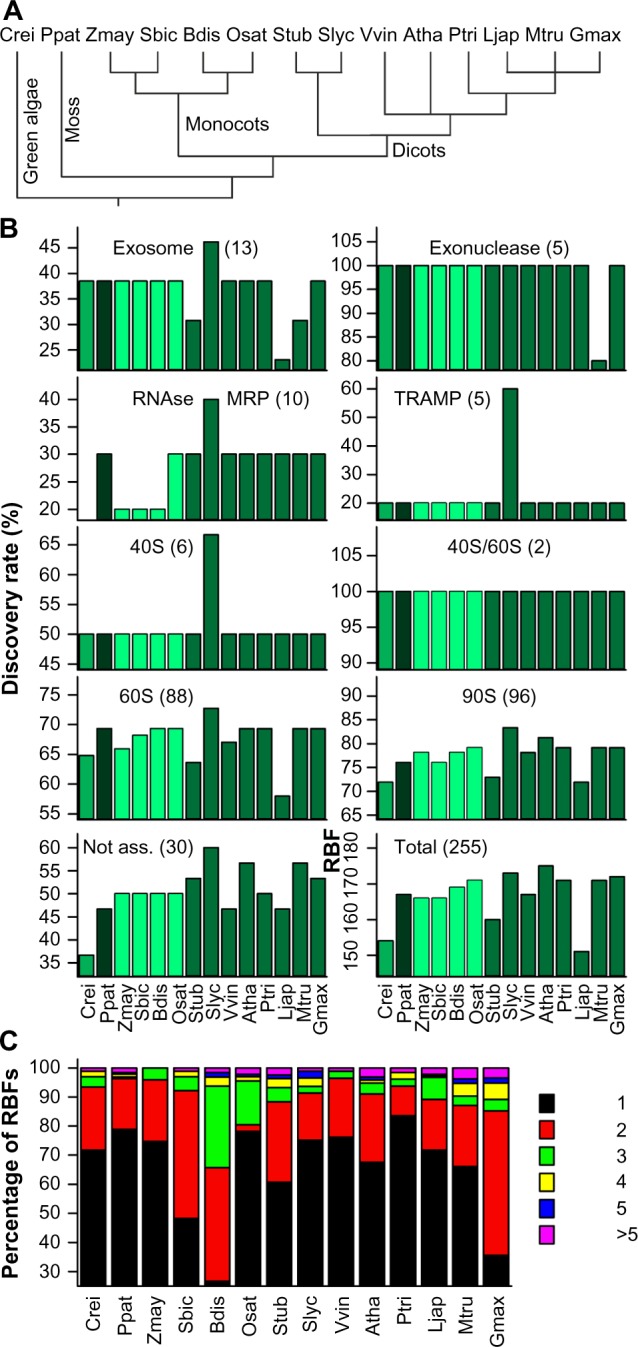
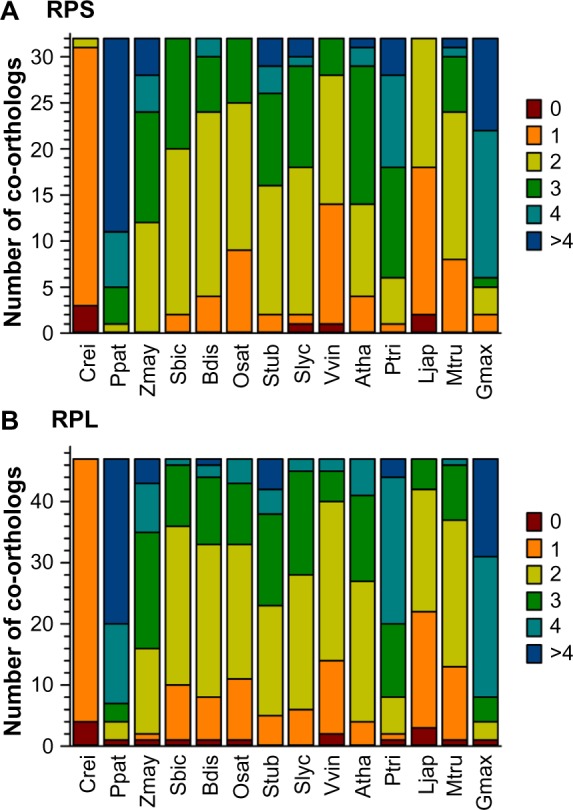
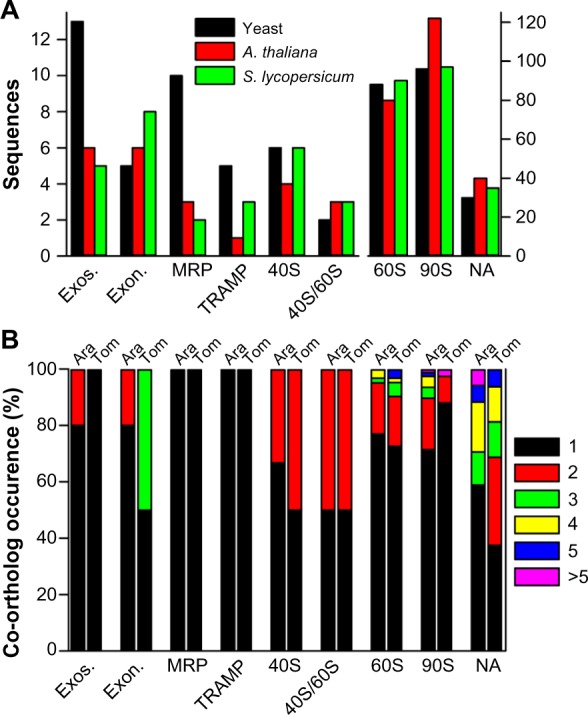
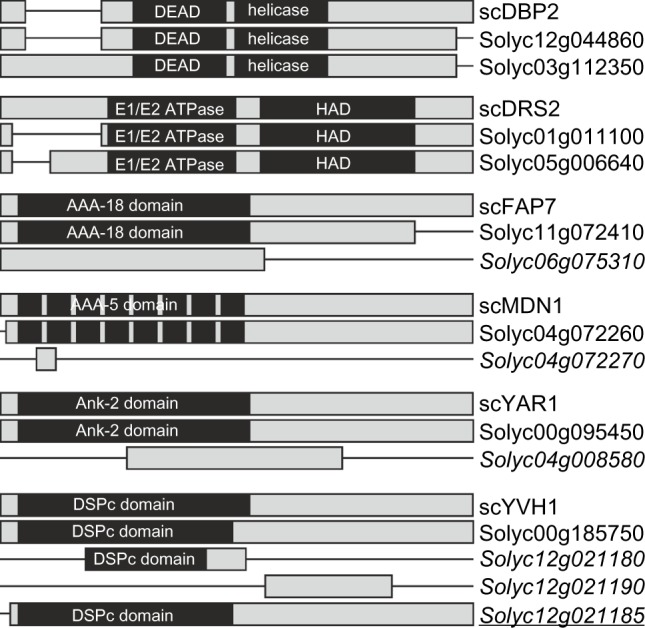
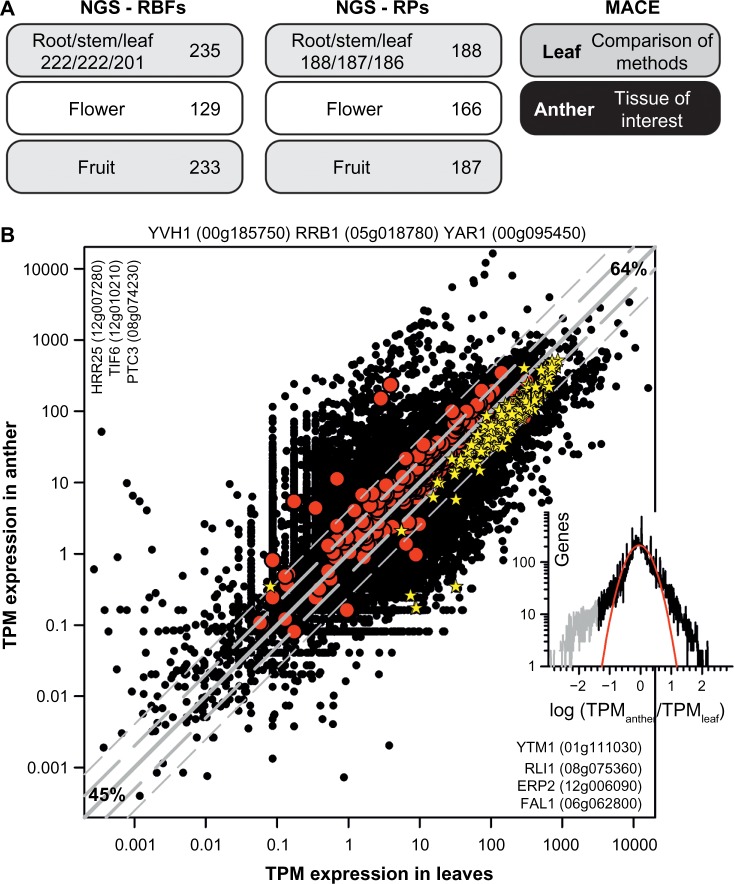
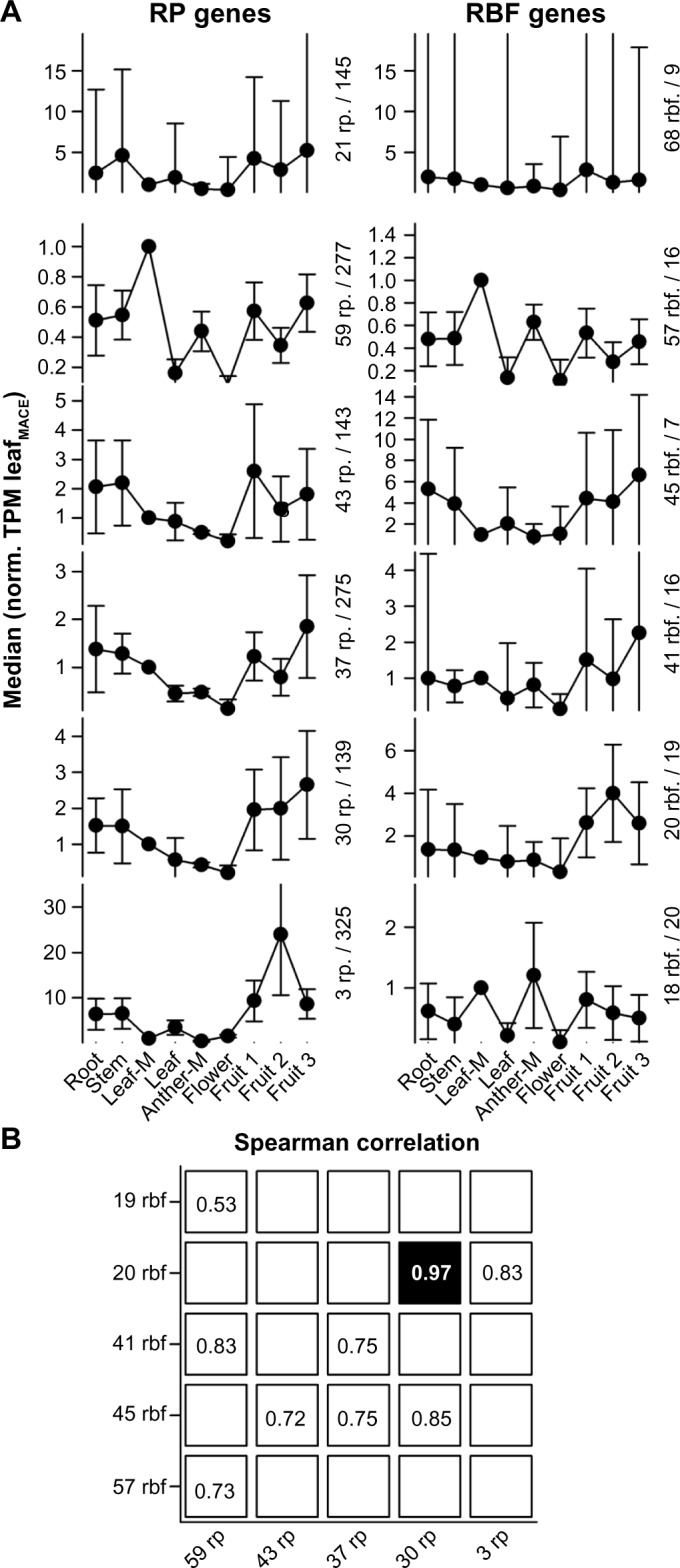
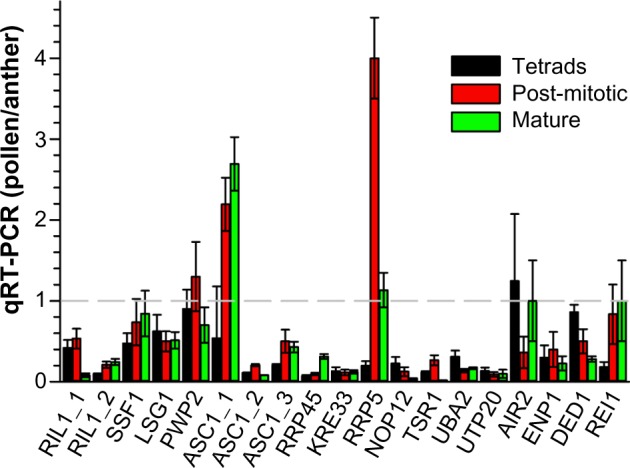
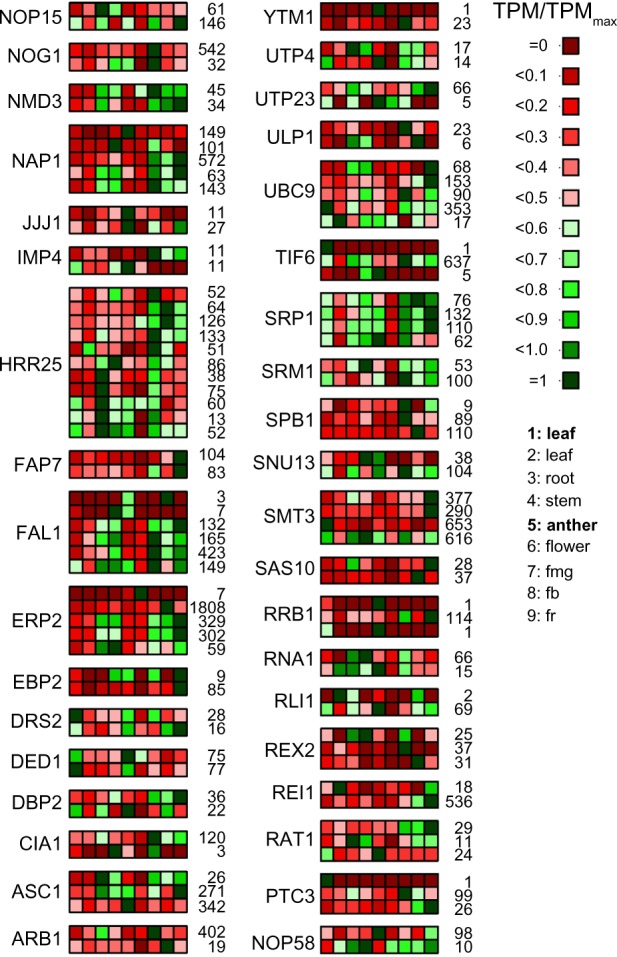
Ribosome biogenesis involves a large inventory of proteinaceous and RNA cofactors. More than 250 ribosome biogenesis factors (RBFs) have been described in yeast. These factors are involved in multiple aspects like rRNA processing, folding, and modification as well as in ribosomal protein (RP) assembly. Considering the importance of RBFs for particular developmental processes, we examined the complexity of RBF and RP (co-)orthologs by bioinformatic assignment in 14 different plant species and expression profiling in the model crop Solanum lycopersicum. Assigning (co-)orthologs to each RBF revealed that at least 25% of all predicted RBFs are encoded by more than one gene. At first we realized that the occurrence of multiple RBF co-orthologs is not globally correlated to the existence of multiple RP co-orthologs. The transcript abundance of genes coding for predicted RBFs and RPs in leaves and anthers of S. lycopersicum was determined by next generation sequencing (NGS). In combination with existing expression profiles, we can conclude that co-orthologs of RBFs by large account for a preferential function in different tissue or at distinct developmental stages. This notion is supported by the differential expression of selected RBFs during male gametophyte development. In addition, co-regulated clusters of RBF and RP coding genes have been observed. The relevance of these results is discussed.
Keywords: MACE; next generation sequencing; orthologous prediction; qRT-PCR; ribosome biogenesis; tomato.
Figures
Similar articles
-
Co-orthologues of ribosome biogenesis factors in A. thaliana are differentially regulated by transcription factors.Plant Cell Rep. 2019 Aug;38(8):937-949. doi: 10.1007/s00299-019-02416-y. Epub 2019 May 13. Plant Cell Rep. 2019. PMID: 31087154
-
Proteome distribution between nucleoplasm and nucleolus and its relation to ribosome biogenesis in Arabidopsis thaliana.RNA Biol. 2016;13(4):441-54. doi: 10.1080/15476286.2016.1154252. Epub 2016 Mar 16. RNA Biol. 2016. PMID: 26980300 Free PMC article.
-
Tracing Eukaryotic Ribosome Biogenesis Factors Into the Archaeal Domain Sheds Light on the Evolution of Functional Complexity.Front Microbiol. 2021 Sep 16;12:739000. doi: 10.3389/fmicb.2021.739000. eCollection 2021. Front Microbiol. 2021. PMID: 34603269 Free PMC article.
-
Plant-Specific Features of Ribosome Biogenesis.Trends Plant Sci. 2015 Nov;20(11):729-740. doi: 10.1016/j.tplants.2015.07.003. Epub 2015 Oct 11. Trends Plant Sci. 2015. PMID: 26459664 Review.
-
Feedback regulation of ribosome assembly.Curr Genet. 2018 Apr;64(2):393-404. doi: 10.1007/s00294-017-0764-x. Epub 2017 Oct 11. Curr Genet. 2018. PMID: 29022131 Review.
Cited by
-
The Existence and Localization of Nuclear snoRNAs in Arabidopsis thaliana Revisited.Plants (Basel). 2020 Aug 12;9(8):1016. doi: 10.3390/plants9081016. Plants (Basel). 2020. PMID: 32806552 Free PMC article.
-
The AAA-ATPase MIDASIN 1 Functions in Ribosome Biogenesis and Is Essential for Embryo and Root Development.Plant Physiol. 2019 May;180(1):289-304. doi: 10.1104/pp.18.01225. Epub 2019 Feb 12. Plant Physiol. 2019. PMID: 30755475 Free PMC article.
-
Survey of Genes Involved in Biosynthesis, Transport, and Signaling of Phytohormones with Focus on Solanum lycopersicum.Bioinform Biol Insights. 2016 Sep 26;10:185-207. doi: 10.4137/BBI.S38425. eCollection 2016. Bioinform Biol Insights. 2016. PMID: 27695302 Free PMC article.
-
Arabidopsis NOTCHLESS plays an important role in root and embryo development.Plant Signal Behav. 2023 Dec 31;18(1):2245616. doi: 10.1080/15592324.2023.2245616. Plant Signal Behav. 2023. PMID: 37573563 Free PMC article.
-
Systematic Review of Plant Ribosome Heterogeneity and Specialization.Front Plant Sci. 2020 Jun 25;11:948. doi: 10.3389/fpls.2020.00948. eCollection 2020. Front Plant Sci. 2020. PMID: 32670337 Free PMC article.
References
-
- Dez C, Tollervey D. Ribosome synthesis meets the cell cycle. Curr Opin Microbiol. 2004;7:631–7. - PubMed
LinkOut - more resources
Full Text Sources
Molecular Biology Databases
