

Calibration of baroreflex equilibrium diagram based on exogenous pressor agents in chronic heart failure rats
- PMID: 25698884
- PMCID: PMC4319654
- DOI: 10.4137/CMC.S18759
Calibration of baroreflex equilibrium diagram based on exogenous pressor agents in chronic heart failure rats
Abstract
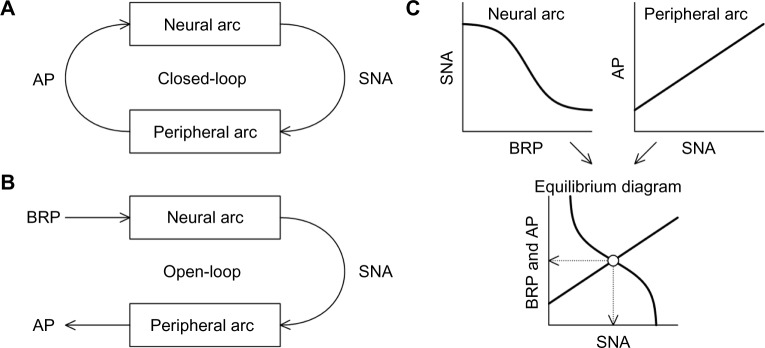
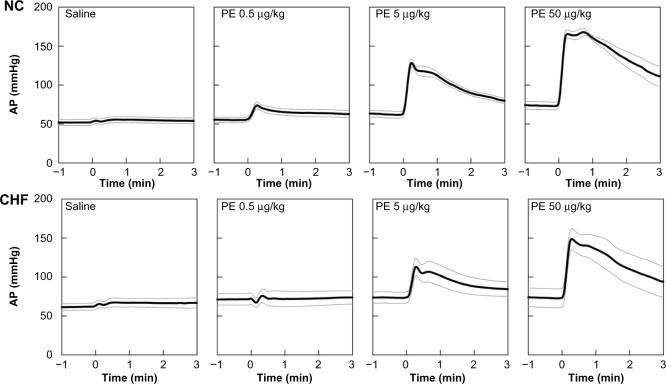
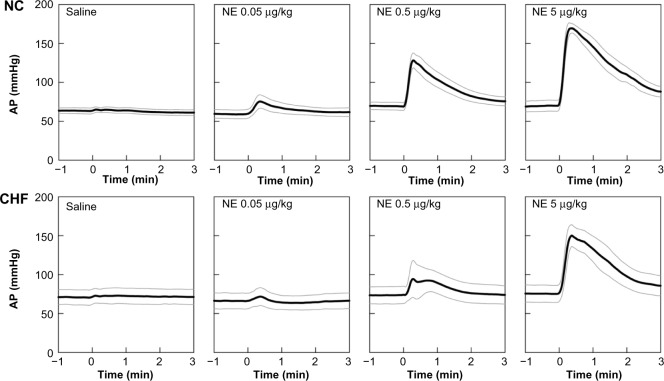
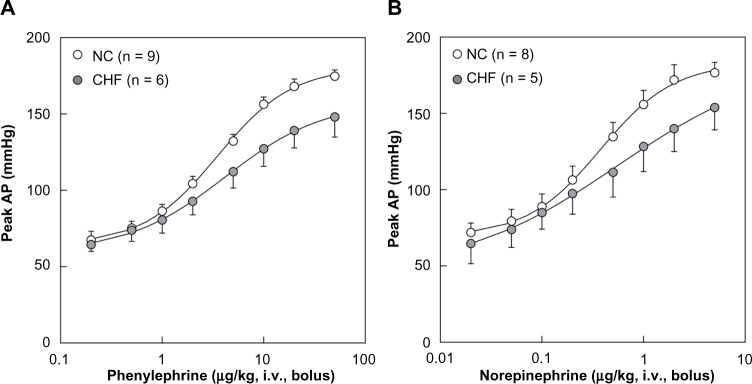
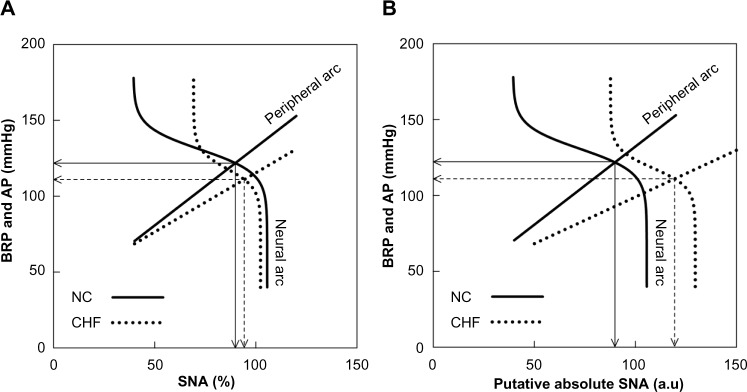
A baroreflex equilibrium diagram describes the relation between input pressure and sympathetic nerve activity (SNA) and that between SNA and arterial pressure (AP). To calibrate the SNA axis (abscissa) of the baroreflex equilibrium diagram, the AP response to intravenous bolus injections of phenylephrine (0.2-50 μg/kg) or norepinephrine (NE, 0.02-5 μg/kg) was examined in normal control rats (NC, n = 9) and rats with chronic heart failure (CHF, n = 6). The maximum slope of the dose-effect curve was significantly smaller in the CHF group than in the NC group (57.3 ± 5.2 vs 80.9 ± 6.3 mmHg/decade for phenylephrine, 60.2 ± 7.8 vs 80.4 ± 5.9 mmHg/decade for NE; P < 0.01). The CHF/NC ratio of the maximum slope was used to calibrate SNA. While the calibrated baroreflex equilibrium diagram showed increased maximum SNA and operating-point SNA in CHF rats compared with NC rats, the magnitude of increase was smaller than that expected from the excess plasma NE concentration in CHF rats. Plasma NE concentration in the CHF group could be disproportionally high relative to SNA.
Keywords: arterial pressure; carotid sinus baroreflex; norepinephrine; open-loop analysis; phenylephrine.
Figures
Similar articles
-
Acute arterial baroreflex-mediated changes in plasma catecholamine concentrations in a chronic rat model of myocardial infarction.Physiol Rep. 2016 Aug;4(15):e12880. doi: 10.14814/phy2.12880. Physiol Rep. 2016. PMID: 27495297 Free PMC article.
-
Acute Effects of Vagotomy on Baroreflex Equilibrium Diagram in Rats with Chronic Heart Failure.Clin Med Insights Cardiol. 2016 Aug 28;10:139-47. doi: 10.4137/CMC.S38443. eCollection 2016. Clin Med Insights Cardiol. 2016. PMID: 27594790 Free PMC article.
-
Acute effects of arterial baroreflex on sympathetic nerve activity and plasma norepinephrine concentration.Auton Neurosci. 2014 Dec;186:62-8. doi: 10.1016/j.autneu.2014.10.016. Auton Neurosci. 2014. PMID: 25458434
-
Central angiotensin modulation of baroreflex control of renal sympathetic nerve activity in the rat: influence of dietary sodium.Acta Physiol Scand. 2003 Mar;177(3):285-9. doi: 10.1046/j.1365-201X.2003.01074.x. Acta Physiol Scand. 2003. PMID: 12608998 Review.
-
The regulation of sympathetic outflow in heart failure. The roles of angiotensin II, nitric oxide, and exercise training.Ann N Y Acad Sci. 2001 Jun;940:431-43. Ann N Y Acad Sci. 2001. PMID: 11458699 Review.
Cited by
-
Acute arterial baroreflex-mediated changes in plasma catecholamine concentrations in a chronic rat model of myocardial infarction.Physiol Rep. 2016 Aug;4(15):e12880. doi: 10.14814/phy2.12880. Physiol Rep. 2016. PMID: 27495297 Free PMC article.
-
Acute Effects of Vagotomy on Baroreflex Equilibrium Diagram in Rats with Chronic Heart Failure.Clin Med Insights Cardiol. 2016 Aug 28;10:139-47. doi: 10.4137/CMC.S38443. eCollection 2016. Clin Med Insights Cardiol. 2016. PMID: 27594790 Free PMC article.
-
Open-loop static and dynamic characteristics of the arterial baroreflex system in rabbits and rats.J Physiol Sci. 2016 Jan;66(1):15-41. doi: 10.1007/s12576-015-0412-5. Epub 2015 Nov 5. J Physiol Sci. 2016. PMID: 26541155 Free PMC article. Review.
References
-
- Mohrman DE, Heller LJ. Cardiovascular Physiology. 6th ed. New York: McGraw Hill; 2006.
-
- Sato T, Kawada T, Inagaki M, et al. New analytic framework for understanding sympathetic baroreflex control of arterial pressure. Am J Physiol. 1999;276:H2251–61. - PubMed
-
- Shoukas AA, Callahan CA, Lash JM, Haase EB. New technique to completely isolate carotid sinus baroreceptor regions in rats. Am J Physiol. 1991;260:H300–3. - PubMed
-
- Sato T, Kawada T, Miyano H, et al. New simple methods for isolating baroreceptor regions of carotid sinus and aortic depressor nerves in rats. Am J Physiol. 1999;276:H326–32. - PubMed
LinkOut - more resources
Full Text Sources
Research Materials
