

Overweight is not associated with cortical thickness alterations in children
- PMID: 25698918
- PMCID: PMC4316697
- DOI: 10.3389/fnins.2015.00024
Overweight is not associated with cortical thickness alterations in children
Abstract
Introduction: Several studies report an association between body mass index (BMI) and cortical thickness in adults. Some studies demonstrate diffuse cortical thinning in obesity, while others report effects in areas that are associated with self-regulation, such as lateral prefrontal cortex.
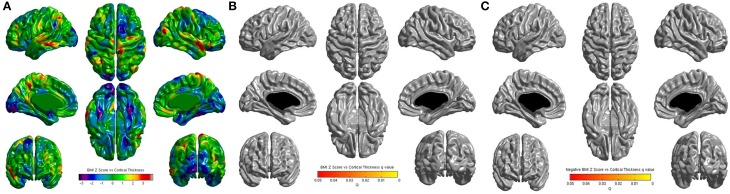
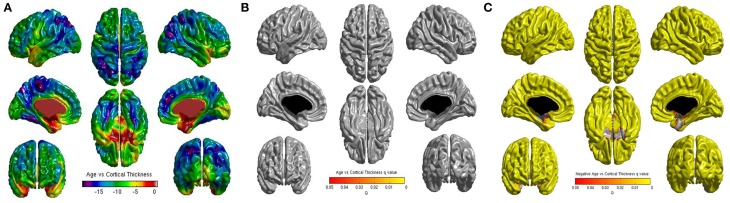
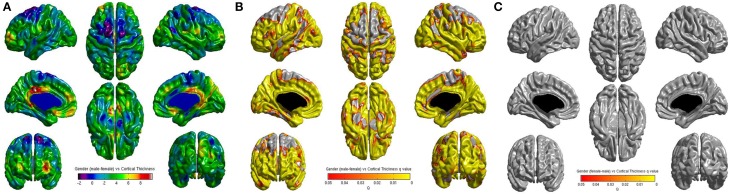
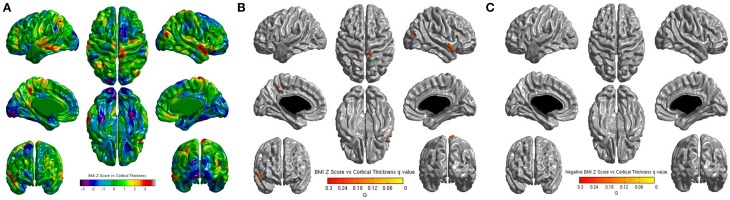
Methods: This study used multilevel modeling of data from the NIH Pediatric MRI Data Repository, a mixed longitudinal and cross-sectional database, to examine the relationship between cortical thickness and body weight in children. Cortical thickness was computed at 81,942 vertices of 716 MRI scans from 378 children aged between 4 and 18 years. Body mass index Z score for age was computed for each participant. We performed vertex-wise statistical analysis of the relationship between cortical thickness and BMI, accounting for age and gender. In addition, cortical thickness was extracted from regions of interest in prefrontal cortex and insula.
Results: No significant association between cortical thickness and BMI was found, either by statistical parametric mapping or by region of interest analysis. RESULTS remained negative when the analysis was restricted to children aged 12-18.
Conclusions: The correlation between BMI and cortical thickness was not found in this large pediatric sample. The association between BMI and cortical thinning develops after adolescence. This has implications for the nature of the relationship between brain anatomy and weight gain.
Keywords: MRI; adolescence; body mass index; childhood; cortical development; cortical thickness; gray matter; obesity.
Figures
Similar articles
-
Associations Among Body Mass Index, Cortical Thickness, and Executive Function in Children.JAMA Pediatr. 2020 Feb 1;174(2):170-177. doi: 10.1001/jamapediatrics.2019.4708. JAMA Pediatr. 2020. PMID: 31816020 Free PMC article.
-
Increased body mass index is associated with specific regional alterations in brain structure.Int J Obes (Lond). 2016 Jul;40(7):1177-82. doi: 10.1038/ijo.2016.42. Epub 2016 Mar 22. Int J Obes (Lond). 2016. PMID: 27089992 Free PMC article.
-
Childhood Obesity, Cortical Structure, and Executive Function in Healthy Children.Cereb Cortex. 2020 Apr 14;30(4):2519-2528. doi: 10.1093/cercor/bhz257. Cereb Cortex. 2020. PMID: 31646343 Free PMC article.
-
[Simple obesity in children. A study on the role of nutritional factors].Med Wieku Rozwoj. 2006 Jan-Mar;10(1):3-191. Med Wieku Rozwoj. 2006. PMID: 16733288 Review. Polish.
-
Offspring body size and metabolic profile - effects of lifestyle intervention in obese pregnant women.Dan Med J. 2014 Jul;61(7):B4893. Dan Med J. 2014. PMID: 25123127 Review.
Cited by
-
Associations among body mass index, working memory performance, gray matter volume, and brain activation in healthy children.Cereb Cortex. 2023 May 9;33(10):6335-6344. doi: 10.1093/cercor/bhac507. Cereb Cortex. 2023. PMID: 36573454 Free PMC article.
-
Butyrate ameliorates quinolinic acid-induced cognitive decline in obesity models.J Clin Invest. 2023 Feb 15;133(4):e154612. doi: 10.1172/JCI154612. J Clin Invest. 2023. PMID: 36787221 Free PMC article.
-
Association of Body Mass Index and Waist Circumference With Imaging Metrics of Brain Integrity and Functional Connectivity in Children Aged 9 to 10 Years in the US, 2016-2018.JAMA Netw Open. 2023 May 1;6(5):e2314193. doi: 10.1001/jamanetworkopen.2023.14193. JAMA Netw Open. 2023. PMID: 37200030 Free PMC article.
-
Association Between Genetic Risks for Obesity and Working Memory in Children.Front Neurosci. 2021 Sep 22;15:749230. doi: 10.3389/fnins.2021.749230. eCollection 2021. Front Neurosci. 2021. PMID: 34630031 Free PMC article.
-
Altered Regional Gray Matter Volume in Obese Men: A Structural MRI Study.Front Psychol. 2017 Jan 31;8:125. doi: 10.3389/fpsyg.2017.00125. eCollection 2017. Front Psychol. 2017. PMID: 28197123 Free PMC article.
References
-
- Ad-Dab'bagh Y., Einarson D., Lyttelton O., Muehlboeck J.-S., Mok K., Ivanov O., et al. (2006). The CIVET image-processing environment: a fully automated comprehensive pipeline for anatomical neuroimaging research, in Proceedings of the 12th Annual Meeting of the Organization for Human Brain Mapping, ed Corbetta M. (Florence: ).
LinkOut - more resources
Full Text Sources
Other Literature Sources