. 2015 Feb 2:8:468.
doi: 10.3389/fncel.2014.00468. eCollection 2014.

Pannexin2 oligomers localize in the membranes of endosomal vesicles in mammalian cells while Pannexin1 channels traffic to the plasma membrane

Affiliations

Pannexin2 oligomers localize in the membranes of endosomal vesicles in mammalian cells while Pannexin1 channels traffic to the plasma membrane

Daniela Boassa et al. Front Cell Neurosci. .

Abstract

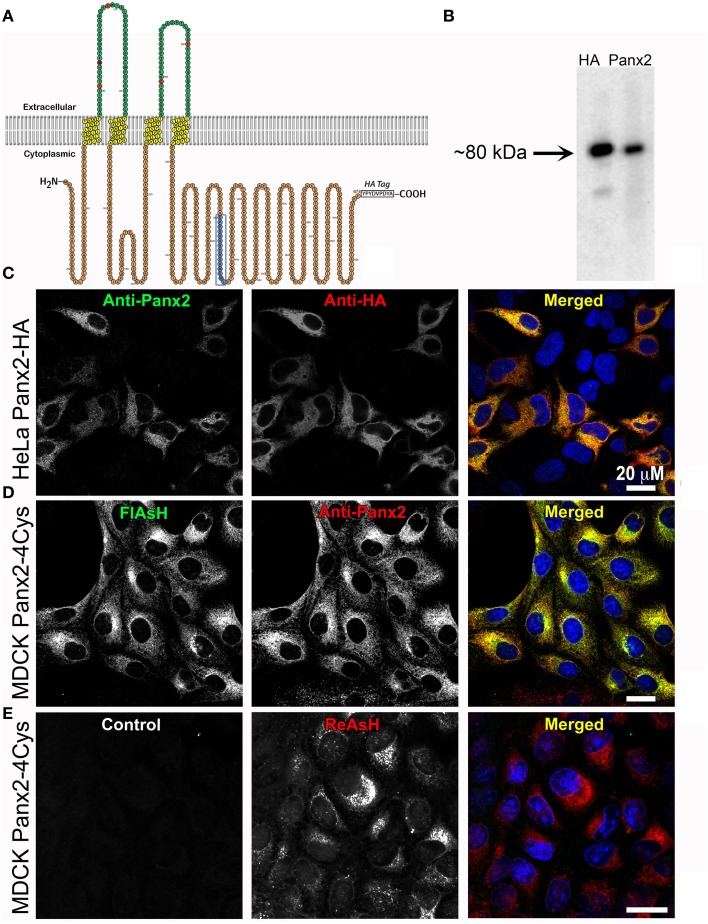
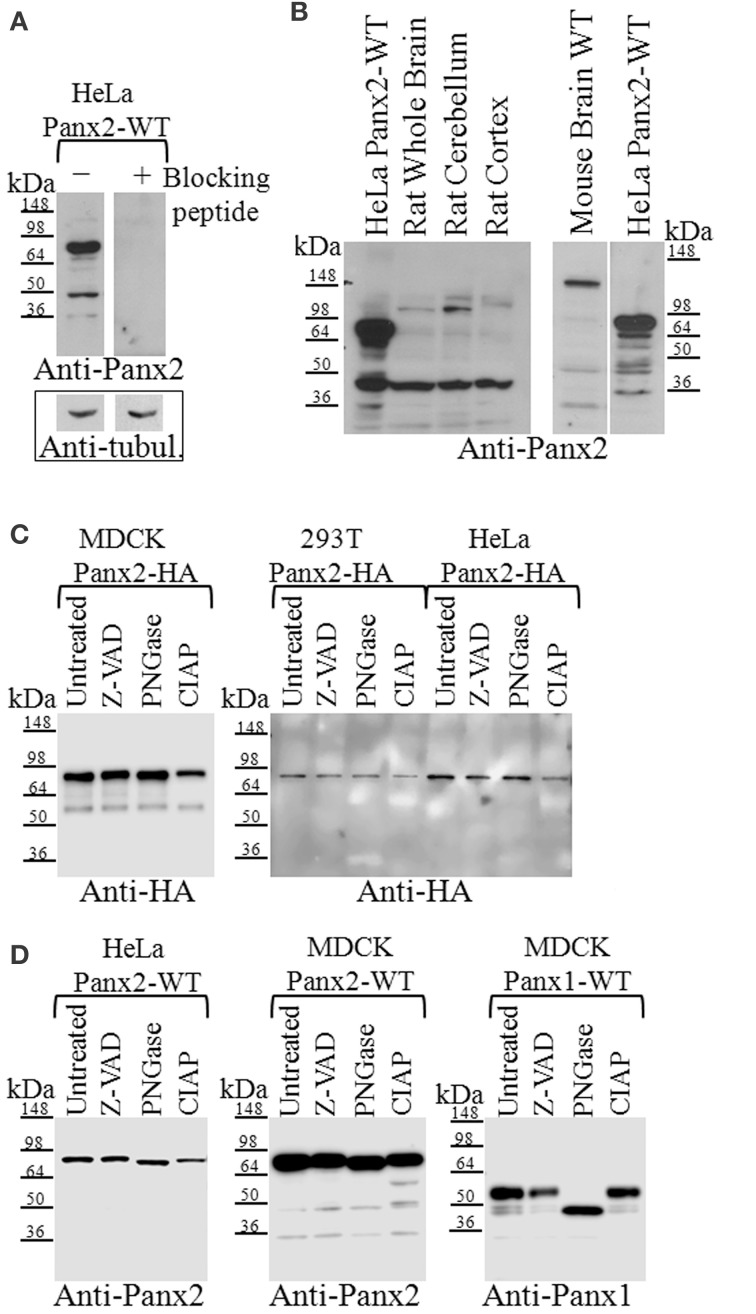
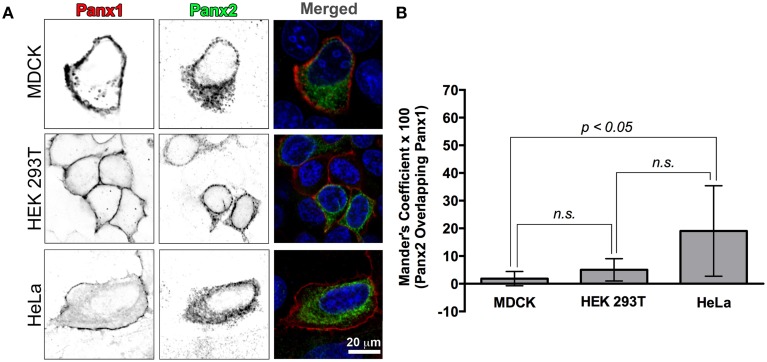
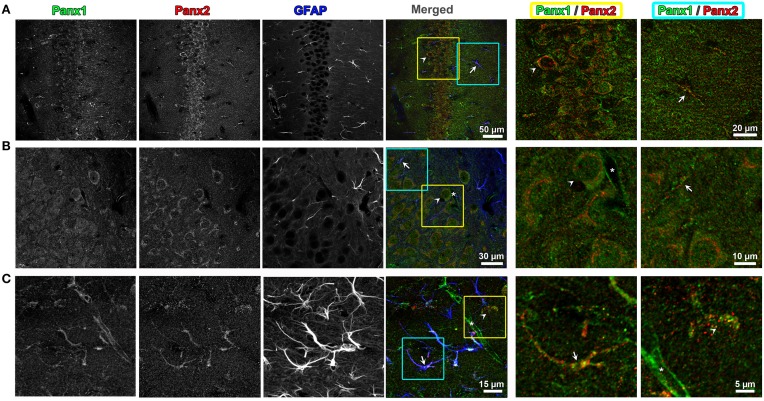
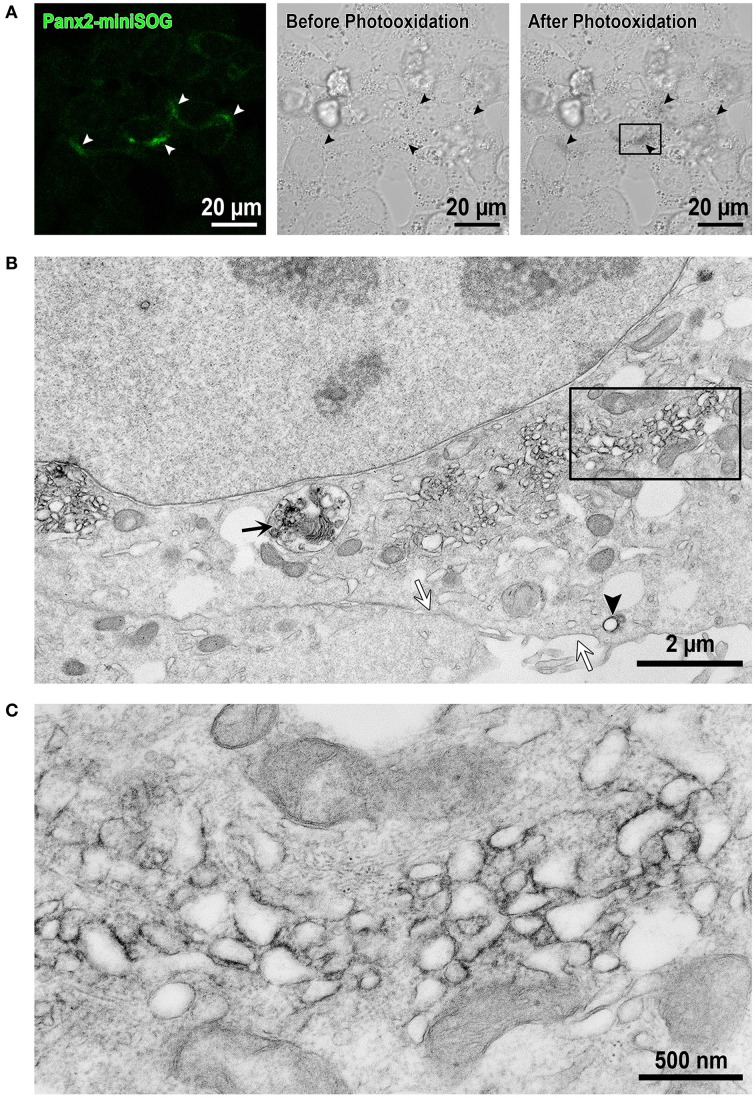
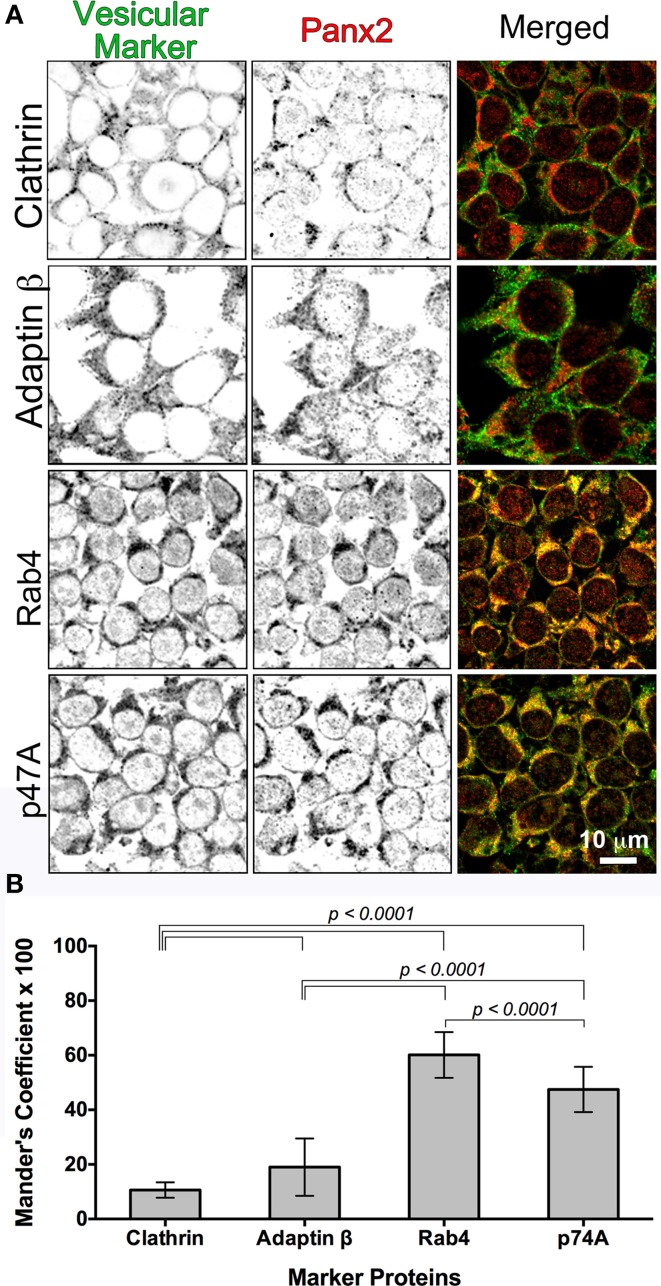
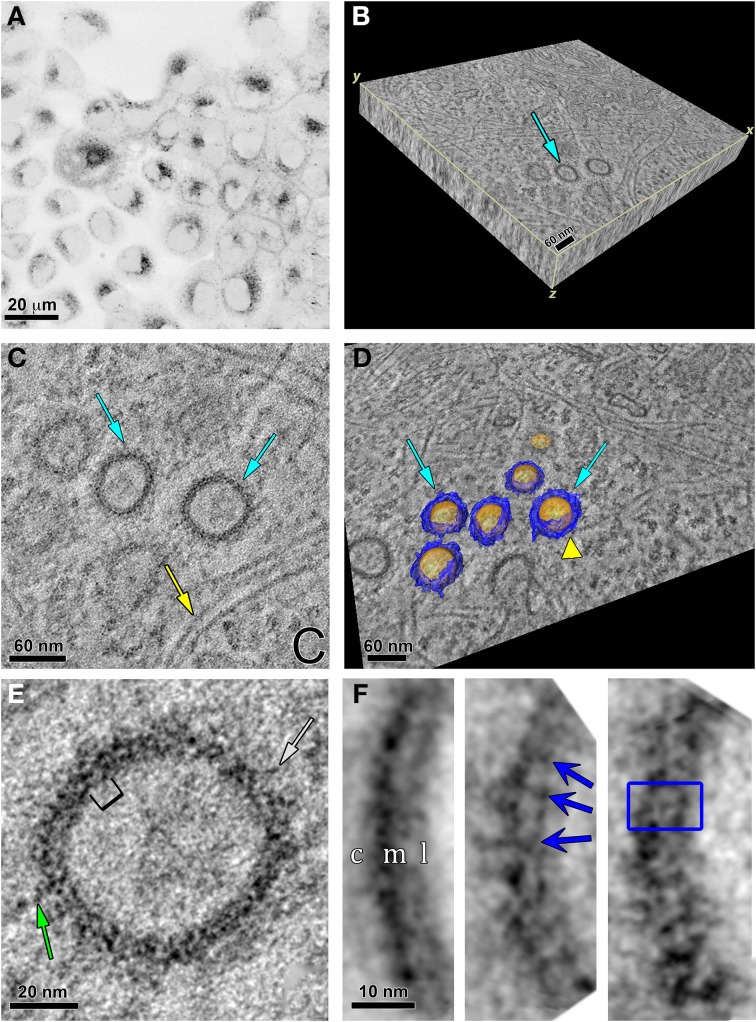
Pannexin2 (Panx2) is the largest of three members of the pannexin proteins. Pannexins are topologically related to connexins and innexins, but serve different functional roles than forming gap junctions. We previously showed that pannexins form oligomeric channels but unlike connexins and innexins, they form only single membrane channels. High levels of Panx2 mRNA and protein in the Central Nervous System (CNS) have been documented. Whereas Pannexin1 (Panx1) is fairly ubiquitous and Pannexin3 (Panx3) is found in skin and connective tissue, both are fully glycosylated, traffic to the plasma membrane and have functions correlated with extracellular ATP release. Here, we describe trafficking and subcellular localizations of exogenous Panx2 and Panx1 protein expression in MDCK, HeLa, and HEK 293T cells as well as endogenous Panx1 and Panx2 patterns in the CNS. Panx2 was found in intracellular localizations, was partially N-glycosylated, and localizations were non-overlapping with Panx1. Confocal images of hippocampal sections immunolabeled for the astrocytic protein GFAP, Panx1 and Panx2 demonstrated that the two isoforms, Panx1 and Panx2, localized at different subcellular compartments in both astrocytes and neurons. Using recombinant fusions of Panx2 with appended genetic tags developed for correlated light and electron microscopy and then expressed in different cell lines, we determined that Panx2 is localized in the membrane of intracellular vesicles and not in the endoplasmic reticulum as initially indicated by calnexin colocalization experiments. Dual immunofluorescence imaging with protein markers for specific vesicle compartments showed that Panx2 vesicles are early endosomal in origin. In electron tomographic volumes, cross-sections of these vesicles displayed fine structural details and close proximity to actin filaments. Thus, pannexins expressed at different subcellular compartments likely exert distinct functional roles, particularly in the nervous system.

Keywords: ATP signaling; connexin; correlated light and electron microscopy; electron tomography; intercellular communication; miniSOG; pannexin channels; tetracysteine tag.


Figures

Figure 1
Figure 1
Exogenous Panx2 is localized intracellularly in stable expressing cell lines. (A) Schematic of the membrane topology of a Panx2 monomer. The Panx2 peptide sequence used to generate the carboxy terminal antibody used in this study is indicated in blue as well as an appended HA tag. (B) Western blot of a cell lysate from HeLa cells stably expressing Panx2-HA. Both the anti-Panx2 (polyclonal) and anti-HA (monoclonal) antibodies detect a ~80-kDa band corresponding to the molecular mass of Panx2-HA. (C–E) Images are single plane confocal micrographs. (C) In this HeLa cell line, immunofluorescence demonstrates almost complete overlap of anti-Panx2 (left image) and anti-HA antibodies (middle image). Anti-Panx2 is displayed in green, anti-HA in red and DAPI is blue in the merged images for (C) (right column). (D) MDCK cells stably expressing Panx2-4Cys stained with FlAsH (green) and the anti-Panx2 antibody (red) also show almost complete overlap of the two fluorescent signals. (E) In this panel, no primary antibody was used in the initial incubations (control, left image), while ReAsH staining (red) confirmed the presence of Panx2-4Cys (middle image).
Figure 2
Figure 2
Western blot analysis of Panx2 in tissue and post-translational modifications in tissue culture cells. (A) Incubation of the Panx2 antibody with the immunizing peptide prior to western blotting eliminated the labeling of untagged Panx2-WT proteins stably expressed in HeLa cells. Western blots for alpha-tubulin levels shown below the Panx2 immunoblots served as loading controls for these lysates. (B) The expected mass of Panx2 monomers based on their amino acid sequence is ~74 kDa and western blot analysis of HeLa cell lysates stably expressing untagged rat Panx2 showed a major band at about this molecular mass (left and right hand lanes). Some lower bands were also observed at about 45 kDa. In tissue lysates from rat and mouse brains, a weaker ~74 kDa band was observed as well as few faster migrating bands that may represent caspase cleaved Panx2 species. (C) Cell lysates from three cell lines, MDCK, HEK 293T, and HeLa, each stably expressing HA-tagged Panx2, were treated with either Z-VAD-OMe-FMK (Z-VAD) to inhibit caspase-dependent cleavage, PNGase to reduce glycosylation, or CIAP for protein dephosphorylation. We did not see any significant shift in the bands indicating that at least in these cell types, HA-tagged Panx2 is not highly phosphorylated or glycosylated. (D) However, cell lysates from HeLa, and MDCK, each stably expressing untagged Panx2-WT revealed a slight shift in banding pattern following PNGase treatment. As positive control, lysates from MDCK cells stably expressing untagged Panx1-WT showed significant band shifts after PNGase treatment. Western blots shown here are representative of at least three independent experiments per group.
Figure 3
Figure 3
Recombinant Panx1 and Panx2 have non-overlapping cellular distributions in various cell lines. (A) MDCK, HEK 293T, and HeLa cells were co-transfected with wild type untagged Panx1 and Panx2. Images are single confocal slices. In the single channel confocal images (left and middle columns), the color table has been inverted for better visualization of the individual fluorescence channels and in particular, vesicle populations. Panx1 was labeled with a mouse monoclonal antibody (Cy5 secondary antibody detection, shown in red in the merged image) while our polyclonal C-terminal Panx2 antibody was used to stain Panx2 (FITC secondary detection, shown in green in the merged image). In all three cell types, Panx1 was found mostly in the plasma membrane (left column, red color in the “Merged” images in the right hand column) while Panx2 remained in intracellular locations (middle column, green color in the Merged images in the right hand column). In the right hand column images (“Merged”), the nuclei are stained with DAPI (blue). We calculated a Manders' colocalization coefficient in order to quantify the degree of overlap of Panx1 and Panx2 in these cell lines. The graph of average percent overlap (as indicated by the Manders' coefficient × 100) shown in (B) demonstrates that there is very little overlap (20% and below) between Panx1 and Panx2 in these three cell types with significantly higher overlap in HeLa cells. The numbers of images analyzed were 8, 7, and 11 for HEK 293T cells, HeLa cells and MDCK cells, respectively. Error bars indicate standard deviations. (n.s., not significant).
Figure 4
Figure 4
Endogenous Panx1 and Panx2 show non-overlapping signals in hippocampal neurons and astrocytes. Confocal images of the CA1 field of the hippocampus in the adult mouse brain are shown in (A–C). Images in (A,B) are single confocal planes while (C) represents maximum intensity projections of confocal image stacks to better show the astrocyte morphology. The tissue has been immunolabeled for Panx1 (left black and white image column), Panx2 (middle black and white image column) and the astrocytic marker, GFAP (right black and white image column). In the color image column labeled “Merged” (middle column of figure), the three black and white images were superimposed with the Panx1, Panx2, and GFAP labelings displayed in green, red and blue, respectively. Three-fold enlargements of two areas highlighted by yellow and cyan boxes in each of these merged images are displayed in the two far right columns (cyan = far right column, yellow = column left of right hand column). These enlargements only display the Panx1 (green) and Panx2 (red) signal to better show the cellular segregation of Panx1 and Panx2 in CA1 pyramidal cells and astrocytes. Example astrocytes are indicated by arrows, neurons by arrowheads and capillaries by an asterisk. Note that in astrocytes and neurons there is little overlap in populations of Panx1 and Panx2. Also, the capillaries contain Panx1, but not Panx2.
Figure 5
Figure 5
EM imaging reveals intracellular localizations of Panx2-miniSOG in membrane bound structures. (A) Confocal image from Panx2-miniSOG transiently expressed in HeLa cells (left image, white arrowheads point to miniSOG fluorescence). DIC images of the same area before (middle image) and after photooxidation (right image) with black arrowheads highlighting the same areas as in the fluorescence image. (B) Displayed is a low magnification EM thin section (corresponding to the boxed area in the right hand post-photooxidation DIC image in A). The black arrow points to a Panx2-miniSOG containing lysosome while the black arrowhead indicates a stained Panx2-miniSOG vesicle. Note that the plasma membrane is unstained (white arrows) and thus, contains no Panx2-miniSOG channels. (C) A higher four-fold magnification view of the boxed area in (B) revealed Panx2-miniSOG in intracellular tubulo-vesicular membranous compartments and minimal ER localizations.
Figure 6
Figure 6
Colocalization of Panx2 with cellular markers indicates early endosomal sorting. In (A), untagged WT Panx2 (red) and four organellar markers (green) were co-immunolabeled with the polyclonal anti-C terminal Panx2 antibody and a monoclonal antibody specific to each organellar proteins. The four protein markers, Clathrin, Adaptin β, Rab4 and p47A label clathrin-coated vesicles, early/recycling endosomes, early endosomes, and degradation vesicles derived from the Golgi, respectively. Both the single plane confocal images (A) and the Percent Colocalization (Manders' Coefficient × 100) graph in (B) indicated that Panx2 overlaps with early endosomes. Sample sizes for Manders' Coefficient calculation: 107 (clathrin), 119 (rab4), 131 (adaptin β) and 144 (p47A) cells. The errors bars indicate standard deviations.
Figure 7
Figure 7
Specific labeling of Panx2-4Cys and electron tomography highlight Panx2 distribution in the membrane of intracellular vesicles. (A) MDCK cells stably expressing Panx2-4Cys were stained with ReAsH-EDT2, fixed and imaged with a confocal microscope before photooxidation. The image is displayed with an inverted color table (black is the highest fluorescence signal, white is no signal). (B) 3D representation of the EM tomographic volume as a 3D slab. Cyan arrow points to vesicles containing Panx2-4Cys oligomers. (C) Single X-Y slice from the tomogram showing Panx2-4Cys labeling in vesicle cross-sections (cyan arrows). Note the actin filaments in close proximity to the Panx2-4Cys-labeled vesicles (yellow arrow). (D) Automated segmentation of Panx2 vesicles (cyan arrows): yellow represents the lipid bilayer of the vesicle, while blue highlights the large domains of the Panx2 oligomers protruding from the vesicle membrane into the cytoplasm. The yellow colored arrowhead indicates an actin filament in close apposition to a vesicle. Based on comparisons with connexin channels, these protrusions most likely are from the large cytoplasmic domains of Panx2-4Cys. (E) Single slice of the tomogram showing a subarea of a Panx2-4Cys containing vesicle. Here stain-excluding areas (protein and lipid) are white and stain is black. The green arrows point to stained fine protrusions from the cytoplasmic surface of the vesicles. The bracket indicates an area bounded by stain that is ~8 nm. By analogy with connexin hemichannels, this distance should correspond to approximately the diameter through the membrane bound portion of Panx2 channels. (F) Three representative class averages obtained by single particle analysis of boxed cross-sectional areas. In the left hand average, c, cytosolic side; m, membrane; l, lumen of vesicle. Note the thicker cytosolic staining due to the deposition of DAB/osmium to the side containing the 4Cys/ReAsH tag. The blue arrows in the middle average and box in right hand average highlight substructure defined by stain from the Panx2 pore within the membrane bound portion (right hand average: inside box dimensions = ~8 × 10 nm).

Similar articles

Cited by

References

    1. Ambrosi C., Gassmann O., Pranskevich J. N., Boassa D., Smock A., Wang J., et al. . (2010). Pannexin1 and Pannexin2 channels show quaternary similarities to connexons and different oligomerization numbers from each other. J. Biol. Chem. 285, 24420–24431. 10.1074/jbc.M110.115444 - DOI - PMC - PubMed
    1. Baranova A., Ivanov D., Petrash N., Pestova A., Skoblov M., Kelmanson I., et al. . (2004). The mammalian pannexin family is homologous to the invertebrate innexin gap junction proteins. Genomics 83, 706–716. 10.1016/j.ygeno.2003.09.025 - DOI - PubMed
    1. Bargiotas P., Krenz A., Hormuzdi S. G., Ridder D. A., Herb A., Barakat W., et al. . (2011). Pannexins in ischemia-induced neurodegeneration. Proc. Natl. Acad. Sci. U.S.A. 108, 20772–20777. 10.1073/pnas.1018262108 - DOI - PMC - PubMed
    1. Boassa D., Ambrosi C., Qiu F., Dahl G., Gaietta G., Sosinsky G. (2007). Pannexin1 channels contain a glycosylation site that targets the hexamer to the plasma membrane. J. Biol. Chem. 282, 31733–31743. 10.1074/jbc.M702422200 - DOI - PubMed
    1. Boassa D., Berlanga M. L., Yang M. A., Terada M., Hu J., Bushong E. A., et al. . (2013). Mapping the subcellular distribution of alpha-synuclein in neurons using genetically encoded probes for correlated light and electron microscopy: implications for Parkinson's disease pathogenesis. J. Neurosci. 33, 2605–2615. 10.1523/JNEUROSCI.2898-12.2013 - DOI - PMC - PubMed