. 2015 Jan 20;5(4):345-56.
doi: 10.7150/thno.10731. eCollection 2015.

Combined cancer photothermal-chemotherapy based on doxorubicin/gold nanorod-loaded polymersomes

Affiliations

Combined cancer photothermal-chemotherapy based on doxorubicin/gold nanorod-loaded polymersomes

JinFeng Liao et al. Theranostics. .

Abstract

Gold nanorods (GNRs) are well known in photothermal therapy based on near-infrared (NIR) laser absorption of the longitudinal plasmon band. Herein, we developed an effective stimulus system -- GNRs and doxorubicin co-loaded polymersomes (P-GNRs-DOX) -- to facilitate co-therapy of photothermal and chemotherapy. DOX can be triggered to release once the polymersomes are corrupted under local hyperthermic condition of GNRs induced by NIR laser irradiation. Also, the cytotoxicity of GNRs caused by the residual cetyltrimethylacmmonium bromide (CTAB) was reduced by shielding the polymersomes. The GNRs-loaded polymersomes (P-GNRs) can be efficiently taken up by the tumor cells. The distribution of the nanomaterial was imaged by IR-820 and quantitatively analyzed by ICP-AES. We studied the ablation of tumor cells in vitro and in vivo, and found that co-therapy offers significantly improved therapeutic efficacy (tumors were eliminated without regrowth.) compared with chemotherapy or photothermal therapy alone. By TUNEL immunofluorescent staining of tumors after NIR laser irradiation, we found that the co-therapy showed more apoptotic tumor cells than the other groups. Furthermore, the toxicity study by pathologic examination of the heart tissues demonstrated a lower systematic toxicity of P-GNRs-DOX than free DOX. Thus, the chemo-photothermal treatment based on polymersomes loaded with DOX and GNRs is a useful strategy for maximizing the therapeutic efficacy and minimizing the dosage-related side effects in the treatment of solid tumors.

Keywords: NIR; chemotherapy.; gold nanorod; photothermal therapy; polymersomes.


Conflict of interest statement

Competing Interests: The authors have declared that no competing interest exists.

Figures

Figure 1
Figure 1
Schematic illustration of the preparation P-GNRs-DOX and the collapse of polymersomes after 808 nm laser irradiation. The co-therapy of photothermal and chemotherapy lead the tumor cells to dead or apoptosis.
Figure 2
Figure 2
TEM images of A) polymersomes, B) the magnification of the polymersomes, C) P-GNRs (Inset: GNRs). The scale bar is 100 nm.
Figure 3
Figure 3
A) CLSM image of Nile red encapsulated the membrane of polymersomes, B) Fluorescence intensity across the Nile red-labeled polymersome.
Figure 4
Figure 4
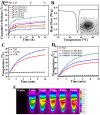
A) UV-vis absorption spectra of polymersomes, GNRs and P-GNRs. B) The particle size distribution spectrum of P-GNRs-DOX (black line: prior to lyophilization; red line: after lyophilization). Inset: a) Photographs of lyophilized P-GNRs-DOX with different lyoprotectants (1. sucrose; 2. glucose; 3. mannitol; 4. glycine). b) The redispersion of P-GNRs-DOX with sucrose (5. P-GNRs-DOX; 6. lyophilized P-GNRs-DOX with sucrose; 7. redispersion of P-GNRs-DOX with sucrose). C) Measured UV-vis extinction spectra of P-GNRs before and after laser irradiation.
Figure 5
Figure 5
A) DOX-release profiles in the presence and absence of NIR laser under different pH conditions. B) DSC curve of mPEG-PCL. Inset: TEM of P-GNRs-DOX after NIR laser irradiation (scale bar = 50 nm). C) Heating curves of pure water, P-GNRs-DOX and GNRs (14 μg Au mL-1). D) Different concentrations of P-GNRs-DOX (0.5 mg mL-1, P-GNRs-DOX contained 14 μg Au mL-1) under NIR laser irradiation (power density = 2.5 W cm-2). E) Infrared thermal imaging of P-GNRs-DOX (1.0 mg mL-1, contained 28 μg Au mL-1 ) under 2.5 W cm-2 irradiation by 808 nm laser a t different time.
Figure 6
Figure 6
Selected bio-TEM images of A, B) P-GNRs and C, D) GNRs uptake by C26 tumor cells. Fluorescent microscopic images of C26 tumor cells after incubated with P-GNRs-DOX for 2 h: E) red fluorescence shows the location of DOX, F) blue fluorescence shows the nuclei stained with DAPI and G) merge; Images were acquired at 400× magnification.
Figure 7
Figure 7
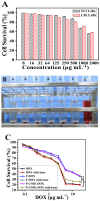
A) Relative viabilities of 3T3 and C26 cells after being incubated with various concentrations of P-GNRs for 24 h. B) Hemolytic test on the P-GNRs. The concentration was a) 1.0 mg mL-1, b) 1.5 mg mL-1, c) 3.0 mg mL-1, d) 6.0 mg mL-1, e) 12.0 mg mL-1; sample f was normal saline used as negative control, and sample g was distilled water used as positive control. C) Relative viabilities of C26 tumor cells either not exposed to NIR light or irradiated with NIR light (2.5 W cm-2 for 5 min per treatment, three treatments over 2 h). Data are represented as mean±SE of six wells per group. *P<0.05 by two-sample student's t-test.
Figure 8
Figure 8
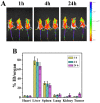
A) NIR fluorescence images of P-GNRs-820 treated mice were obtained 1 h, 4 h, and 24 h after injection. The arrows indicate tumor sites. B) Biodistribution of P-GNRs in mice at 1 h, 4 h, 24 h after injection determined by ICP-AES measured of Au concentrations. Error bars were based on standard deviations (SD) of three mice per group.
Figure 9
Figure 9
Infrared thermal imaging of tumor under the photothermal heating by 808 nm laser irradiation at A) 0 min, B) 1 min, C) 2 min, D) 3 min, E) 4 min, F) 5 min in NS and P-GNRs-DOX injected mice under 2.5 W cm-2 irradiation.
Figure 10
Figure 10
A) Tumor growth curves, B) Body weight of mice and C) Survival curves of mice bearing C26 tumors after various treatments as indicated. Data are represented as mean±SE of ten mice per group. *P<0.05 by two-sample student's t-test. D) Representative photos of mice bearing C26 tumors after a) NS treatment, b) NS+laser treatment, c) P-GNRs+laser treatment and d) P-GNRs-DOX+laser treatment for 0, 2 and 14 days.
Figure 11
Figure 11
H&E stained images of heart. Representative H&E stained images of NS (A), NS+laser (B), free DOX for 1 time (C), free DOX for 4 times (D), P-DOX (E), P-GNRs (F),P-GNRs+laser (G), and P-GNRs-DOX+laser (H). Images were acquired at 400× magnification.
Figure 12
Figure 12
TUNEL immunofluorescent staining of tumors after NIR laser irradiation. Representative TUNEL immunofluorescent images and mean apoptotic index of A) NS, B) NS+laser, C) free DOX for 1 time, D) free DOX for 4 times, E) P-DOX, F) P-GNRs, G) P-GNRs+laser, and H) P-GNRs-DOX+laser. *P<0.01 by two-sample student's t-test. Images were acquired at 400× magnification.

Similar articles

Cited by

References

    1. Choi W, Kim JY, Kang C. et al. Tumor regression in vivo by photothermal therapy based on gold-nanorod-loaded, functional nanocarriers. ACS Nano. 2011;5:1995–2003. - PubMed
    1. Cole JR, Mirin NA, Knight MW. et al. Photothermal efficiencies of nanoshells and nanorods for clinical therapeutic applications. J Phys Chem C. 2009;113:12090–4.
    1. Helmchen F, Denk W. Deep tissue two-photon micro-scopy. Nat Methods. 2005;2:932–40. - PubMed
    1. Dreaden EC, Mackey MA, Huang X. et al. Beating cancer in miltiple ways using nanogold. Chem Soc Rev. 2011;40:3391–404. - PMC - PubMed
    1. Nakamura T, Tamura A, Murotani H. et al. Large payloads of gold nanoparticles into the polyamine network core of stimuli-responsive PEGylayted nanogels for selective and noninvasive cancer photothermal therapy. Nanoscale. 2010;2:739–46. - PubMed

Publication types

MeSH terms