. 2014:2:1800512.
doi: 10.1109/JTEHM.2014.2303806.

Quantitative Assessment of Single-Image Super-Resolution in Myocardial Scar Imaging

Affiliations

Quantitative Assessment of Single-Image Super-Resolution in Myocardial Scar Imaging

Hiroshi Ashikaga et al. IEEE J Transl Eng Health Med. 2014.

Abstract

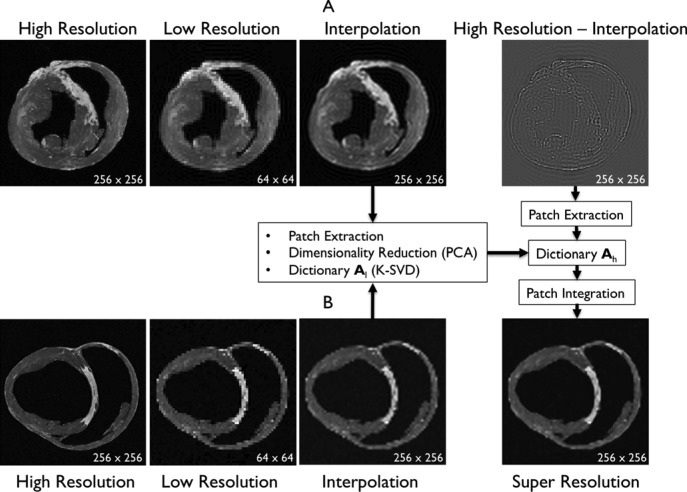
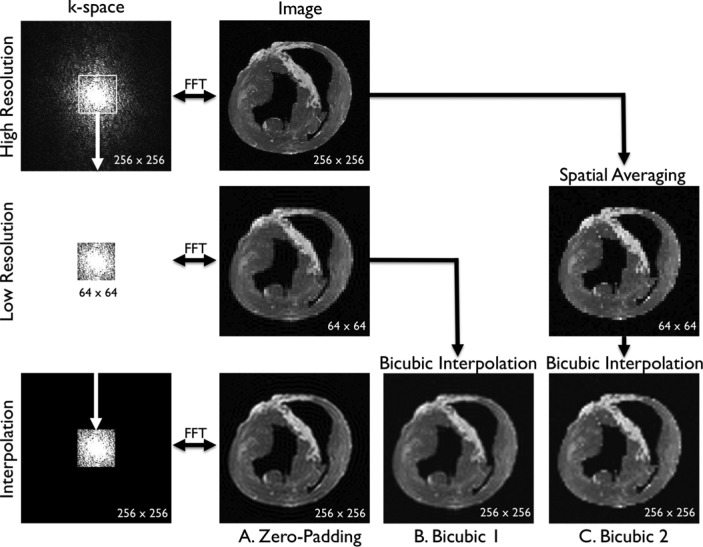
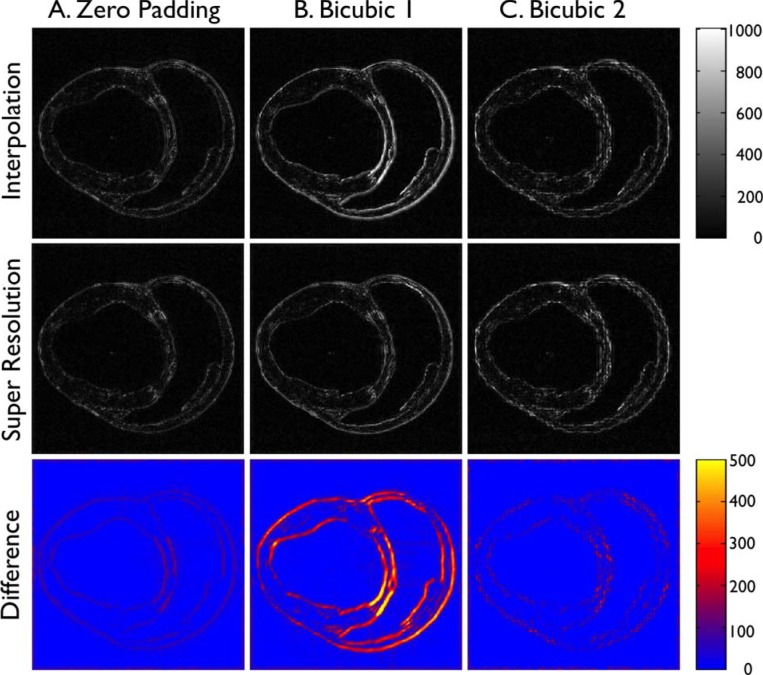
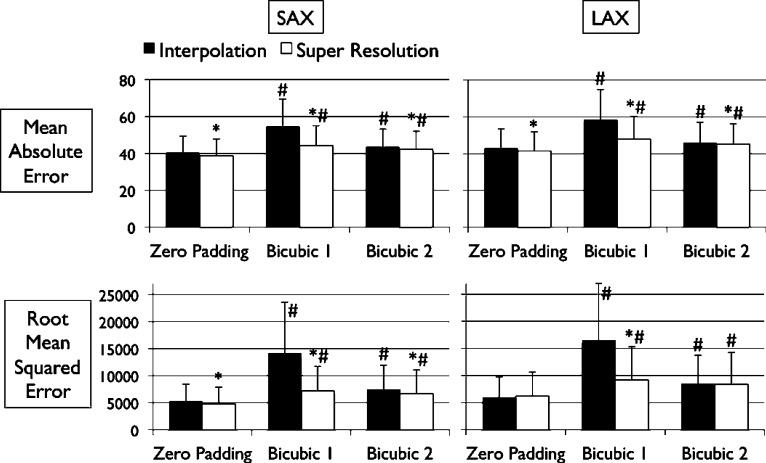
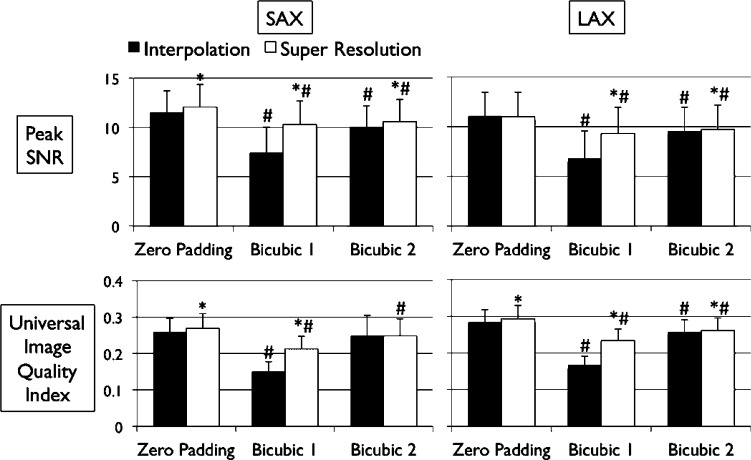
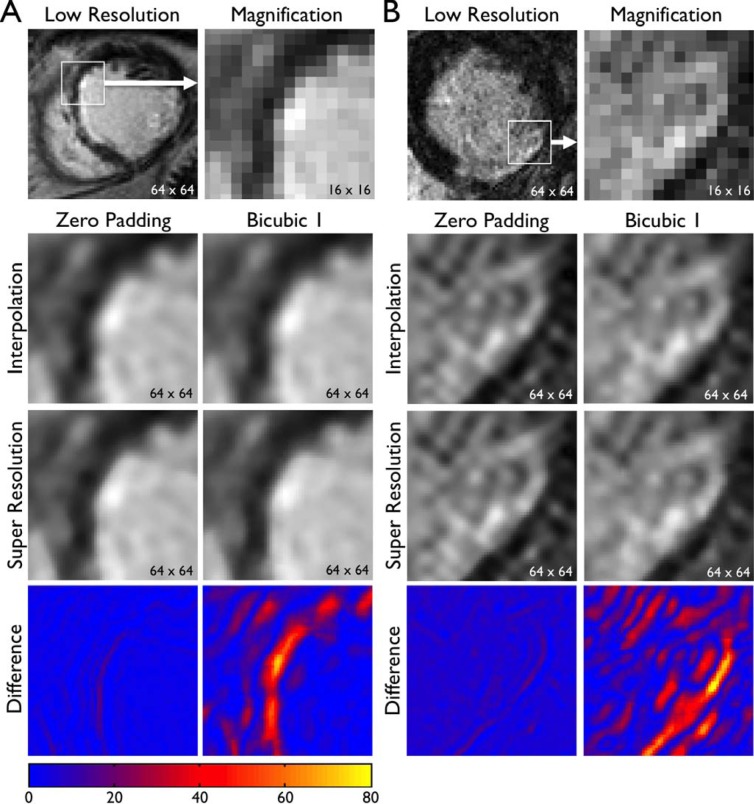
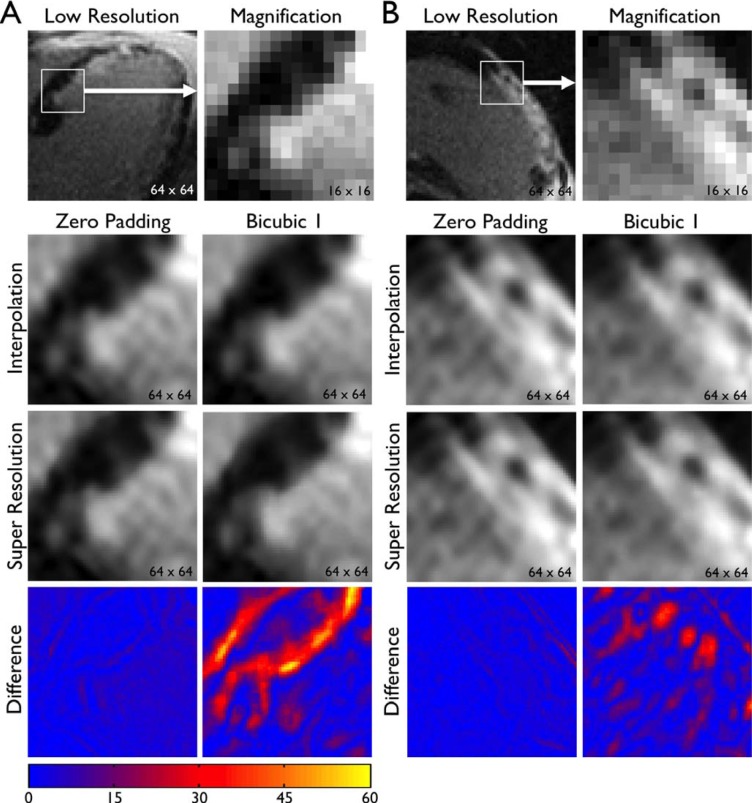
Single-image super resolution is a process of obtaining a high-resolution image from a set of low-resolution observations by signal processing. While super resolution has been demonstrated to improve image quality in scaled down images in the image domain, its effects on the Fourier-based image acquisition technique, such as MRI, remains unknown.We performed high-resolution ex vivo late gadolinium enhancement (LGE) magnetic resonance imaging (0.4 × 0.4 × 0.4 mm3) in postinfarction swine hearts (n = 24). The swine hearts were divided into the training set (n = 14) and the test set (n = 10), and in all hearts, low-resolution images were simulated from the high-resolution images. In the training set, super-resolution dictionaries with pairs of small matching patches of the high- and low-resolution images were created. In the test set, super resolution recovered high-resolution images from low-resolution images using the dictionaries. The same algorithm was also applied to patient LGE (n = 4) to assess its effects. Compared with interpolated images, super resolution significantly improved basic image quality indices (P < 0.001). Super resolution using Fourier-based zero padding achieved the best image quality. However, the magnitude of improvement was small in images with zero padding. Super resolution substantially improved the spatial resolution of the patient LGE images by sharpening the edges of the heart and the scar. In conclusion, single-image super resolution significantly improves image errors. However, the magnitude of improvement was relatively small in images with Fourier-based zero padding. These findings provide evidence to support its potential use in myocardial scar imaging.

Keywords: Image processing; image quality; magnetic resonance imaging; myocardial scar.


Figures

Fig. 1.
Fig. 1.. Algorithm of single-image super-resolution using sparse representation. The details of the algorithm are described in Zeyde et al. . A. Training set ( hearts, total 2,100 images). In the original high-resolution late gadolinium enhancement (LGE) image (a 256×256 matrix), the region of high signal intensity (SI) indicates myocardial infarction (MI). The high-resolution image was scaled down by a factor of 4 to generate a low-resolution image (a 64×64 matrix). The low-resolution image was then scaled up by a factor of 4 to the original size (a 256×256 matrix) by interpolation. The methods of scale-up and scale-down are shown in Fig. 2. Both the high-resolution and interpolated images were divided into small overlapping patches, and the pairs of matching patches were extracted to form the training dictionary. Each of these patch-pairs underwent a pre-processing stage that removes the low-frequency components from high-resolution patches and extracts features from low-resolution patches. Dimensionality reduction using principal component analysis (PCA) was also applied on the features of the low-resolution patches, making the dictionary training step much faster. A low-resolution dictionary was trained for the low-resolution patches using the K-SVD algorithm , such that they could be represented sparsely. A corresponding high-resolution dictionary was constructed for the high-resolution patches, such that it matched the low-resolution dictionary . B. Test set ( hearts, total 1,500 images). As in the training set, low-resolution images (a 64×64 matrix) were also constructed from the high-resolution images (a 256×256 matrix) by scale-down by a factor of 4, and the low-resolution images (a 64×64 matrix) were scaled up to the destination size (a 256×256 matrix) by interpolation. Pre-processed low-resolution patches were extracted from each location, and then sparse-coded using the trained low-resolution dictionary . The representations found in the low-resolution dictionary were then used to recover the high-resolution patches by multiplying them with the high-resolution dictionary . The recovered high-resolution patches were merged by averaging in the overlap area to create the resulting image (a 256×256 matrix) A. Training set B. Test set.
Fig. 2.
Fig. 2.. Three comparative analyses. A. Zero-padding. A fast Fourier transform (FFT) was applied to the high-resolution image to compute the high-resolution k-space (a 256×256 matrix). The low-resolution k-space was created by extracting the central, low-frequency components (a 64×64 matrix) of the high-resolution k-space. The magnitude of the low-resolution k-space was corrected by a factor of 16 and smoothed by a Fermi window to simulate a low-resolution acquisition. The low-resolution image (a 64×64 matrix) was obtained as an FFT of the low-resolution k-space. The interpolated image (a 256×256 matrix) was obtained by padding zeros around the low-resolution k-space to restore the original size (a 256×256 matrix), and by applying inverse FFT to the zero-padded k-space. This is mathematically equivalent to convolution with a sinc function. B. Bicubic 1. The low-resolution image (a 64×64 matrix) was created as in the zero-padding group. The interpolated image (a 256×256 matrix) was created by applying bicubic interpolation to the low-resolution image. C. Bicubic 2. The low-resolution image (a 64×64 matrix) was created by spatially averaging the high-resolution image (a 256×256 matrix). The interpolated image (a 256×256 matrix) was created by applying bicubic interpolation to the low-resolution image.
Fig. 3.
Fig. 3.. Pixelwise absolute error vs. high-resolution image. Each column shows pixelwise absolute error in SI between the high-resolution image and the interpolated image (“Interpolation”) or the super resolution image (“Super Resolution”). The bottom row represents the absolute difference in SI between the interpolated image and the super resolution image. The columns indicate the results from three comparative analyses, including A. Zero-padding, B. Bicubic 1, and C. Bicubic 2.
Fig. 4.
Fig. 4.. Error measurements vs. high-resolution image. Values are . Black and white bars represent interpolated and super resolution images, respectively. The sample size was for short-axis (SAX) images, and for long-axis (LAX) images. vs. Interpolation; vs. zero Padding.
Fig. 5.
Fig. 5.. Error measurements vs. high-resolution image (continued). Values are . Black and white bars represent interpolated and super resolution images, respectively. The sample size is for short-axis (SAX) images, and for long-axis (LAX) images. vs. Interpolation; vs. zero Padding.
Fig. 6.
Fig. 6.. Super resolution applied to patient images: short-axis images. Original, low-resolution images of patients A and B with clinical standard spatial resolution were interpolated (zero padding or Bicubic 1) to scale up by a factor of 4. Super resolution was applied to the interpolated image. The bottom row represents the absolute difference in SI between the interpolated image and the super resolution image, as in Fig. 3. Note sharper geometric features in super resolution images (e.g., edges, endocardial border with blood pool).
Fig. 7.
Fig. 7.. Super resolution applied to patient images: long-axis images. See the legend of Fig. 6.

References

    1. Kim R. J., et al. , “Relationship of MRI delayed contrast enhancement to irreversible injury, infarct age, and contractile function,” Circulation, vol. 100, no. 19, pp. 1992–2002, Nov. 1999. - PubMed
    1. Schmidt A., et al. , “Infarct tissue heterogeneity by magnetic resonance imaging identifies enhanced cardiac arrhythmia susceptibility in patients with left ventricular dysfunction,” Circulation, vol. 115, no. 15, pp. 2006–2014, Apr. 2007. - PMC - PubMed
    1. Yan A. T., et al. , “Characterization of the peri-infarct zone by contrast-enhanced cardiac magnetic resonance imaging is a powerful predictor of post-myocardial infarction mortality,” Circulation, vol. 114, no. 1, pp. 32–39, Jul. 2006. - PubMed
    1. Ashikaga H., et al. , “Magnetic resonance-based anatomical analysis of scar-related ventricular tachycardia: Implications for catheter ablation,” Circulat. Res., vol. 101, pp. 939–947, Oct. 2007. - PMC - PubMed
    1. Yang J. and Huang T.. Image super-resolution: Historical overview and future challenges Super-Resolution Imaging Milanfar P., Ed., Boca Raton, FL USA: CRC Press, 2011, pp. 1–96.