. 2015 Feb 19;57(4):721-734.
doi: 10.1016/j.molcel.2015.01.004.

Stress induces p38 MAPK-mediated phosphorylation and inhibition of Drosha-dependent cell survival

Affiliations

Stress induces p38 MAPK-mediated phosphorylation and inhibition of Drosha-dependent cell survival

Qian Yang et al. Mol Cell. .

Abstract

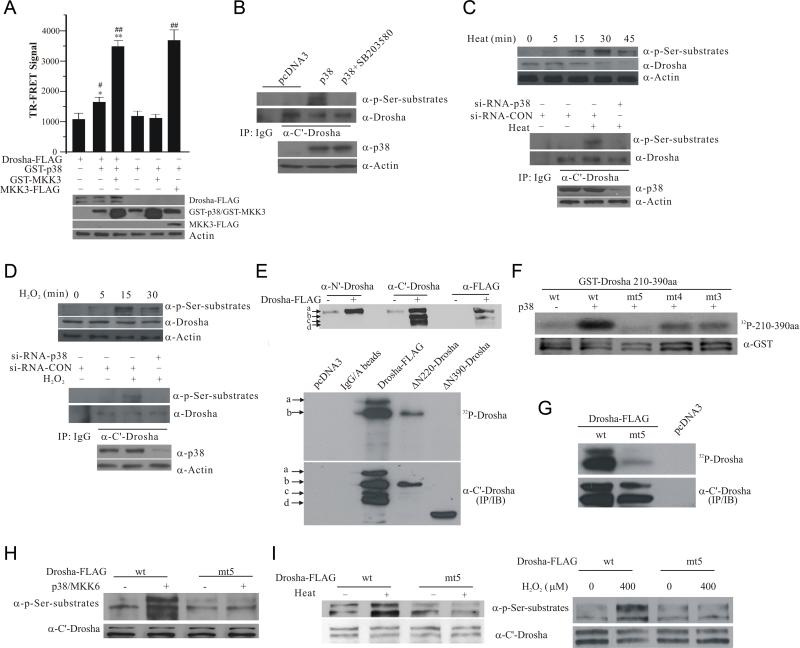
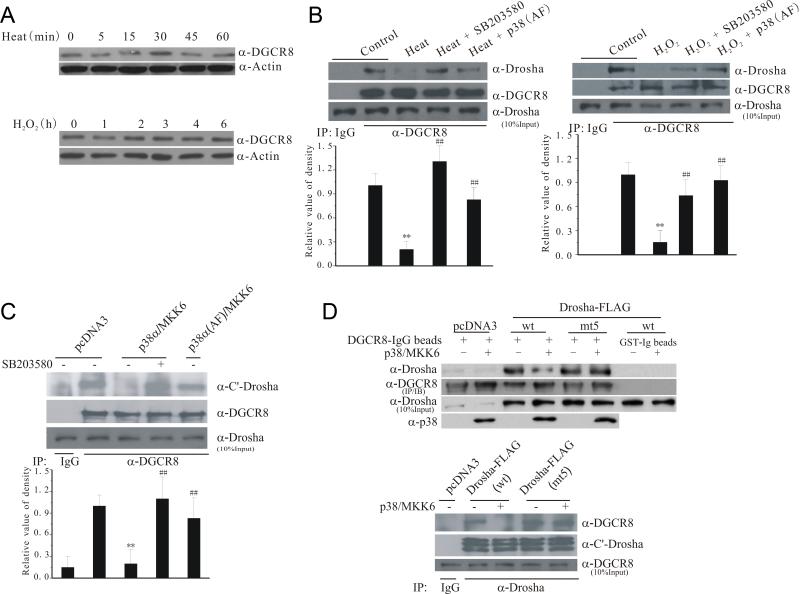
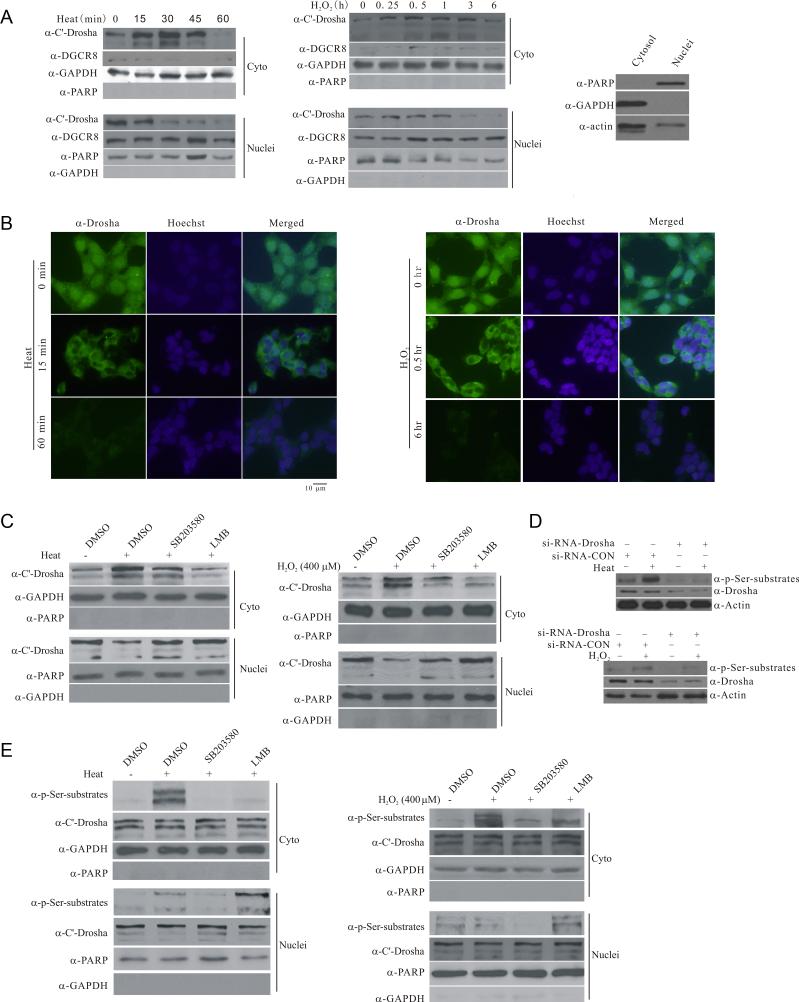
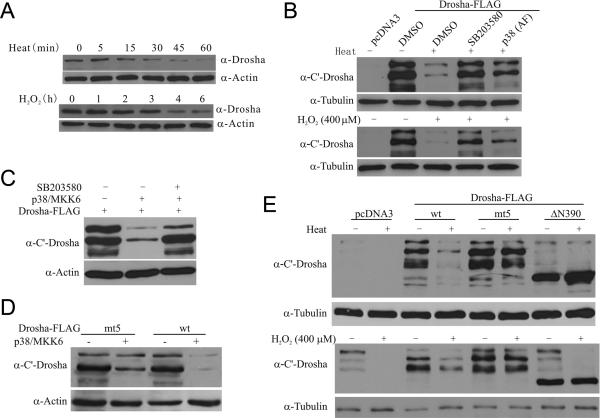
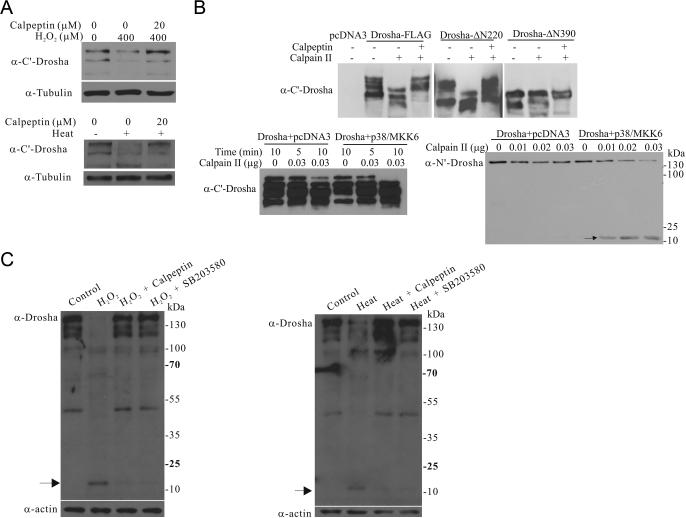
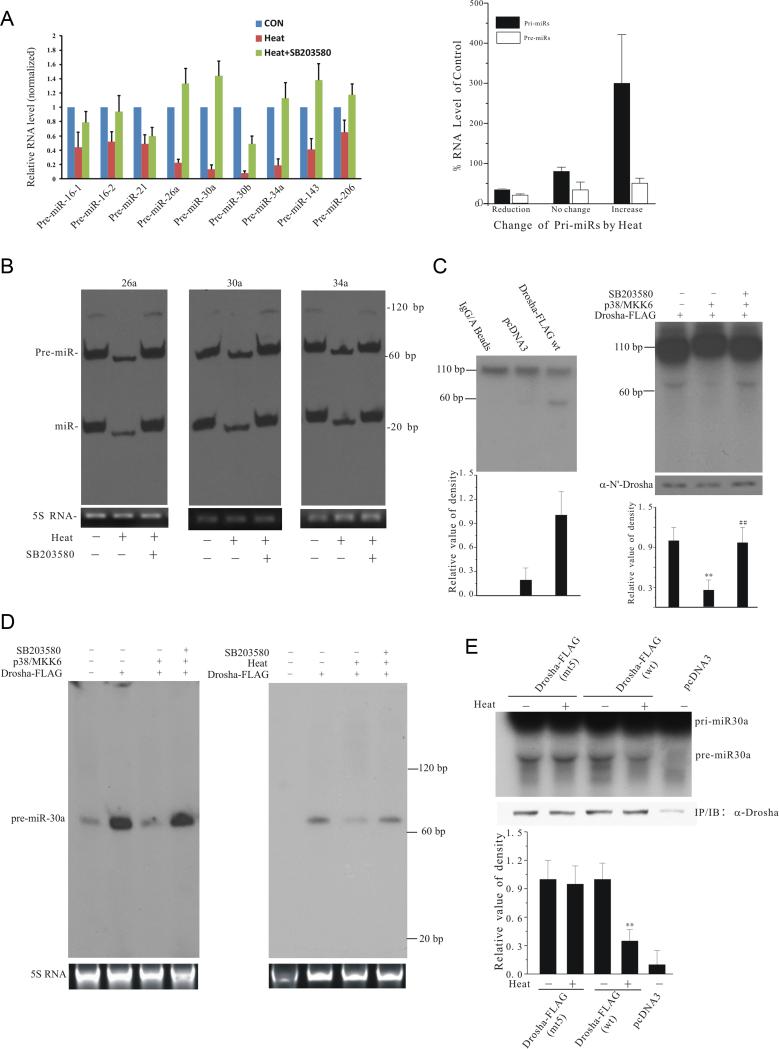
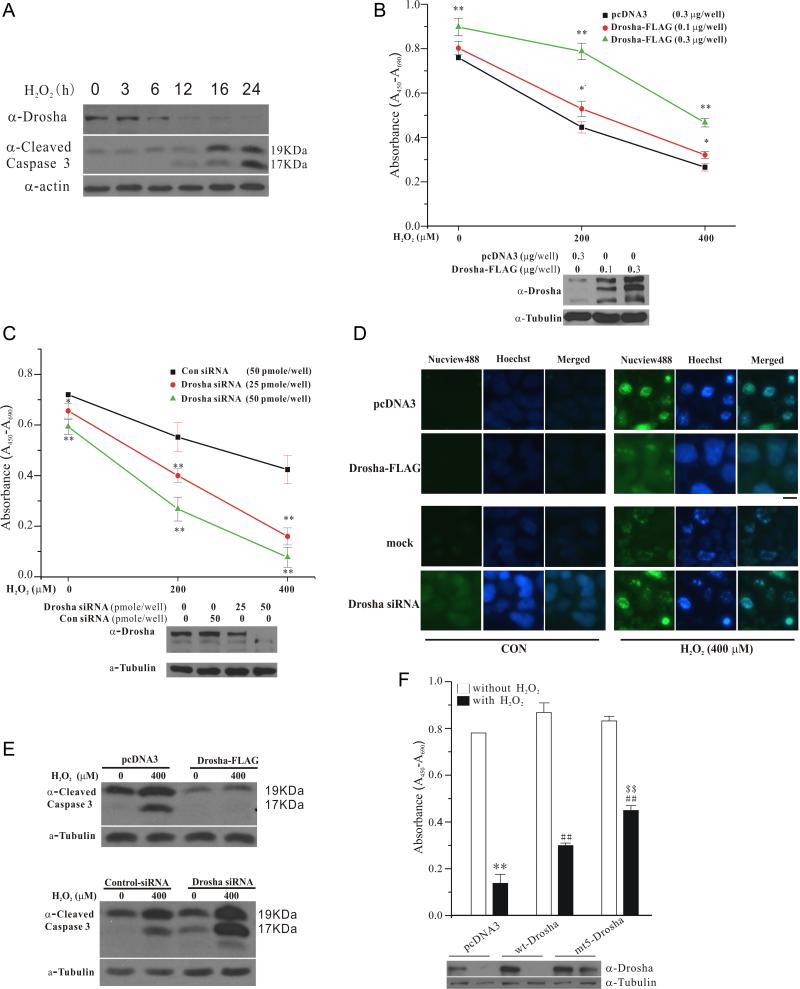
MicroRNAs (miRNAs) regulate the translational potential of their mRNA targets and control many cellular processes. The key step in canonical miRNA biogenesis is the cleavage of the primary transcripts by the nuclear RNase III enzyme Drosha. Emerging evidence suggests that the miRNA biogenic cascade is tightly controlled. However, little is known whether Drosha is regulated. Here, we show that Drosha is targeted by stress. Under stress, p38 MAPK directly phosphorylates Drosha at its N terminus. This reduces its interaction with DiGeorge syndrome critical region gene 8 and promotes its nuclear export and degradation by calpain. This regulatory mechanism mediates stress-induced inhibition of Drosha function. Reduction of Drosha sensitizes cells to stress and increases death. In contrast, increase in Drosha attenuates stress-induced death. These findings reveal a critical regulatory mechanism by which stress engages p38 MAPK pathway to destabilize Drosha and inhibit Drosha-mediated cellular survival.


Figures

Figure 1
Figure 1
Phosphorylation of Drosha RS-rich domain by p38 MAPK. (A) Interaction between Drosha and p38 by TR-FRET. HEK293 cells were transfected with various plasmids carrying Drosha-FLAG, FLAG-MKK3, GST-p38 and GST-MKK3. Over-expressed proteins immunoprecipitated from lysates were tested for TR-FRET signal. The top panel shows TR-FRET signal expressed as ratio (A665/A615 × 104). The data were expressed as mean ± SD from triplicate samples (*p <0.05 or **p < 0.01 vs Drosha-FLAG alone group and #p < 0.05 or ##p < 0.01 vs GST-p38 alone group; ANONA with Dunnett's Test). The bottom panel shows the expression of Drosha-FLAG, GST-p38, GST-MKK3, and FLAG-MKK3. (B) p38 MAPK-induced phosphorylation of endogenous Drosha. Endogenous Drosha immunoprecipitated from HEK293 cells transfected as indicated was blotted with an anti-phospho Ser followed by a proline (top panel). The bottom panel shows the levels of p38. (C) Heat-induced phosphorylation of endogenous Drosha in HEK293 cells. Levels of phosphorylated Drosha in cellular lysates were measured by anti-phospho Ser blotting after heat (45°C) treatment (top panel). Drosha immunoprecipitated from HEK293 cells transfected and treated with heat for 15 min was blotted with anti-phospho Ser antibody (middle and bottom panels). (D) H2O2-induced phosphorylation of endogenous Drosha in HEK293 cells. The experiments were carried out as described in (C) with H2O2 (400 μM) treatment of various time (top panel) or 15 min. (E) Mapping the phosphorylation domain of Drosha by direct p38 kinase assay. Top panel shows multiple species of Drosha-FLAG marked as a-d recognized by the indicated antibodies in HEK293 lysates over-expressing Drosha-FLAG. Middle panel shows the autoradiograph of in vitro p38 MAPK kinase reaction with Drosha-FLAG, ΔN220-Drosha-FLAG and ΔN390-Drosha-FLAG immunoprecipitated from HEK293T cells with the anti-C’ Drosha antibody. The same membrane was probed by anti-C’ terminal Drosha antibody (bottom panel). (F) Identification of p38 phosphorylation sites in Drosha RS-rich domain. Purified GST-Drosha 210-390aa was incubated with purified p38 MAPK in kinase assay (top panel, autoradiograph). The same membrane was blotted with an anti-GST antibody (bottom panel) (wild type: wt; mutants: mt3, S220A, S255A, and T274A; mt4, S220A, S255A, T274A, and S300A; and mt5, S220A, S255A, T274A, S300A, and S355A). (G) Phosphorylation of Drosha by p38 MAPK. Drosha-FLAG (wt and mt5) was immunoprecipitated from cells with anti-C’ terminal Drosha antibody and phosphorylated by p38 MAPK in vitro. (H) Phosphorylation of Drosha by p38 MAPK in cells. Cell lysates from HEK293T cells transfected as indicated were blotted with the phospho Ser antibody. The same membrane was re-probed with anti-C’ Drosha antibody. (I) Heat- or H2O2-induced phosphorylation of Drosha. HEK293T cells after transfection were treated with heat (45°C) or H2O2 (400 μM) for 15 min. Lysates were blotted as described in (H). See also Figure S1.
Figure 2
Figure 2
Stress-induced loss of interaction between Drosha and DGCR8. (A) Levels of DGCR8 following stress. Lysates from HEK293 treated with heat (45°C) or H2O2 (400 μM) were blotted for DGCR8. (B) Stress-induced dissociation of endogenous Drosha and DGCR8 complex. Lysates of HEK293 cells after treatment with heat (15 min) or H2O2 (30 min) were immunoprecipitated with an anti-DGCR8 antibody (20 μM SB203580 was added 30 min and p38 (AF) was transfected over-night before treatment). The precipitates were blotted for Drosha. The bottom graphs show the quantification of Drosha levels (mean ± SEM, n = 4, **p < 0.01 vs control; ##p < 0.01 vs heat or H2O2 alone). (C) Active p38-induced dissociation of endogenous Drosha and DGCR8 complex. HEK293 cells were transfected for 12 h and treated with SB203580 (20 μM) or vehicle for 16 h. Binding of endogenous Drosha and DGCR8 was assessed by co-IP. The bottom graph shows the quantification of Drosha levels (mean ± SEM, n = 4, **p < 0.01 vs pcDNA3; ##p < 0.01 vs p38α/MKK6). (D) Resistance to p38-induced dissociation by mt5 Drosha. Drosha from the transfected HEK293 cells was pulled down with GST-DGCR8 (top panel) or co-immunoprecipitated as described in (C) (bottom panel). See also Figure S2.
Figure 3
Figure 3
Stress-induced phosphorylation-dependent nuclear export of Drosha. (A) Stress-induced changes in the subcellular distribution of endogenous Drosha. HEK293 cells were exposed to heat (45°C) or H2O2 (400 μM) for the indicated time. Cytoplasmic and nuclear fractions were blotted for Drosha, cytoplasmic marker GAPDH or nuclear marker PARP1 (PARP). Right panel shows the cross contamination of cytoplasmic and nuclear fractions yielded by the Sigma Nuclei EZ Prep Kit (Nuc-01). (B) Stress-induced changes in the subcellular distribution of endogenous Drosha by immunocytochemistry. HEK297 cells were exposed to heat (45°C) or H2O2 (400 μM) for the indicated time. The cells were stained with anti-Drosha antibody or Hoechst33324. All Drosha images were acquired with 200 ms exposure time and Hoechst image 10 ms exposure time. (C) Stress-induced p38 MAPK dependent accumulation of endogenous Drosha in the cytoplasm. HEK293T cells were treated with SB203580 (20 μM) or leptomycin B (LMB, 5 ng/ml) for 30 min and exposed to heat (45°C, 30 min) or H2O2 (400 μM, 30 min). The levels of Drosha in the cytoplasmic and nuclear fractions were determined. (D) Recognition of stress-induced Drosha phosphorylation by anti-phospho Ser antibody. HEK293 cells were transfected with si-RNA-Drosha or si-RNA-control for 72 h and exposed to heat (45°C) or H2O2 (400 μM) for 15 min. The proteins were collected for western blot with anti-phospho Ser antibody. (E) Stress-induced nuclear export of phosphorylated Drosha. HEK293 cells were treated as in (C) with 15 min stress. See also Figure S3.
Figure 4
Figure 4
Stress-induced degradation of Drosha. (A) Stress-induced degradation of endogenous Drosha. Lysates from HEK293 cells treated with heat (45°C) or H2O2 (400 μM) were blotted for Drosha. (B) Effects of inhibiting p38 MAPK on stress-induced degradation of Drosha. HEK293 cells were transfected as indicated and treated with Heat (45°C, 45 min) or H2O2 (400 μM, 8 h). SB203580 was added to cells 30 min prior to stress treatment. (C) p38-induced decrease in the level of Drosha. HEK293T cells were transfected as indicated for 12 h and treated with SB203580 (20 μM) or vehicle for 16 h. (D) Resistance to p38 MAPK-induced degradation by mt5 Drosha-FLAG. Levels of wt and mt5 Drosha in HEK293T cells after transfection were determined. (E) Resistance to stress-induced degradation by mt5 Drosha. HEK293T cells after transfection were exposed to heat (45°C, 45 min) or H2O2 (400 μM, 8 h) and blotted for Drosha. See also Figure S4.
Figure 5
Figure 5
Stress-induced cleavage of Drosha by calpain. (A) Effects of inhibition of calpain on stress-induced degradation of Drosha. HEK293T cells were pre-treated with calpain inhibitor calpeptin (20 μM) for 2 h and then exposed to H2O2 (400 μM, 6 h) or heat (45°C, 45 min). (B) Direct cleavage of Drosha by calpain. Drosha-FLAG wt, Δ N220, or ΔN390 immunoprecipitated from HEK293T cells was incubated with purified calpain II (0.05 μg) with or without calpeptin (20 μM) for 5 min at room temperature (top panel). Bottom panels show the levels of Drosha immunoprecipitated from transfected HEK293T cells after incubation with calpain II at 0°C. Arrow indicates the cleaved fragment. (C) The cleavage of Drosha after stress. HEK293T cells were pre-treated with the calpain inhibitor calpeptin (20 μM) or the p38 inhibitor SB203580 for 2 h and then exposed to H2O2 (400 μM, 6 h) or heat (45°C, 45 min). The lysates were blotted with anti-Drosha antibody. Arrow indicates the cleaved small fragment.
Figure 6
Figure 6
Stress- and p38 MAPK-induced loss of Drosha function. (A) Heat-induced decrease in the levels of endogenous pre-miRNAs. HEK293T cells were treated with SB203580 or vehicle for 30 min, exposed to heat (45°C, 45 min), and re-cultured at 37°C for 3 h. Left panel shows the levels of endogenous pre-miRNAs determined by qRT-PCR in PureLink isolation kit prepared samples. Right panel shows the levels of the corresponding pri-miRNAs determined by qRT-PCR in TRIzol prepared samples (levels of pri- or pre-miRNAs without heat treatment were set as 100%. Reduction: pri-miRs 30b, 26a, and 34a; no change: pri-miRs 16-1, 30a, and 21; increase: pri-miRs 16-2, 143, and 206). Primers used for qRT-PCR are listed in tables in supplementary experimental procedures. (B) Heat-induced loss of endogenous pre- and mature miRNAs. RNA (5 μg) purified by PureLink isolation kit from cells treated as in 6A was analyzed using Highly Sensitive MiRNA Northern Blot Kit (Signosis) and probes (sequences in supplementary experimental procedures). (C) p38 MAPK-induced loss of pri-miR-30a processing in vitro. Internally labeled pri-miR-30a probe was incubated with immunoprecipitated wt Drosha-FLAG (left) or with the total extracts prepared from HEK293T cells transfected as indicated (right). The bottom graphs show the quantification of pre-miR-30a levels (mean ± SEM, n = 3; **p < 0.01 vs Drosha alone group; ##p < 0.01 vs Drosha/p38/MKK6 group). (D) p38 MAPK-dependent loss of pri-miR-30a processing in cells. Left panel: HEK293T cells transfected with pCMV-miR-30a and additional plasmids as indicated were treated with SB203580 for 12 h before the total RNA isolation. The levels of premiR-30a were analyzed by Northern blot with probe for pre-miR-30a (bottom panel shows 5S RNA as loading control). Right panel: Heat-induced loss of pri-miR-30a processing in cells. HEK293 cells transfected with pCMV-miR-30a were treated with SB203580 or vehicle for 30 min and exposed to heat (45°C, 45 min). The levels of pre-miR-30a were determined as in left panel. (E) Resistance to heat-induced inhibition of pri-miR-30a processing by mt5 Drosha. HEK293 cells transfected as indicated were exposed to heat as described in (D). Comparable amounts of Drosha-FLAG were immunoprecipitated and assessed for pri-miR-30a conversion as described in (C). The bottom panel is the quantification of pre-miR-30a levels (mean ± SEM, n = 3; **p < 0.01 vs Drosha alone group). See also Figure S5.
Figure 7
Figure 7
Role of Drosha in cell survival. (A) Time-dependent change of Drosha and cleaved caspase 3 by H2O2. HEK293 cells treated with H2O2 (400 μM) were blotted with anti-Drosha and anti-cleaved caspase 3 anti-bodies. (B) Drosha-mediated protection against H2O2-induced death. HEK293T cells in 24-well plate were transfected with Drosha-FLAG (0.1 or 0.3 μg/well) for 24 h and treated with H2O2 (400 μM) for 24 h. Cell viability was measured by WST-1 assay (mean ± SEM, *p<0.05, **p<0.01 versus pcDNA3 in the same group, ANOVA and Tukey's test). Bottom panel shows the levels of over-expressed Drosha-FLAG. (C) Increased sensitivity to H2O2-induced death by Drosha knockdown. HEK293T cells in 24-well plate transfected with control or Drosha siRNA (25 or 50 pmole/well) for 60 h were treated with H2O2 for 12 h. Cell viability was determined as described in (B) (mean ± SEM, *p<0.05, **p<0.01 versus Con siRNA in the same group, ANOVA and Tukey's test). Bottom panel is the levels of endogenous Drosha after knockdown. (D) Inhibition of stress-induced activation of caspase 3 by Drosha. HEK293T cells were transfected with control, Drosha-FLAG (0.3μg/well) or Drosha siRNA (50 pmole/well) as described in (C) for 24 h and treated with H2O2 (400 μM) (12 h for Drosha-FLAG and 8 h for Drosha siRNA). Activated caspase 3 in live cells was detected by a green fluorescent substrate probe (Biotium). The staining and imaging conditions were consistent throughout the experiment with a 200 ms and 10 ms exposure time for caspase and Hoechst (blue), respectively. The scale bar represents 10 μm. (E) Correlation of caspase 3 activity and Drosha by immunoblotting. HEK293T cells were treated as described in (D). The levels of active (cleaved) caspase 3 were determined by immunoblotting. (F) Effects of mt5 Drosha on cell survival. HEK293T cells after transfection were treated with H2O2 (400 μM) for 36 h. Cell viability was assessed by WST-1 (mean ± SEM; **p<0.01 vs pcDNA3 alone; ##p<0.01 vs pcDNA3 treated with H2O2; $$p<0.01 vs wt Drosha group treated with H2O2, ANOVA and Tukey's test). Western blot shows the level of expressed Drosha. See also Figure S6.

Similar articles

Cited by

References

    1. Afanasyeva EA, Mestdagh P, Kumps C, Vandesompele J, Ehemann V, Theissen J, Fischer M, Zapatka M, Brors B, Savelyeva L, et al. MicroRNA miR-885-5p targets CDK2 and MCM5, activates p53 and inhibits proliferation and survival. Cell death and differentiation. 2011;18:974–984. - PMC - PubMed
    1. Ambros V. MicroRNA pathways in flies and worms: growth, death, fat, stress, and timing. Cell. 2003;113:673–676. - PubMed
    1. Babiarz JE, Ruby JG, Wang Y, Bartel DP, Blelloch R. Mouse ES cells express endogenous shRNAs, siRNAs, and other Microprocessor-independent, Dicer-dependent small RNAs. Genes Dev. 2008;22:2773–2785. - PMC - PubMed
    1. Brennecke J, Hipfner DR, Stark A, Russell RB, Cohen SM. bantam encodes a developmentally regulated microRNA that controls cell proliferation and regulates the proapoptotic gene hid in Drosophila. Cell. 2003;113:25–36. - PubMed
    1. Cen H, Mao F, Aronchik I, Fuentes RJ, Firestone GL. DEVD NucView488: a novel class of enzyme substrates for real-time detection of caspase-3 activity in live cells. The FASEB journal : official publication of the Federation of American Societies for Experimental Biology. 2008;22:2243–2252. - PubMed

Publication types

MeSH terms