. 2015 Feb 20;10(2):e0117531.
doi: 10.1371/journal.pone.0117531. eCollection 2015.

Multi-regional investigation of the relationship between functional MRI blood oxygenation level dependent (BOLD) activation and GABA concentration

Affiliations

Multi-regional investigation of the relationship between functional MRI blood oxygenation level dependent (BOLD) activation and GABA concentration

Ashley D Harris et al. PLoS One. .

Abstract

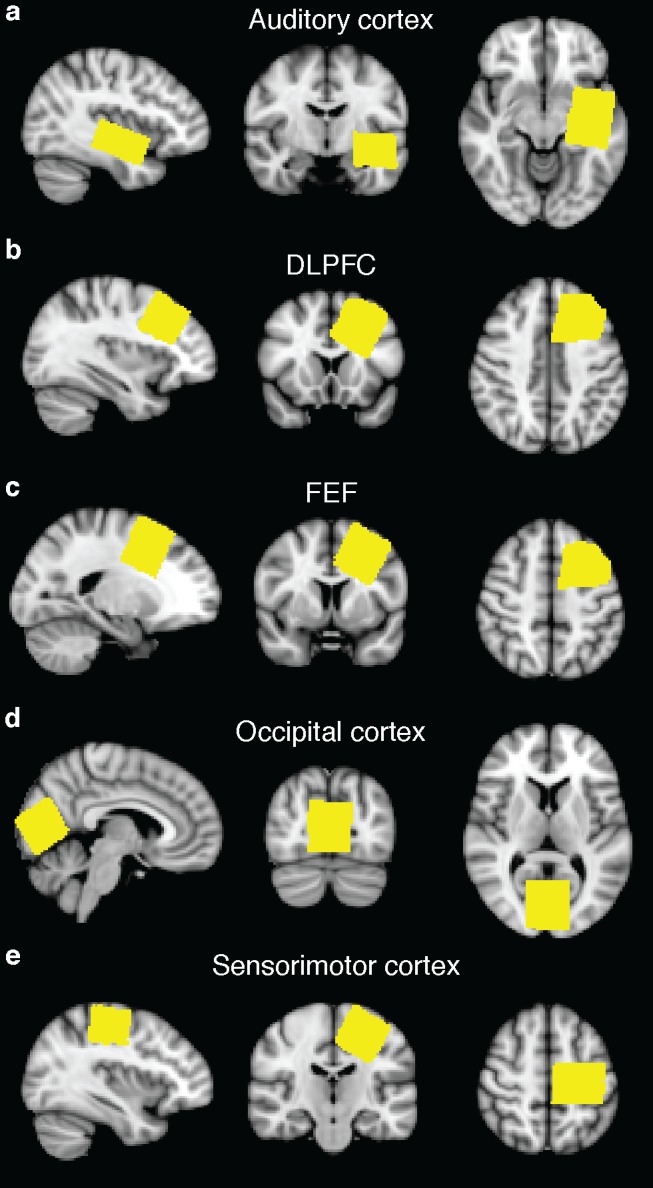
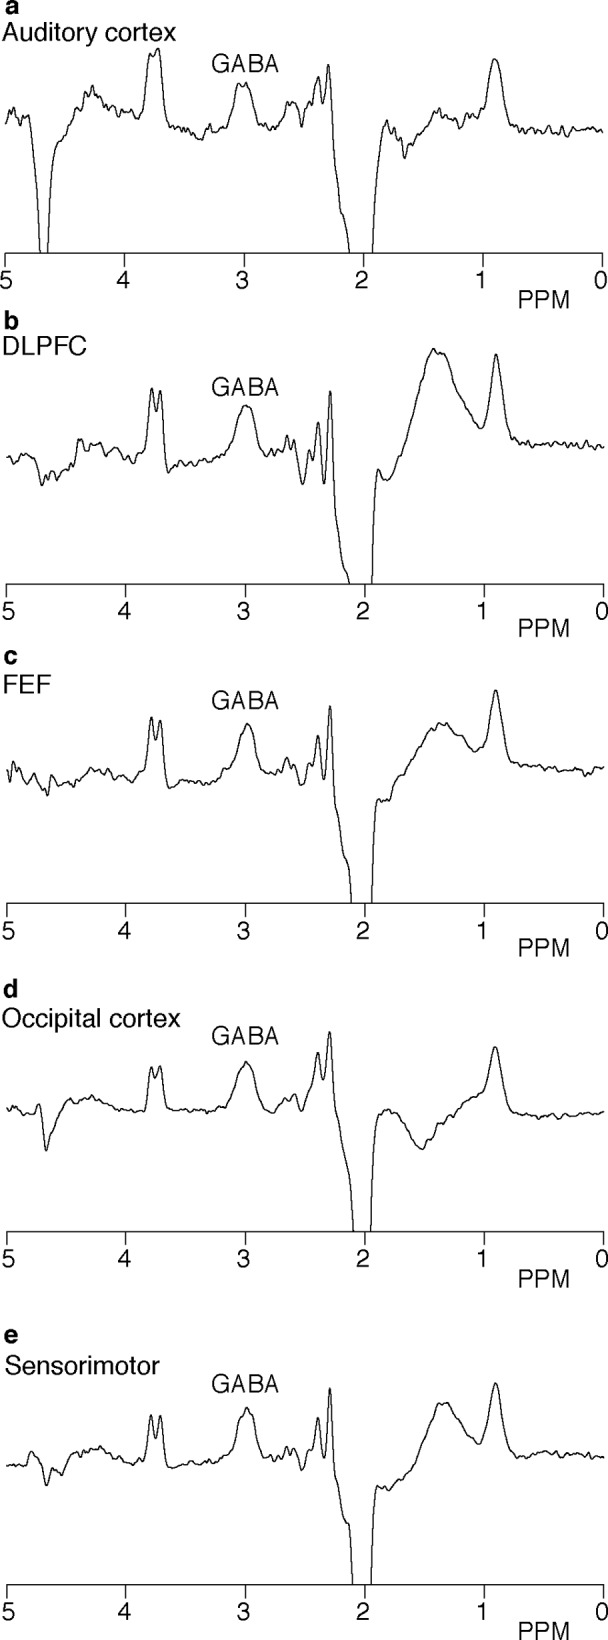
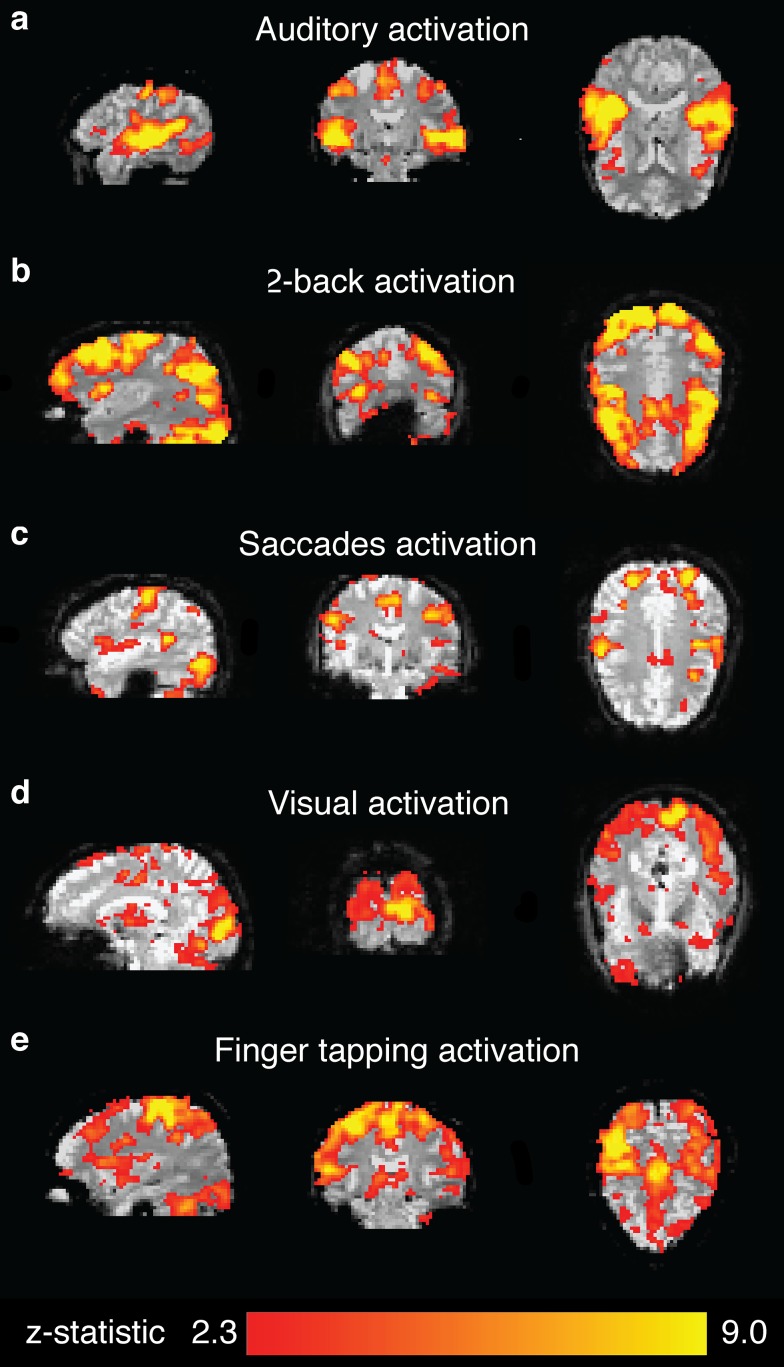
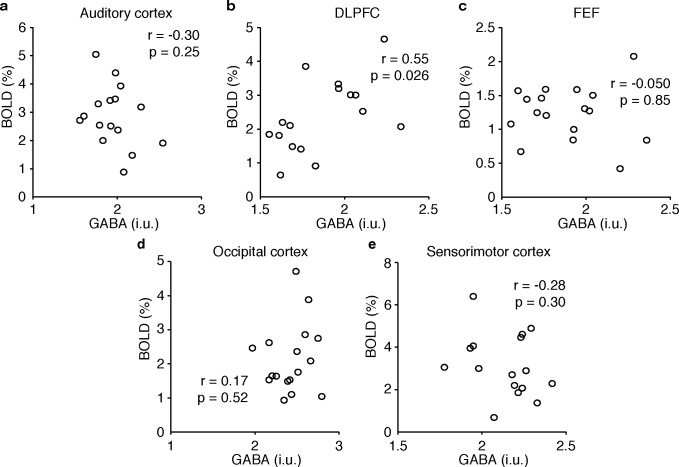
Several recent studies have reported an inter-individual correlation between regional GABA concentration, as measured by MRS, and the amplitude of the functional blood oxygenation level dependent (BOLD) response in the same region. In this study, we set out to investigate whether this coupling generalizes across cortex. In 18 healthy participants, we performed edited MRS measurements of GABA and BOLD-fMRI experiments using regionally related activation paradigms. Regions and tasks were the: occipital cortex with a visual grating stimulus; auditory cortex with a white noise stimulus; sensorimotor cortex with a finger-tapping task; frontal eye field with a saccade task; and dorsolateral prefrontal cortex with a working memory task. In contrast to the prior literature, no correlation between GABA concentration and BOLD activation was detected in any region. The origin of this discrepancy is not clear. Subtle differences in study design or insufficient power may cause differing results; these and other potential reasons for the discrepant results are discussed. This negative result, although it should be interpreted with caution, has a larger sample size than prior positive results, and suggests that the relationship between GABA and the BOLD response may be more complex than previously thought.


Conflict of interest statement

Competing Interests: The authors have declared that no competing interests exist.

Figures

Fig 1
Fig 1. MRS voxel placement.
MRS voxel mask images for one subject, transformed into standard space and overlaid on the MNI standard-space atlas, for all five locations: (a) auditory cortex; (b) dorsolateral prefrontal cortex; (c) frontal eye field; (d) occipital cortex; and (e) sensorimotor cortex.
Fig 2
Fig 2. GABA-edited MRS.
Representative spectra for all regions from one subject: (a) auditory cortex; (b) dorsolateral prefrontal cortex (DLPFC); (c) frontal eye field (FEF); (d) occipital cortex; and (e) sensorimotor cortex. These spectra are from the same subject as the voxel masks shown in Fig. 1.
Fig 3
Fig 3. Functional MRI.
Single subject Z-statistic maps showing BOLD activation for each task for the same subject as Figs. 1 and 2. Amongst other regions, the auditory task activated perisylvian primary auditory cortex (a), the working memory task activated DLPFC (b), the eye-tracking task activated FEF (c), the visual task activated occipital visual cortex (d); and the finger-tapping task activated primary motor and somatosensory cortices (e).
Fig 4
Fig 4. Inter-individual GABA-BOLD correlations.
GABA, quantified in institutional units, and BOLD signal change, as defined by the peak voxel in the MRS voxel, are plotted for all five regions. To correct for multiple comparison, a threshold of significance of p = 0.01 was set; p > 0.02 for all five comparisons. The DLPFC result, which approaches significance, has a positive slope in contrast to previous results.

Similar articles

Cited by

References

    1. Logothetis NK, Pauls J, Augath M, Trinath T, Oeltermann A (2001) Neurophysiological investigation of the basis of the fMRI signal. Nature 412: 150–157. - PubMed
    1. Wise RG, Harris AD, Stone AJ, Murphy K (2013) Measurement of OEF and absolute CMRO2: MRI-based methods using interleaved and combined hypercapnia and hyperoxia. Neuroimage 83: 135–147. 10.1016/j.neuroimage.2013.06.008 - DOI - PMC - PubMed
    1. Lu H, Hua J, van Zijl PC (2013) Noninvasive functional imaging of cerebral blood volume with vascular-space-occupancy (VASO) MRI. NMR Biomed 26: 932–948. 10.1002/nbm.2905 - DOI - PMC - PubMed
    1. Aguirre GK, Detre JA (2012) The development and future of perfusion fMRI for dynamic imaging of human brain activity. Neuroimage 62: 1279–1285. 10.1016/j.neuroimage.2012.04.039 - DOI - PubMed
    1. Rae CD (2014) A guide to the metabolic pathways and function of metabolites observed in human brain (1)H magnetic resonance spectra. Neurochem Res 39: 1–36. 10.1007/s11064-013-1199-5 - DOI - PubMed

Publication types