

Atrial-like cardiomyocytes from human pluripotent stem cells are a robust preclinical model for assessing atrial-selective pharmacology
- PMID: 25700171
- PMCID: PMC4403042
- DOI: 10.15252/emmm.201404757
Atrial-like cardiomyocytes from human pluripotent stem cells are a robust preclinical model for assessing atrial-selective pharmacology
Abstract
Drugs targeting atrial-specific ion channels, Kv1.5 or Kir3.1/3.4, are being developed as new therapeutic strategies for atrial fibrillation. However, current preclinical studies carried out in non-cardiac cell lines or animal models may not accurately represent the physiology of a human cardiomyocyte (CM). In the current study, we tested whether human embryonic stem cell (hESC)-derived atrial CMs could predict atrial selectivity of pharmacological compounds. By modulating retinoic acid signaling during hESC differentiation, we generated atrial-like (hESC-atrial) and ventricular-like (hESC-ventricular) CMs. We found the expression of atrial-specific ion channel genes, KCNA5 (encoding Kv1.5) and KCNJ3 (encoding Kir 3.1), in hESC-atrial CMs and further demonstrated that these ion channel genes are regulated by COUP-TF transcription factors. Moreover, in response to multiple ion channel blocker, vernakalant, and Kv1.5 blocker, XEN-D0101, hESC-atrial but not hESC-ventricular CMs showed action potential (AP) prolongation due to a reduction in early repolarization. In hESC-atrial CMs, XEN-R0703, a novel Kir3.1/3.4 blocker restored the AP shortening caused by CCh. Neither CCh nor XEN-R0703 had an effect on hESC-ventricular CMs. In summary, we demonstrate that hESC-atrial CMs are a robust model for pre-clinical testing to assess atrial selectivity of novel antiarrhythmic drugs.
Keywords: COUP‐TF; arrhythmias; atrial cardiomyocytes; atrial fibrillation; ion channels.
© 2015 The Authors. Published under the terms of the CC BY 4.0 license.
Figures
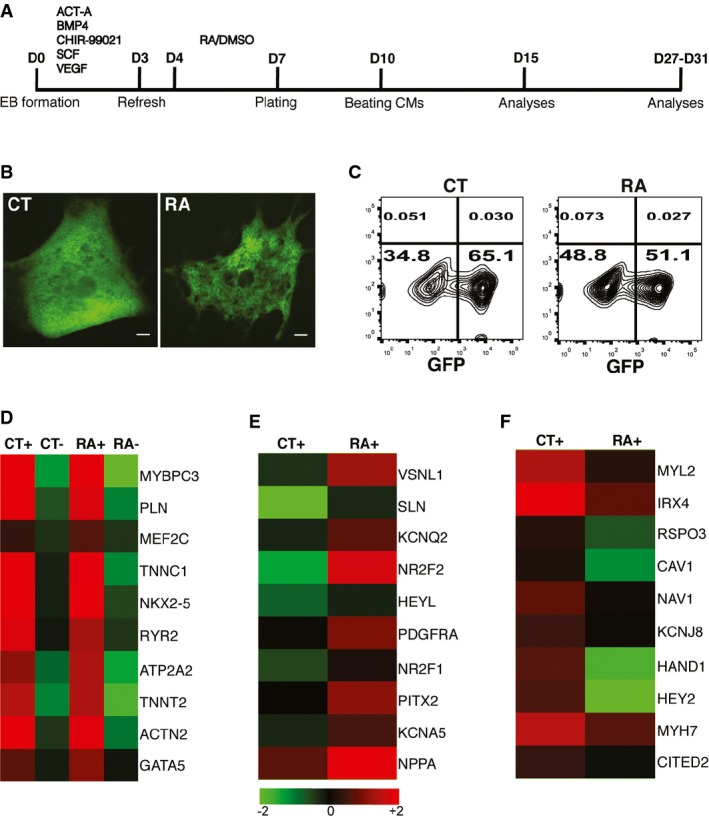
A Schematic of the cardiac differentiation protocol. Beating embryoid bodies (EBs) were observed at day 10. Differentiation efficiency in each experiment was assessed by flow cytometry (FC) for GFP at day 15. Further characterization of EBs derived from control (CT) and RA-treated (RA) cultures was carried out by transcriptional or functional analysis between days 27 and 31.
B GFP+ EBs derived from CT and RA cultures at day 10; scale bar: 100 μm.
C Representative FC plots depicting percentage of GFP+ cells obtained at day 15, from CT and RA cultures in a typical experiment.
D Heat map demonstrating enrichment of cardiac genes in GFP+ fractions (CT+, RA+) compared to GFP− fractions (CT−, RA−) at day 31.
E, F Heat map of a select list of genes (E) upregulated and (F) downregulated in RA+ compared to CT+ at day 31. Fold change > 2.
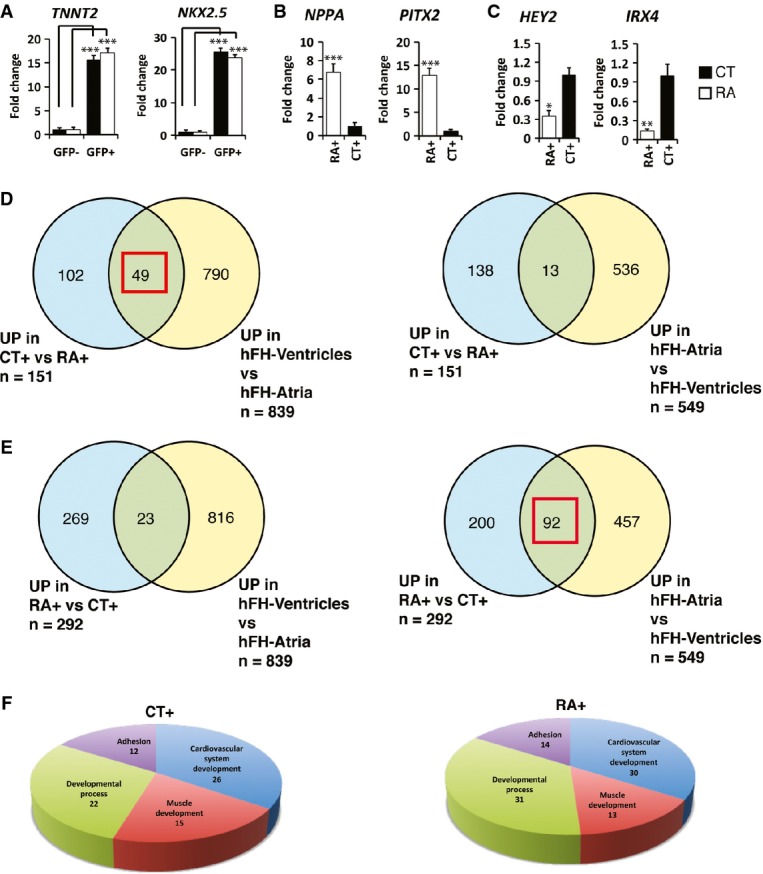
A–C qPCR of selected transcripts at day 31 to validate (A) enrichment of cardiac markers in GFP+ fractions against GFP− fractions, (B) upregulation of atrial and (C) downregulation of ventricular genes in RA+ compared to CT+ (n = 3).
D, E Venn diagram to illustrate overlap of gene lists upregulated (UP) in CT+ CMs (D) and RA+ CMs (E) with genes expressed in atria and ventricles of 15-week-old fetal heart. Red square indicates higher overlap of CT+ with gene list of fetal ventricles or higher overlap of RA+ with gene list of fetal atria.
F Pie chart illustrates major classes of gene ontology terms enriched in gene lists upregulated in CT+ and RA+ CMs.
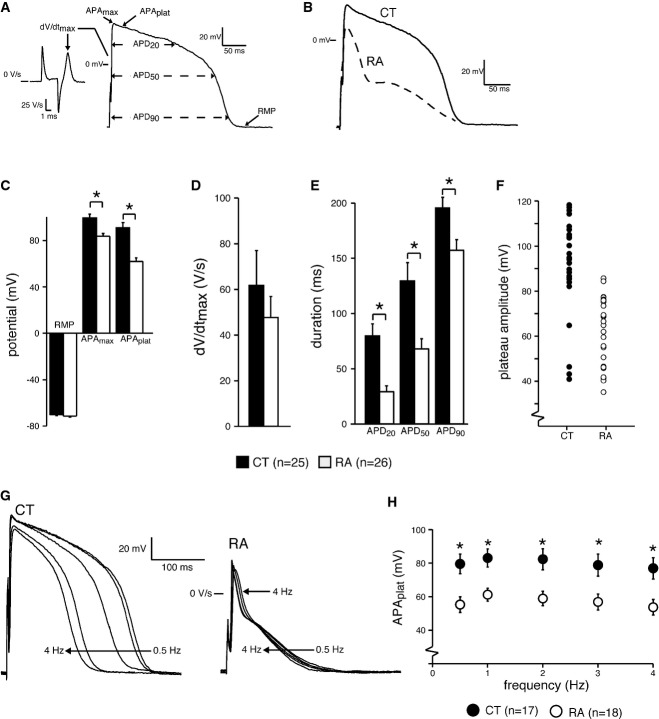
A AP illustrating the analyzed parameters.
B Representative APs of day 31 CMs from control (CT) and RA-treated (RA) groups at 1 Hz.
C–E RMP, APAmax and APAplat (C), dV/dtmax (D) and APD20, APD50 and APD90 of CT and RA CMs (E).
F Plot showing all measured APAplat values of CT and RA CMs.
G Representative APs of CT and RA CMs at 0.5–4 Hz.
H Average APAplat at 0.5–4 Hz. Please note that the AP differences in morphology are present at all measured frequencies.
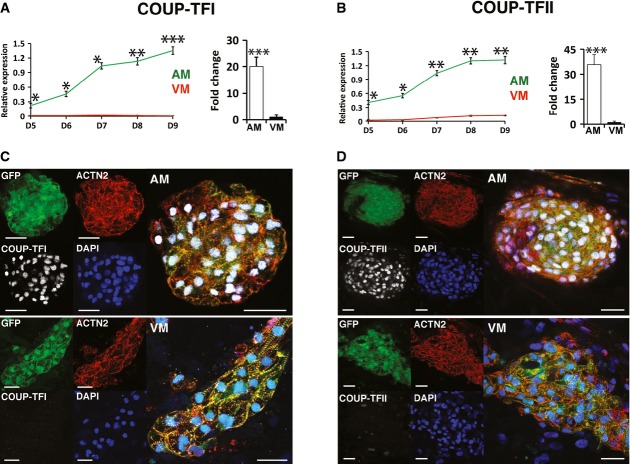
A, B Line plot illustrating relative mRNA levels of (A) COUP-TFI and (B) COUP-TFII in VM and AM differentiations from day 5 through day 9 (left) and in GFP+ CMs at day 31 (right); n = 3.
C, D COUP-TFI (C) and COUP-TFII (D) immunofluorescence at day 31 in AM (top) and VM (bottom). Scale bars: 40 μm.
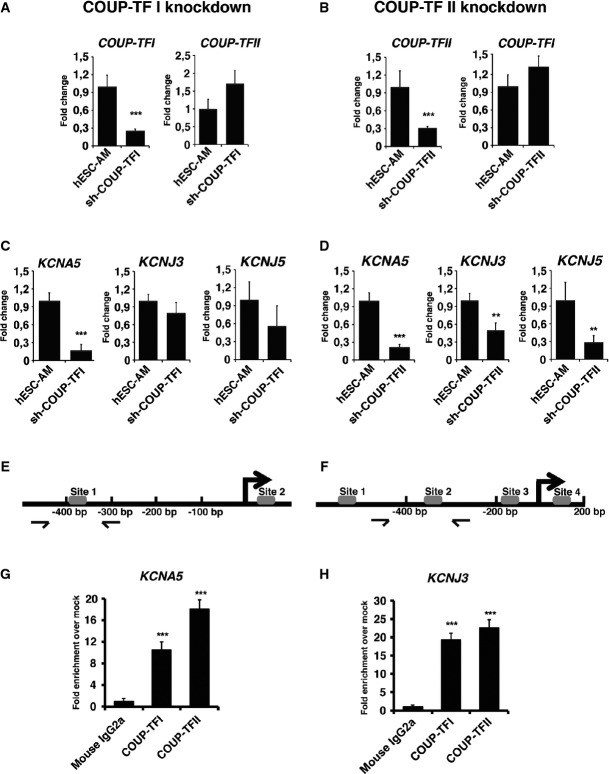
A, B mRNA expression of COUP-TFI and COUP-TFII following shRNA-mediated knockdown of (A) COUP-TFI or (B) COUP-TFII in hESC-atrial cardiomyocytes (AM) at day 30.
C, D mRNA expression of ion channel genes KCNA5, KCNJ3 and KCNJ5 after knockdown of (C) COUP-TFI or (D) COUP-TFII in AM at day 30.
E, F Schematic of NR2F binding sites in (E) KCNA5 and (F) KCNJ3 promoters.
G, H ChIP-qPCR analysis at day 30 shows enriched binding of COUP-TFI and COUP-TFII to the promoter region of (G) KCNA5 and (H) KCNJ3, compared to IgG in AM.
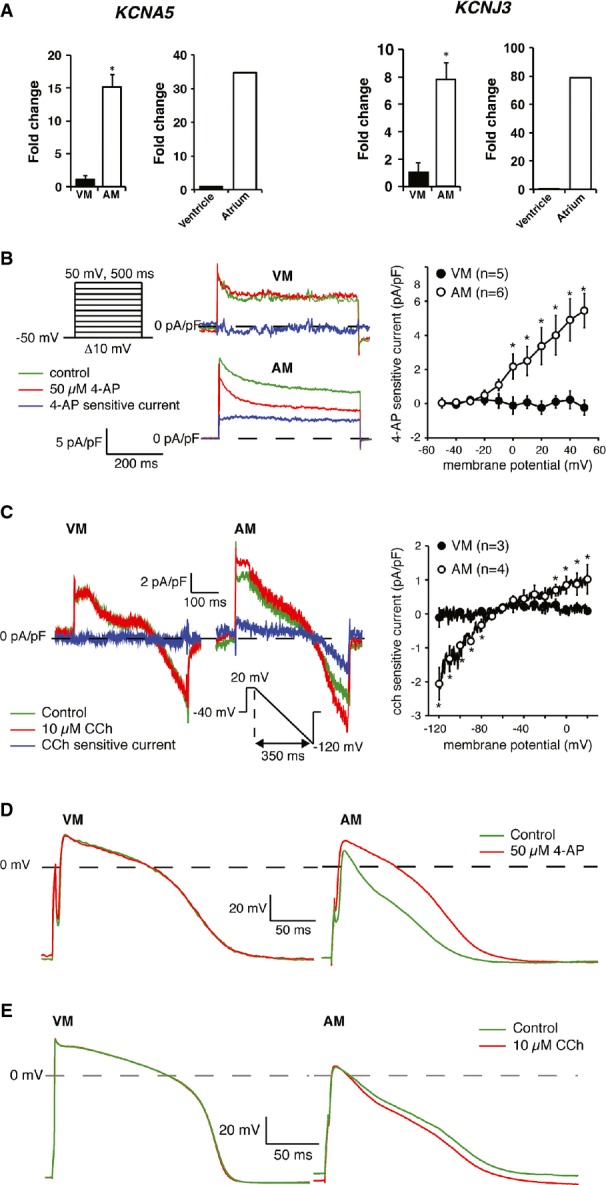
A Expression of KCNA5 (left) and KCNJ3 (right) in GFP+ pools of VM and AM CMs at day 31, as well as in ventricles and atria of human heart.
B, C Typical examples (left) and current–voltage relationships (right) of (B) IKur and (C) IK,ACh in VM and AM CMs.
D, E Representative APs of VM and AM at 1 Hz in response to (D) IKur block by 4-AP and (E) IK,ACh activation by CCh. AP parameters are shown in Supplementary Table S5.
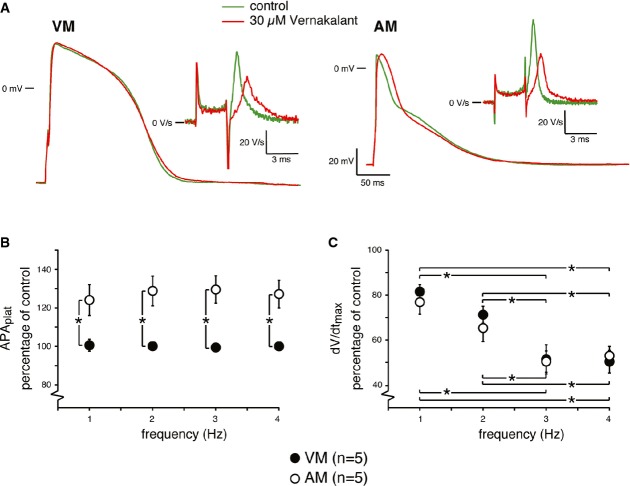
A Representative APs at 1 Hz of VM and AM CMs in response to vernakalant. Inset shows dV/dtmax.
B, C Average APAplat (B) and dV/dtmax (C)in the absence and presence of vernakalant at 1–4 Hz. AP parameters are shown in Supplementary Table S6. Abbreviations as in Figs3 and 6.
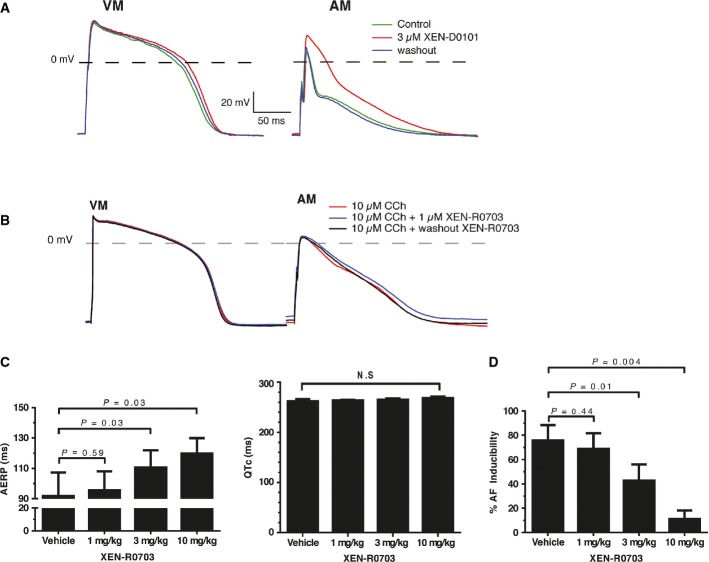
A Representative APs of VM and AM CMs in the absence, presence and following washout of 3 μmol/l XEN-D0101. AP parameters are shown in Supplementary Table S7.
B Representative APs (1 Hz) of VM and AM in the CCh, to activate IK,ACh and subsequent addition of XEN-R0703. AP parameters are shown in Supplementary Table S9.
C, D Experiments performed in RAP conscious dogs in the presence of vehicle or following 1, 3 and 10 mg/kg XEN-R0703 show (C) mean right AERP values (left), mean Van de Water's QTc (right) and (D) AF inducibility plotted as a function of dose.
References
-
- Barry PH, Lynch JW. Liquid junction potentials and small cell effects in patch-clamp analysis. J Membr Biol. 1991;121:101–117. - PubMed
-
- Beqqali A, Kloots J, Ward-van Oostwaard D, Mummery C, Passier R. Genome-wide transcriptional profiling of human embryonic stem cells differentiating to cardiomyocytes. Stem Cells. 2006;24:1956–1967. - PubMed
-
- Braam SR, Tertoolen L, van de Stolpe A, Meyer T, Passier R, Mummery CL. Prediction of drug-induced cardiotoxicity using human embryonic stem cell-derived cardiomyocytes. Stem Cell Res. 2010;4:107–116. - PubMed
Publication types
MeSH terms
Substances
Grants and funding
LinkOut - more resources
Full Text Sources
Other Literature Sources
Medical
Molecular Biology Databases
Miscellaneous
