. 2015 Feb 20;347(6224):870-874.
doi: 10.1126/science.1259591. Epub 2015 Feb 5.

Spatial navigation. Disruption of the head direction cell network impairs the parahippocampal grid cell signal

Affiliations

Spatial navigation. Disruption of the head direction cell network impairs the parahippocampal grid cell signal

Shawn S Winter et al. Science. .

Abstract

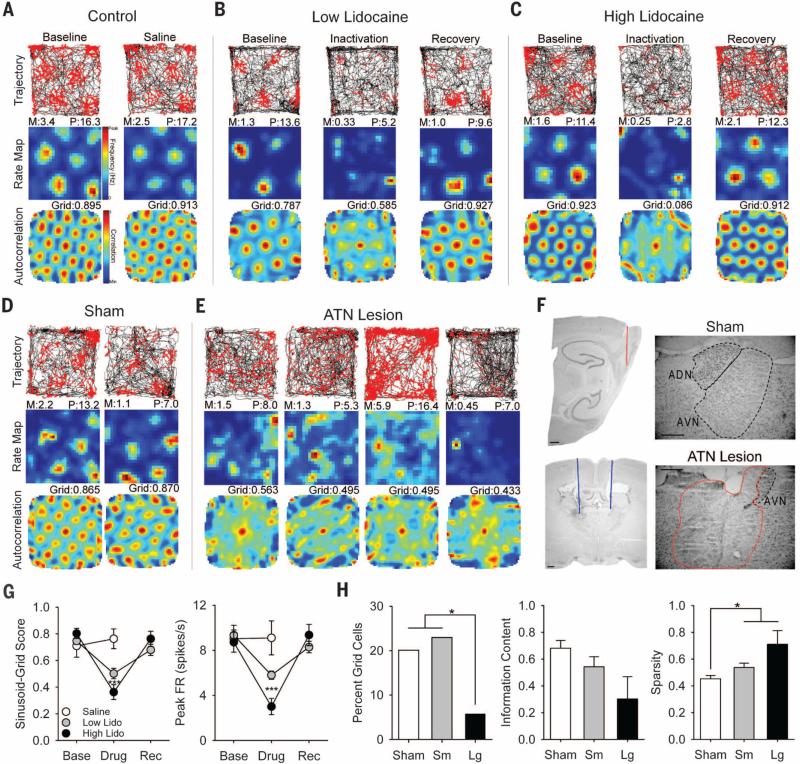
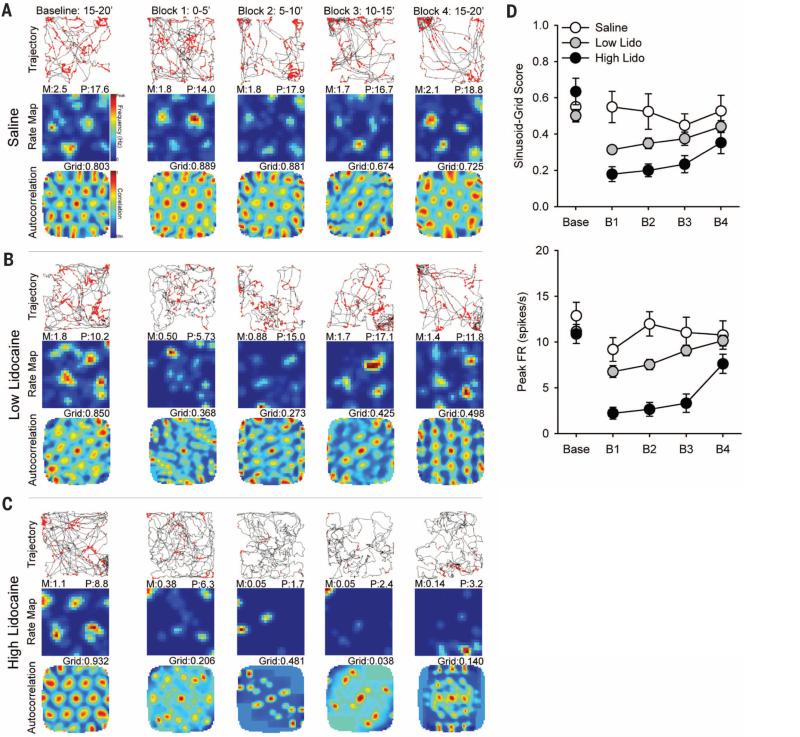
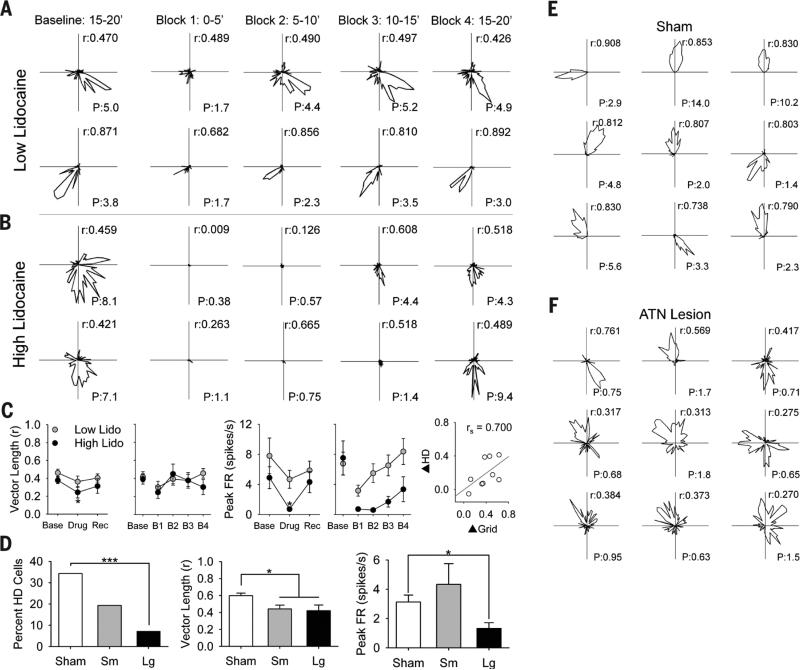
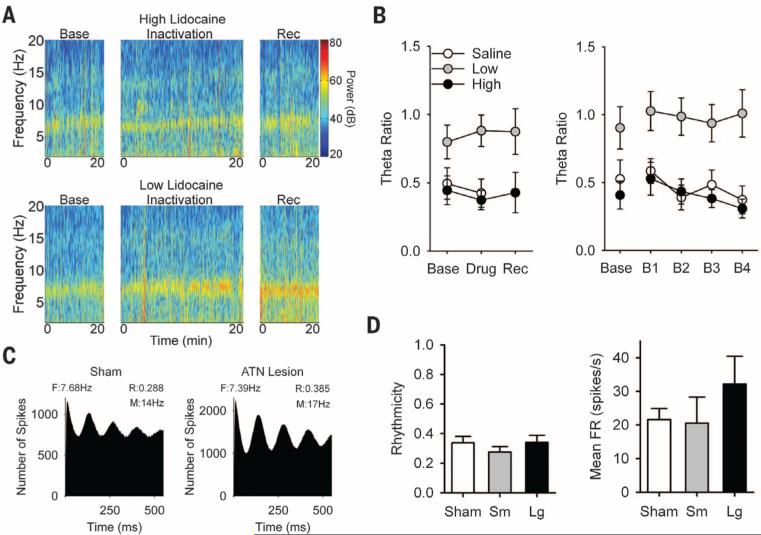
Navigation depends on multiple neural systems that encode the moment-to-moment changes in an animal's direction and location in space. These include head direction (HD) cells representing the orientation of the head and grid cells that fire at multiple locations, forming a repeating hexagonal grid pattern. Computational models hypothesize that generation of the grid cell signal relies upon HD information that ascends to the hippocampal network via the anterior thalamic nuclei (ATN). We inactivated or lesioned the ATN and subsequently recorded single units in the entorhinal cortex and parasubiculum. ATN manipulation significantly disrupted grid and HD cell characteristics while sparing theta rhythmicity in these regions. These results indicate that the HD signal via the ATN is necessary for the generation and function of grid cell activity.


Figures

Fig. 1
Fig. 1. Effects of ATN manipulation on grid cell activity
Grid cell response to (A) saline, (B) low-lidocaine, and (C) high-lidocaine infusions. Row 1: rat path and individual spikes (red dots). Row 2: smoothed firing rate map. Row 3: autocorrelation map. Column 1: baseline recording. Column 2: recording after infusion. Column 3: recording after ~1.5 hours of recovery. M, mean firing rate in spikes/s; P, peak firing rate in spikes/s, Grid, sinusoid-grid score. (D) Two grid cells from sham animals. (E) Four highest-scoring grid cells from ATN large-lesion animals. (F) Electrode track through the parahippocampal cortex (top left), guide cannulae placement (blue line) within ATN (bottom left), and representative ATN region from sham (top right) and ATN large lesion (bottom right) animals. Minimal healthy ATN tissue [specifically in anteroventral thalamic nucleus (AVN)] was observed in the lesioned group (healthy, black; lesioned, red). Only the right hemisphere is illustrated; however, this example is representative of bilateral damage in animals with ≥85% damage. Scale bars, 0.5 mm. (G) Data for sinusoid-grid score (left) and peak firing rate (right) measures, with asterisks indicating significant difference from baseline. (H) Data for percentage of grid cell (left), information content (bits/spike) (middle), and sparsity (right) measures. *P < 0.05; ***P < 0.001.
Fig. 2
Fig. 2. Time course of lidocaine inactivation
Grid cell response to (A) saline, (B) low-lidocaine, and (C) high-lidocaine infusions. Column 1: last 5 min of baseline recording session. Column 2: Block 1: 0 to 5 min from inactivation session. Column 3: Block 2: 5 to 10 min. Column 4: Block 3: 10 to 15 min. Column 5: Block 4: 15 to 20 min. Rows are the same as in Fig. 1. (D) Data for sinusoid-grid score (top) and peak firing rate (bottom) measures.
Fig. 3
Fig. 3. Effects of ATN manipulation on HD cell activity
HD cell response to (A) low- and (B) high-lidocaine doses for 5-min blocks within the inactivation session. Columns are the same as in Fig. 2. Each row is a different cell's polar plot of firing rate by direction. r, mean vector length; P, peak firing rate. (C) Data for mean vector length (left), peak firing rate (middle), and correlation between grid and HD signal change (right). Asterisks indicate significant difference from baseline. (D) Data for percentage of HD cells (left), mean vector length (middle), and peak firing rate (right) measures. Examples of nine HD cells from sham (E) and ATN large lesion (F) animals. HD cells from ATN lesion animals have less robust polar plots, with lower r and P. *P < 0.05; ***P < 0.001.
Fig. 4
Fig. 4. Effects of ATN manipulation on theta rhythmicity
(A) Local field potential displaying theta rhythmicity from high (top) and low (bottom) doses of lidocaine. (B) Data for the measure of theta ratio. (C) Autocorrelation of spike timing from inter-neurons of sham (left) and large ATN lesion (right) animals. F, Frequency (Hz); R, rhythmicity; M, mean firing rate. (D) Data for rhythmicity (left) and mean firing rate (right) measures. Inactivation or lesion of ATN did not disrupt theta rhythmicity in parahippocampal cortices.

References

    1. Moser EI, Kropff E, Moser M-B. Annu. Rev. Neurosci. 2008;31:69–89. - PubMed
    1. Taube JS. Annu. Rev. Neurosci. 2007;30:181–207. - PubMed
    1. Boccara CN, et al. Nat. Neurosci. 2010;13:987–994. - PubMed
    1. Hafting T, Fyhn M, Molden S, Moser M-B, Moser EI. Nature. 2005;436:801–806. - PubMed
    1. Burgess N, Barry C, O'Keefe J. Hippocampus. 2007;17:801–812. - PMC - PubMed

Publication types

MeSH terms