. 2015 Feb 20;347(6224):1257601.
doi: 10.1126/science.1257601.

Disease networks. Uncovering disease-disease relationships through the incomplete interactome

Affiliations

Disease networks. Uncovering disease-disease relationships through the incomplete interactome

Jörg Menche et al. Science. .

Abstract

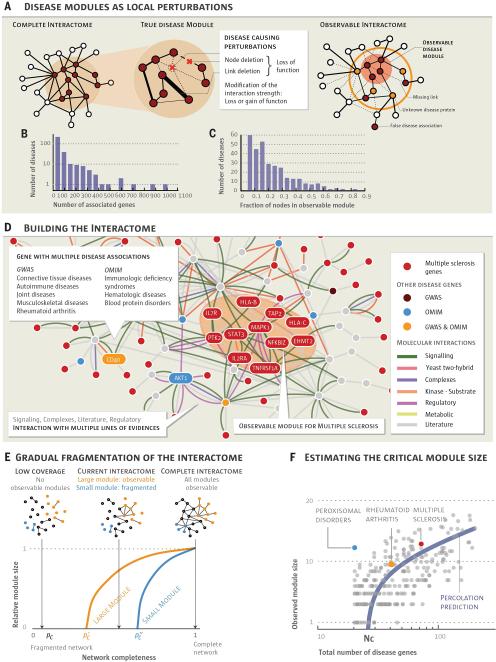
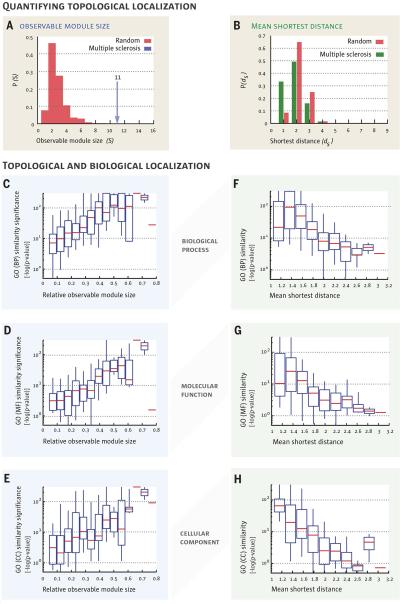
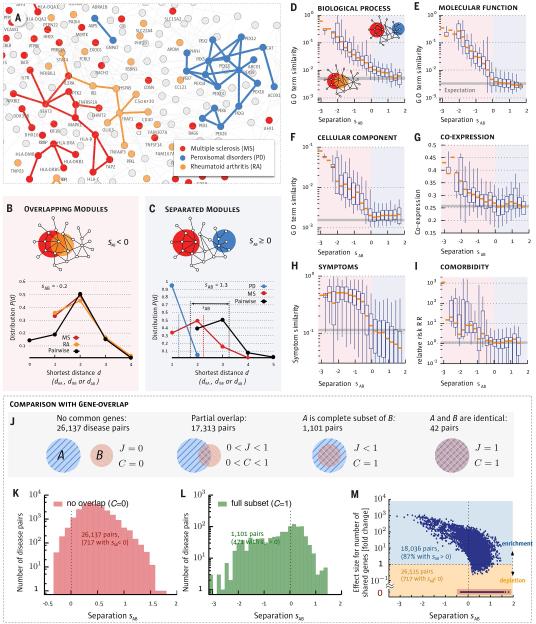
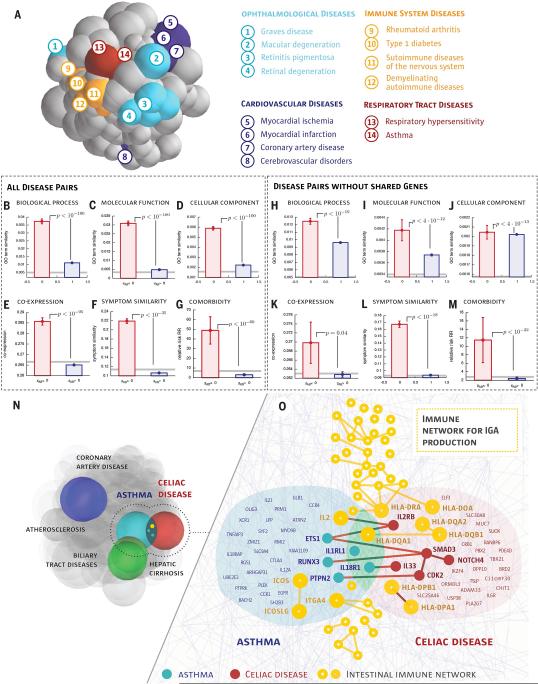
According to the disease module hypothesis, the cellular components associated with a disease segregate in the same neighborhood of the human interactome, the map of biologically relevant molecular interactions. Yet, given the incompleteness of the interactome and the limited knowledge of disease-associated genes, it is not obvious if the available data have sufficient coverage to map out modules associated with each disease. Here we derive mathematical conditions for the identifiability of disease modules and show that the network-based location of each disease module determines its pathobiological relationship to other diseases. For example, diseases with overlapping network modules show significant coexpression patterns, symptom similarity, and comorbidity, whereas diseases residing in separated network neighborhoods are phenotypically distinct. These tools represent an interactome-based platform to predict molecular commonalities between phenotypically related diseases, even if they do not share primary disease genes.


Figures

Fig. 1
Fig. 1. From the Human Interactome to Disease Modules
a, According to the disease module hypothesis, a disease represents a local perturbation of the underlying disease-associated subgraph. Such perturbations could represent the removal of a protein (e.g. by a nonsense mutation), the disruption of a protein-protein interaction, or modifications in the strength of an interaction. The complete disease module can be identified only in a full interactome map; the disease module observable to us captures a subset of this module, owing to data incompleteness. b, Distribution of the number of disease associated genes for 299 diseases. c, Distribution of the fraction of disease genes within the observable disease module. d, A small neighborhood of the interactome showing the biological nature of each physical interaction and the origin of the disease-gene associations used in our study (see also SM Sect. 1). Genes associated with multiple sclerosis are shown in red, the shaded area indicating their observable module, a connected subgraph consisting of eleven proteins. e, Schematic illustration of the predicted size of the observable disease modules (subgraphs) in function of network completeness. Large modules should be observable even for low network coverage; to discover smaller modules we need higher network completeness. f, Size of the observable module as a function of the total number of disease genes. The purple curve corresponds to the percolation based prediction (SM Sect. 6), indicating that diseases with Nd < Nc ≈ 25 genes do not have an observable disease module in the current interactome. Each gray point captures one of the 299 diseases.
Fig. 2
Fig. 2. Topological localization and biological similarity of disease genes
a, The size of the largest connected component S of proteins associated with the same disease shown for multiple sclerosis. The observed module size, S = 11, is significantly larger than the random expectation Srand = 2 ± 1. b, The distribution of the shortest distance of each disease protein to the next closest disease protein ds. For multiple sclerosis, P (ds) is significantly shifted compared to the random expectation, indicating that disease genes tend to agglomerate in each other's network neighborhood. c-h, The degree of the network-based localization of a disease, as measured by the relative size of its observable module si = Si/Nd and the mean shortest distance 〈ds〉, correlates strongly with the significance of the biological similarity of the respective disease genes. Using the gene ontology annotations, we determine for each disease how similar its associated genes are in terms of their biological processes (c,f), molecular function (d,g) and cellular component (e,h). Comparing the resulting values with random expectation we find that , the higher the the more localized a disease is topologically, i.e., the larger si or the shorter 〈ds〉 significance in the similarity of the associated genes.
Fig. 3
Fig. 3. Network Separation and Disease Similarity
a, A subnetwork of the full interactome highlighting the network-based relationship between disease genes associated with three diseases identified in the legend. b,c, Distance distributions for disease pairs that have topologically overlapping modules (sAB < 0, b) or topologically separated modules (sAB > 0, c). The plots show P(d) for the disease pairs shown in (a). d-i, Topological separation vs. biomedical similarity. d,e,f, GO term similarity; g, gene co-expression; h, symptom similarity for all disease pairs in function of their topological separation sAB. We highlight in red the region of overlapping disease pairs (sAB < 0) and in blue the separated disease pairs (sAB > 0). For symptom similarity we show the Cosine similarity (cAB = 0 if there are no shared symptoms between diseases A and B and cAB = 1 for diseases with identical symptoms). Comorbidity in (i) is measured by the relative risk RR (40). Bars in d-i indicate random expectation (SM Sect. 1): in d-g the expected value for a randomly chosen protein pair is shown. In h-i the mean value of all disease pairs is used. j-m, The interplay between gene-set overlap and the network- based relationships between disease pairs. j, The relationship between gene-sets A and B is captured by the overlap coefficient C =|A∩B|/min(|A|,|B|) and the Jaccard-index J=|A∩B|/|AB|. More than half (59%) of the disease pairs do not share genes (J = C = 0), hence, their relation cannot be uncovered based on shared genes. k, Distribution of sAB for disease pairs with no gene-overlap. We find that despite having disjoint gene sets, 717 diseases pairs have overlapping modules (sAB < 0). l, Distribution of sAB for disease pairs with complete gene-overlap (C = 1) shows a broad range of network-based relationships, including non-overlapping modules (sAB > 0). m, Fold-change (fc) of the number of shared genes compared to random expectation vs. sAB for all disease pairs. The 59% of all disease pairs without shared genes are highlighted with red back- ground. For 98% of all disease pairs that share at least one gene the gene-based overlap is larger than expected by chance. Despite this fact most (87%) of these disease pairs are separated in the network (sAB > 0). Conversely, a considerable number of pairs (717) without shared genes exhibit detectable network overlap (sAB < 0).
Fig. 4
Fig. 4. Network-based Model of Disease-Disease Relationship
a, To illustrate the uncovered network-based relationship between diseases, we place each disease in a 3D disease space, such that their physical distance to other diseases is proportional to 〈dAB〉 predicted by the interactome-based analysis. Diseases whose modules (spheres) overlap are predicted to have common molecular underpinnings. The colors capture several broad disease classes, indicating that typically diseases of the same class are located close to each other. There are exceptions, such as cerebrovascular disease, which is separated from other cardiovascular diseases, suggesting distinct molecular roots. b-g, Biological similarity shown separately for the predicted overlapping and non-overlapping disease pairs (see Fig. 3d-i for interpretation). Error bars indicate the standard error of the mean. Gray lines show random expectation, either for random protein pairs (b-e,h-k) or for a random disease pair (f,g,l,m), p−values denote the significance of the difference of the means according to a Mann-Whitney U test. h-m, Biological similarity for disease pairs that do not share genes (control set). n, Three overlapping disease pairs in the disease space. Coronary artery diseases and atherosclerosis, as well as hepatic cirrhosis and biliary tract diseases, are diseases with common classification, hence their disease modules overlap. Our methodology also predicts several overlapping disease modules of apparently unrelated disease pairs (Table S1), illustrated through asthma and celiac disease. o, A network- level map of the overlapping asthma-celiac disease network-neighborhood, with yellow we also show the IgA production pathway that plays a biological role in both diseases. We show the names of genes that are either shared by the two diseases or by the pathway, or interact across the modules.

References

    1. Buchanan M, Caldarelli G, De Los Rios P. Networks in cell biology. Cambridge University Press; 2010.
    1. Pawson T, Linding R. FEBS letters. 2008;582:1266. - PubMed
    1. Schadt EE. Nature. 2009;461:218. - PubMed
    1. Califano A, Butte AJ, Friend S, Ideker T, Schadt E. Nature Gen. 2012;44:841. - PMC - PubMed
    1. Zanzoni A, Soler-López M, Aloy P. FEBS letters. 2009;583:1759. - PubMed

Publication types