. 2015 Apr;185(4):1073-84.
doi: 10.1016/j.ajpath.2014.12.021. Epub 2015 Feb 18.

Role of miR-155 in the pathogenesis of herpetic stromal keratitis

Affiliations

Role of miR-155 in the pathogenesis of herpetic stromal keratitis

Siddheshvar Bhela et al. Am J Pathol. 2015 Apr.

Abstract

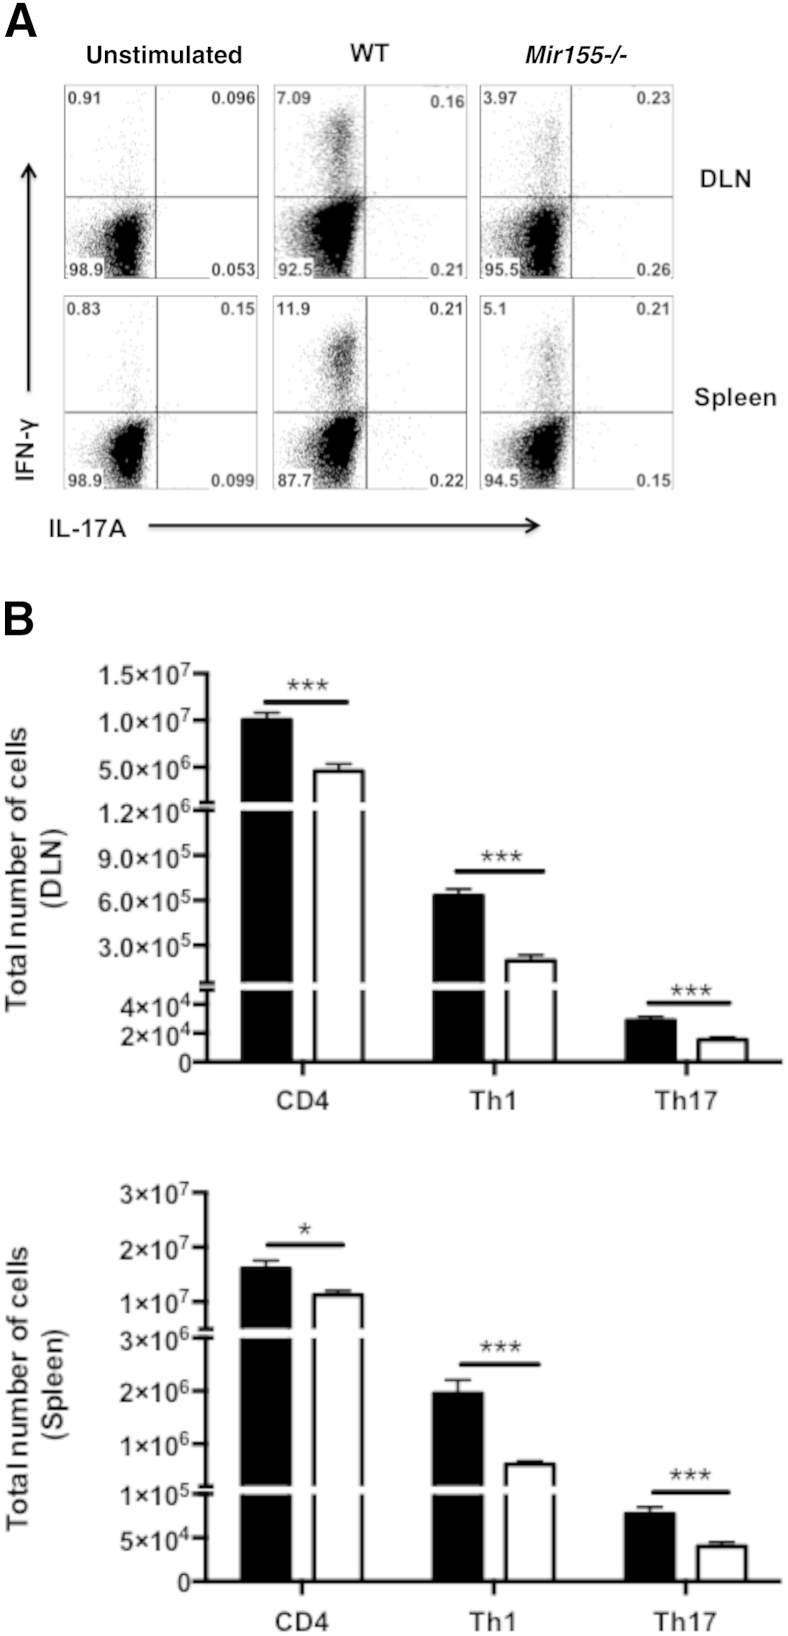
Ocular infection with herpes simplex virus 1 can result in a chronic immunoinflammatory stromal keratitis (SK) lesion that is a significant cause of human blindness. A key to controlling SK lesion severity is to identify cellular and molecular events responsible for tissue damage and to manipulate them therapeutically. Potential targets for therapy are miRNAs, but these are minimally explored especially in responses to infection. Here, we demonstrated that Mir155 expression was up-regulated after ocular herpes simplex virus 1 infection, with the increased Mir155 expression occurring mainly in macrophages and CD4(+) T cells and to a lesser extent in neutrophils. In vivo studies indicated that Mir155 knockout mice were more resistant to herpes SK with marked suppression of T helper cells type 1 and 17 responses both in the ocular lesions and the lymphoid organs. The reduced SK lesion severity was reflected by increased phosphatidylinositol-3,4,5-trisphosphate 5-phosphatase 1 and interferon-γ receptor α-chain levels in activated CD4(+) T cells in the lymph nodes. Finally, in vivo silencing of miR-155 by the provision of antagomir-155 nanoparticles to herpes simplex virus 1-infected mice led to diminished SK lesions and corneal vascularization. In conclusion, our results indicate that miR-155 contributes to the pathogenesis of SK and represents a promising target to control SK severity.


Figures

Figure 1
Figure 1
Expression of miR-155 after HSV-1 infection. A: WT mice were infected with HSV-1 RE, and corneas were collected and pooled for miRNA analysis by RT-qPCR to measure the expression of miR-155 at days 2, 7, and 15 after HSV-1 infection. The expression levels of miR-155 were normalized to SnoRNA202 by using the ΔCt calculation. Relative expression was calculated with the 2−ΔΔCt formula. miR-155 levels in mock-infected mice were set to 1 and used for relative fold up-regulation. B: miR-155 expression was measured by RT-qPCR in sorted neutrophils, macrophages, and CD4+ T cells from WT-infected corneas at day 15 after infection. CD4+ T cells were isolated from the lymph nodes of Mir155−/− mice at day 15 after HSV-1 infection and served as a negative control. The expression levels of miR-155 were normalized to SnoRNA202 by using the ΔCt calculation. Relative expression was calculated with the 2−ΔΔCt formula. Data are expressed as means ± SEM. n = 9 mice per group in three independent experiments, each sample is representative of three corneas (A); n = 15 mice in two independent experiments (B). Statistical significance was calculated by one-way analysis of variance with Tukey's multiple comparison tests. P ≤ 0.05, ∗∗P ≤ 0.01, and ∗∗∗P ≤ 0.001. HSV-1, herpes simplex virus 1; RT-qPCR, quantitative real-time RT-PCR; SnoRNA202, small nucleolar RNA 202; WT, wild-type.
Figure 2
Figure 2
Mir155−/− mice are resistant to SK. C57BL/6 and Mir155−/− mice ocularly infected with 1× 104 PFU of HSV-1 RE were divided into groups. One group of WT mice received IVIGs i.p. at day 4 after infection (WT D4 IVIG). One group of Mir155−/− mice received IVIG at day 4 after infection (Mir155−/− D4 IVIG), and one group of WT mice received no treatment (WT no IVIG). Disease severity and immune parameters were evaluated at day 15 after infection. A: SK lesion severity and angiogenesis at day 15 after infection are shown. The experiment was repeated three times. B: Representative H&E-stained corneal sections from WT (WT D4 IVIG) and Mir155−/− (Mir155−/− D4 IVIG) mice collected on day 15 after infection. C and D: Mice were sacrificed on day 15 after infection, and corneas were harvested and pooled groupwise for the analysis of various cell types. C: Representative FACS plots for corneal infiltrating total CD4+ T cells. Intracellular staining was conducted to quantify Th1 and Th17 cells by stimulating them with PMA/ionomycin. D: Representative plots (left) show percentage of CD4+ cells producing IFN-γ or IL-17A after stimulation with PMA/ionomycin in the cornea of infected WT (WT D4 IVIG; black bars) and Mir155−/− (Mir155−/− D4 IVIG; white bars) mice. Plots shown were gated on CD4+ T cells. The bar graph (right) represents total numbers of corneal infiltrating CD4+ T cells, Th1, and Th17 cells in the corneas of WT (WT D4 IVIG) and Mir155−/− (Mir155−/− D4 IVIG) mice. Data are expressed as means ± SEM. n = 8 to 12 mice per group in three independent experiments (C and D). Statistical significance was analyzed by one-way analysis of variance, with Tukey's multiple comparison tests (A) and unpaired Student's t-test (D). ∗∗P ≤ 0.01, and ∗∗∗P ≤ 0.001. D4, day 4; FACS, fluorescence-activated cell sorter; H&E, hematoxylin and eosin; HSV-1, herpes simplex virus 1; IFN-γ, interferon-γ; IVIG, intravenous immunoglobulin; PFU, plaque-forming unit; PMA, phorbol 12-myristate 13-acetate; SK, stromal keratitis; SSC, side scatter; Th1, T helper cell type 1; Th17, T helper cell type 17; WT, wild-type.
Figure 3
Figure 3
Mir155−/− mice exhibit reduced frequencies and numbers of Th1 and Th17 cells in DLNs and spleen after HSV-1 infection. C57BL/6 and Mir155−/− mice were ocularly infected with 1× 104 PFU of HSV-1 RE. Both groups of mice received IVIGs i.p. at day 4 after infection. Mice were sacrificed on day 14 after infection, and single-cell suspensions of the individual spleen and DLNs were prepared. A: Representative FACS plots show percentage of CD4+ T cells producing IFN-γ or IL-17A after stimulation with PMA/ionomycin in the infected mice from the DLNs and spleen. Plots shown were gated on CD4+ T cells. B: The bar graph represents total numbers of CD4+ T cells, Th1, and Th17 cells in the DLNs and spleen of WT (WT D4 IVIG; black bars) and Mir155−/− (Mir155−/− D4 IVIG; white bars) mice. Data are expressed as means ± SEM. n = 5 to 6 mice per group of three independent experiments. Statistical significance was analyzed by the Student's t-test (unpaired). P ≤ 0.05, ∗∗∗P ≤ 0.001. D4, day 4; DLN, draining lymph node; FACS, fluorescence-activated cell sorter; HSV-1, herpes simplex virus 1; IFN-γ, interferon-γ; IVIG, intravenous immunoglobulin; PFU, plaque-forming unit; PMA, phorbol 12-myristate 13-acetate; Th1, T helper cell type 1; Th17, T helper cell type 17; WT, wild-type.
Figure 4
Figure 4
Mir155−/− CD4+ T cells show defective proliferation but not survival. C57BL/6 and Mir155−/− mice were ocularly infected with 1× 104 PFU of HSV-1 RE. Both groups of mice received IVIGs i.p. at day 4 after infection. Mice were sacrificed on day 14 after infection, and single-cell suspensions of the individual DLNs and subpools of corneas were prepared and stained for Ki-67 and Annexin V. A: Representative FACS plots, frequencies, and cell numbers of Ki-67+ CD4+ T cells in the cornea of WT (WT D4 IVIG) and Mir155−/− (Mir155−/− D4 IVIG) mice. Plots shown were gated on CD4+ T cells. B: Representative FACS plots, frequencies, and cell numbers of Ki-67+ CD4+ T cells in the DLN of WT (WT D4 IVIG) and Mir155−/− (Mir155−/− D4 IVIG) mice. Plots shown were gated on CD4+ T cells. C: Representative FACS plots and frequencies of Annexin V+ CD4+ CD44hi T cells in the DLNs of WT (WT D4 IVIG) and Mir155−/− (Mir155−/− D4 IVIG) mice. Plots shown were gated on live CD44hi CD4+ T cells. Data are expressed as means ± SEM. n = 6 to 8 mice per group in two independent experiments. Statistical significance was analyzed by the Student's t-test (unpaired). P ≤ 0.05, ∗∗P ≤ 0.01, and ∗∗∗P ≤ 0.001. D4, day 4; DLN, draining lymph node; FACS, fluorescence-activated cell sorter; HSV-1, herpes simplex virus 1; IVIG, intravenous immunoglobulin; PFU, plaque-forming unit; WT, wild-type.
Figure 5
Figure 5
Preventive administration of antagomir-155 diminishes SK lesion severity and cellular infiltration. C57BL/6 mice were ocularly infected with 1× 104 PFU of HSV-1 RE. A: Antagomir-155/scrambled seq (5′-AUUUCAUGACUGUUACUGACCU-3′) nanoparticle treatment was given subconjunctively. Disease severity and immune parameters were analyzed at day 14 p.i. B: SK lesion severity and angiogenesis at day 14. C: Representative H&E-stained corneal sections of scrambled seq–treated and antagomir-155–treated mice were collected on day 14 p.i. Mice were sacrificed on day 14 p.i., and corneas were harvested and pooled groupwise for analysis of various cell types. D: The frequency and total cell number of CD4+ T cells and neutrophils (CD45+ CD11b+ Ly6G+) (plot was gated on CD45+ cells) infiltrated in the corneas of control (scrambled seq) and antagomir-155–treated mice. Data are expressed as means ± SEM. n = 8 to 12 mice per group of two independent experiments. Statistical significance was analyzed by the Student's t-test (unpaired). ∗∗∗P ≤ 0.001. H&E, hematoxylin and eosin; HSV-1, herpes simplex virus 1; PFU, plaque-forming unit; p.i., after infection; seq, sequence; SK, stromal keratitis; SSC, side scatter.
Figure 6
Figure 6
Antagomir-155 treatment reduces cytokine and chemokine levels in corneas of HSV-1–infected mice. C57BL/6 mice were ocularly infected with 1× 104 PFU of HSV-1 RE. The antagomir-155/scrambled seq nanoparticle treatment was given subconjunctively every other day starting day 1 after infection. Mice were sacrificed on day 14 after infection, and corneal extracts were collected for measuring inflammatory factors, using RT-qPCR. A: Relative fold change in mRNA expression of the proinflammatory cytokines IL-6, IL-1β, IFN-γ, and IL-17 was examined and compared between control (scrambled seq) and antagomir-155–treated mice on day 14 after infection. B: Relative fold change in mRNA expression of chemokines CCL-2 and CXCL-1 was examined and compared between control (scrambled seq) and antagomir-155–treated mice on day 14 after infection. The expression levels of different cytokines and chemokines were normalized to β-actin by using the ΔCt calculation. Relative expression was calculated with the 2−ΔΔCt formula. mRNA levels for the different cytokines and chemokines in mock-infected mice were set to 1 and used for relative fold up-regulation. Data are expressed as means ± SEM. n = 12 mice per group of two independent experiments; each sample is representative of four corneas. Statistical significance was analyzed by the Student's t-test (unpaired). P ≤ 0.05, ∗∗P ≤ 0.01. CCL-2, chemokine (C-C motif) ligand 2; CXCL-1, chemokine (C-X-C motif) ligand 1; HSV-1, herpes simplex virus 1; IFN-γ, interferon-γ; PFU, plaque-forming unit; RT-qPCR, quantitative real-time RT-PCR; seq, sequence.
Figure 7
Figure 7
Increased expression of Ship1 and IFN-γRα in Mir155−/− activated CD4+ T cells. C57BL/6 and Mir155−/− mice ocularly infected with 1× 104 PFU of HSV-1 RE. Both groups of mice received IVIGs i.p. at day 4 after infection. Mice were sacrificed on day 14 after infection, and single-cell suspensions of the individual cervical DLNs were stained for CD4+, CD44, and CD62L. Cells were then sorted as CD4+ CD44hi CD62Llo (activated) and CD4+ CD44lo CD62Lhi (naive) from both the HSV-1–infected WT (WT D4 IVIG) and Mir155−/− (Mir155−/− D4 IVIG) mice at day 14 after infection. A: miR-155 expression by RT-qPCR in sorted naive and activated cells. Expression levels of miR-155 were normalized to SnoRNA202 by using the ΔCt calculation. Relative expression was calculated with the 2−ΔΔCt formula. B: Expression of Ship1 mRNA in sorted naive and activated cells by RT-qPCR. C: Expression of IFN-γRα in sorted naive and activated cells by RT-qPCR. Expression levels of Ship1 and IFN- γRα were normalized to β-actin by using the ΔCt calculation. Relative expression was calculated with the 2−ΔΔCt formula. Data are expressed as means ± SEM. n = 5 to 6 mice per group of two independent experiments. Statistical significance was calculated by one-way analysis of variance with Tukey's multiple comparison tests. P ≤ 0.05, ∗∗P ≤ 0.01. D4, day 4; DLN, draining lymph node; FACS, fluorescence-activated cell sorting; HSV-1, herpes simplex virus 1; IFN-γRα, interferon-γ receptor α-chain; IVIG, intravenous immunoglobulin; PFU, plaque-forming unit; RT-qPCR; quantitative real-time RT-PCR; Ship1, phosphatidylinositol-3,4,5-trisphosphate 5-phosphatase 1; SnoRNA202, small nucleolar RNA 202; WT, wild-type.
Figure 8
Figure 8
Illustration of miR-155–induced regulation of inflammatory response during HSV-1 infection. Left panel: Outcome (SK) in HSV-1–infected WT (Mir155+/+) mice. HSV-1 infection leads to ocular infiltration of Th1 and Th17 cells, the major orchestrators of SK. miR-155 degrades IFN-γRα, Ship1, and conceivably other targets that cause increased numbers of these cells, along with their heightened effector function. This increased proinflammatory response leads to severe SK. Right panel: Outcome (SK) in HSV-1–infected Mir155−/− mice. HSV-1 infection of Mir155−/− mice leads to higher levels of IFN-γRα and Ship1, resulting in reduced numbers and functionality of Th1 and Th17 cells, which results in attenuation of SK lesions. HSV-1, herpes simplex virus 1; IFN-γRα, interferon-γ receptor α; Ship1, phosphatidylinositol-3,4,5-trisphosphate 5-phosphatase 1; SK, stromal keratitis; Th1, T helper cell type 1; Th17, T helper cell type 17; WT, wild-type.

References

    1. Biswas P.S., Rouse B.T. Early events in HSV keratitis–setting the stage for a blinding disease. Microbes Infect. 2005;7:799–810. - PubMed
    1. Niemialtowski M.G., Rouse B.T. Predominance of Th1 cells in ocular tissues during herpetic stromal keratitis. J Immunol. 1992;149:3035–3039. - PubMed
    1. Thomas J., Gangappa S., Kanangat S., Rouse B.T. On the essential involvement of neutrophils in the immunopathologic disease: herpetic stromal keratitis. J Immunol. 1997;158:1383–1391. - PubMed
    1. Daheshia M., Kanangat S., Rouse B.T. Production of key molecules by ocular neutrophils early after herpetic infection of the cornea. Exp Eye Res. 1998;67:619–624. - PubMed
    1. Bauer D., Mrzyk S., van Rooijen N., Steuhl K.P., Heiligenhaus A. Macrophage-depletion influences the course of murine HSV-1 keratitis. Curr Eye Res. 2000;20:45–53. - PubMed

Publication types

MeSH terms