Review
. 2015 May;17(3):513-24.
doi: 10.1208/s12248-015-9722-z. Epub 2015 Feb 21.

Does the Recent Growth of Aquaculture Create Antibiotic Resistance Threats Different from those Associated with Land Animal Production in Agriculture?

Affiliations
Review

Does the Recent Growth of Aquaculture Create Antibiotic Resistance Threats Different from those Associated with Land Animal Production in Agriculture?

Hansa Y Done et al. AAPS J. 2015 May.

Erratum in

Abstract

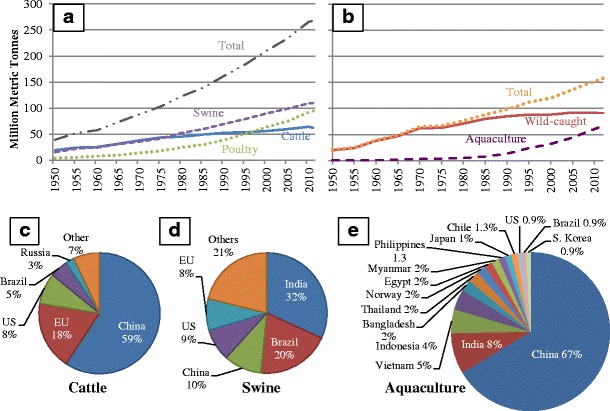
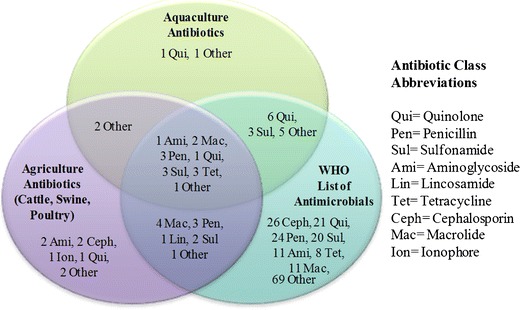
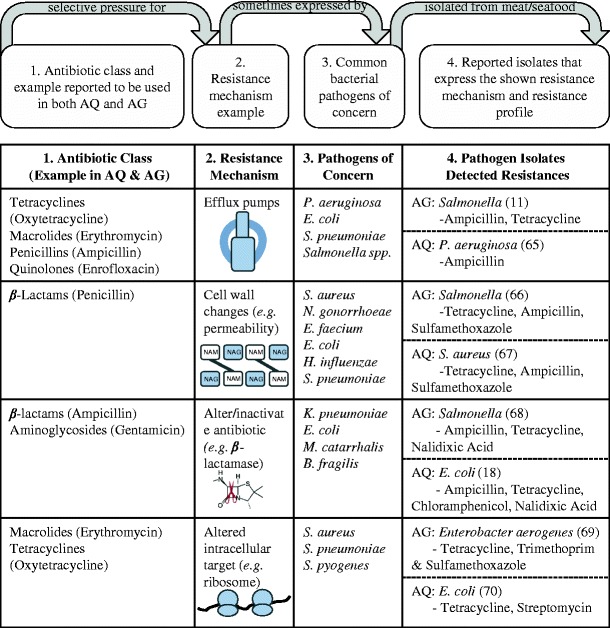
Important antibiotics in human medicine have been used for many decades in animal agriculture for growth promotion and disease treatment. Several publications have linked antibiotic resistance development and spread with animal production. Aquaculture, the newest and fastest growing food production sector, may promote similar or new resistance mechanisms. This review of 650+ papers from diverse sources examines parallels and differences between land-based agriculture of swine, beef, and poultry and aquaculture. Among three key findings was, first, that of 51 antibiotics commonly used in aquaculture and agriculture, 39 (or 76%) are also of importance in human medicine; furthermore, six classes of antibiotics commonly used in both agriculture and aquaculture are also included on the World Health Organization's (WHO) list of critically important/highly important/important antimicrobials. Second, various zoonotic pathogens isolated from meat and seafood were observed to feature resistance to multiple antibiotics on the WHO list, irrespective of their origin in either agriculture or aquaculture. Third, the data show that resistant bacteria isolated from both aquaculture and agriculture share the same resistance mechanisms, indicating that aquaculture is contributing to the same resistance issues established by terrestrial agriculture. More transparency in data collection and reporting is needed so the risks and benefits of antibiotic usage can be adequately assessed.


Figures

Fig. 1
Fig. 1
Animal production values in 1950–2011 and top producing countries of cattle, swine, and aquaculture. a 1950–2011 world production of swine (purple), cattle (blue), poultry (green), and total for all three (gray). b 1950–2011 world production of total seafood (orange), wild-caught seafood (red), and aquacultured seafood (purple). c Top 5 cattle-producing countries in 2013, counting only beginning stocks by head. d Top 5 swine-producing countries in 2013, counting only beginning stocks by head. e Top 15 aquaculture-producing countries in 2010 by percentage of total world production (–22)
Fig. 2
Fig. 2
Antibiotic classes sold annually for use by animal production industries in the USA and EU (25 countries) in 2011. Total sold in the USA is approximately 13.5 million kg. Total volume sold in the EU is approximately 8.4 million kg (27,28)
Fig. 3
Fig. 3
Common antibiotics used in aquaculture and agriculture and included in the 2011 WHO antimicrobials list. Diagram is displayed as number of antibiotics followed by antibiotic class. Aquaculture antibiotics include the ones reported to be used by top 15 aquaculture-producing countries. Agricultural antibiotics include the ones used in cattle, swine, and poultry farming. WHO antibiotics are the ones on the antimicrobial list in all three labels: “critically important,” “highly important,” and “important” (,,,–48). Aquaculture: qui—sarafloxacin; other—miloxacin. WHO: excludes antibiotics used solely for veterinary use. See reference (44) for full list. Agriculture: ami—apramycin*, neomycin; ceph—cefquinome*, ceftiofur*; ion—monensin; qui—marbofloxacin*; other—virginiamycin*, narasin. Agriculture and Aquaculture: other—tiamulin, ormetoprim. Agriculture and WHO: mac—kanamycin, oleandomycin, spectinomycin, streptomycin; pen—cloxacillin, dicloxacillin, oxacillin; lin—lincomycin; sul—sulfamethazine, sulfathiazole; other—tylosin. Aquaculture and WHO: qui—norfloxacin, ciprofloxacin, pefloxacin, oxolinic acid, nalidixic acid, flumequine; sul—sulfadiazine, sulfamerazine, sulfamethoxazole; other—chloramphenicol, colistin, florfenicol, furazolidone, thiamphenicol. Aquaculture, Agriculture, and WHO: ami—gentamicin; mac—spiramycin, erythromycin; pen—amoxicillin, ampicillin, penicillin G; qui—enrofloxacin; sul—sulfadimethoxine, sulfadimidine, sulfapyridine; tet—chlortetracycline, oxytetracycline, tetracycline; other—trimethoprim. *These agriculture antibiotics are included in the WHO list but are reserved for veterinary use only
Fig. 4
Fig. 4
Resistance mechanism development in agriculture and aquaculture. Top panel explains how each row exhibits a resistance mechanism. Each row in chart is an example via a different resistance mechanism. Each resistance mechanism can allow bacteria to be resistant to many classes of antibiotics. Antibiotics reported to be used in agriculture and aquaculture (column 1) can select for resistance mechanisms (column 2) that are sometimes expressed by common pathogens (column three), such as ones listed here as examples. Column 4 shows bacterial isolates reported in the literature that are resistant to the stated antibiotics and have been genetically shown to express the resistance mechanism in that row. AG indicates isolates from terrestrial agriculture, AQ indicates isolates from aquaculture. Reference numbers for the publications are noted with the bacterial strain. Strain genera are as follows: P, Pseudomonas; E, Escherichia; S, Streptococcus pneumoniae/pyogenes or Staphylococcus aureus; N, Neisseria; E, Enterococcus; H, Haemophilus; K, Klebsiella; M, Moraxella; and B, Bacillus. Resistance mechanisms from Giedraitiene et al., 2011 (63)
Fig. 5
Fig. 5
2007 density maps of cattle, swine, poultry, and combined values of production and 2005 number of aquaculture farms in the USA. 2007 US density of a cattle, b swine, c poultry, and d combined production. ac Animal density by county. a Cattle density level per area indicated: very high ≥ 17,400; high = 7300–17,400; moderate = 2175–7299; some ≤ 2175; none = 0. b Swine density level: very high ≥ 48,500; high = 19,000–48,500; moderate = 9500–18,999; some ≤ 9500; none = 0. c Poultry density level: very high ≥ 2.75 million; high = 1–2.75 million; moderate = 350,000–999,000; some ≤ 350,000; none = 0. d Combined production, the total number of livestock across different animal types was calculated using the US Department of Agriculture definition of a livestock unit, which is 1000 lbs (454 kg) of live weight. County density level (in livestock units per area indicated): very high ≥ 13,200; high = 5200–13,200; moderate = 2000–5199; some ≤ 2000; none = 0. e 2005 US density of aquaculture production by number of reported farms, with percentage of farm being freshwater or saltwater indicated in blue pie charts. States without a pie chart contain fully freshwater operations (74,75)

References

    1. Davies J. Where have all the antibiotics gone? Can J Infect Dis Med Microbiol. 2006;17(5):287. - PMC - PubMed
    1. Zhang L, Kinkelaar D, Huang Y, Li Y, Li X, Wang HH. Acquired antibiotic resistance: are we born with it? Appl Environ Microbiol. 2011;77(89):7134–41. doi: 10.1128/AEM.05087-11. - DOI - PMC - PubMed
    1. Nikaido H. Multidrug resistance in bacteria. Annu Rev Biochem. 2009;78:119–46. doi: 10.1146/annurev.biochem.78.082907.145923. - DOI - PMC - PubMed
    1. WHO. Antimicrobial Resistance—Global Report on Surveillance. World Health Organization. 2014. http://apps.who.int/iris/bitstream/10665/112642/1/9789241564748_eng.pdf. Accessed 24 Nov 2014.
    1. Mathew AG, Cissell R, Liamthong S. Antibiotic resistance in bacteria associated with food animals: a United States perspective of livestock production. Foodborne Pathog Dis. 2007;4(89):115–33. doi: 10.1089/fpd.2006.0066. - DOI - PubMed

Publication types

LinkOut - more resources