. 2015 May:59:26-37.
doi: 10.1016/j.jaut.2015.01.011. Epub 2015 Feb 17.

Systems biologic analysis of T regulatory cells genetic pathways in murine primary biliary cirrhosis

Affiliations

Systems biologic analysis of T regulatory cells genetic pathways in murine primary biliary cirrhosis

Yin-Hu Wang et al. J Autoimmun. 2015 May.

Abstract

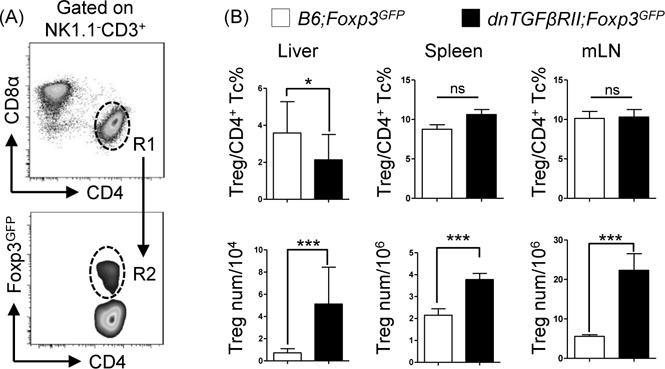
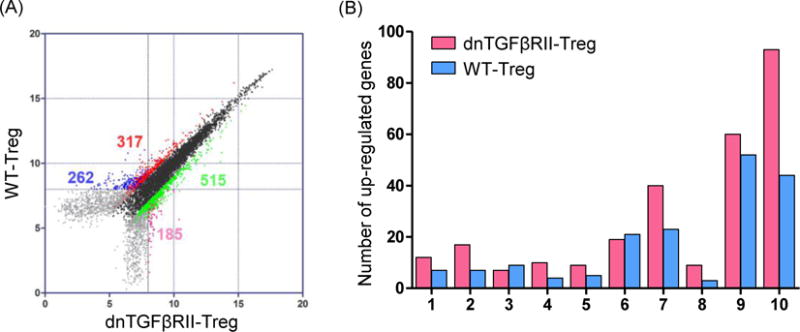
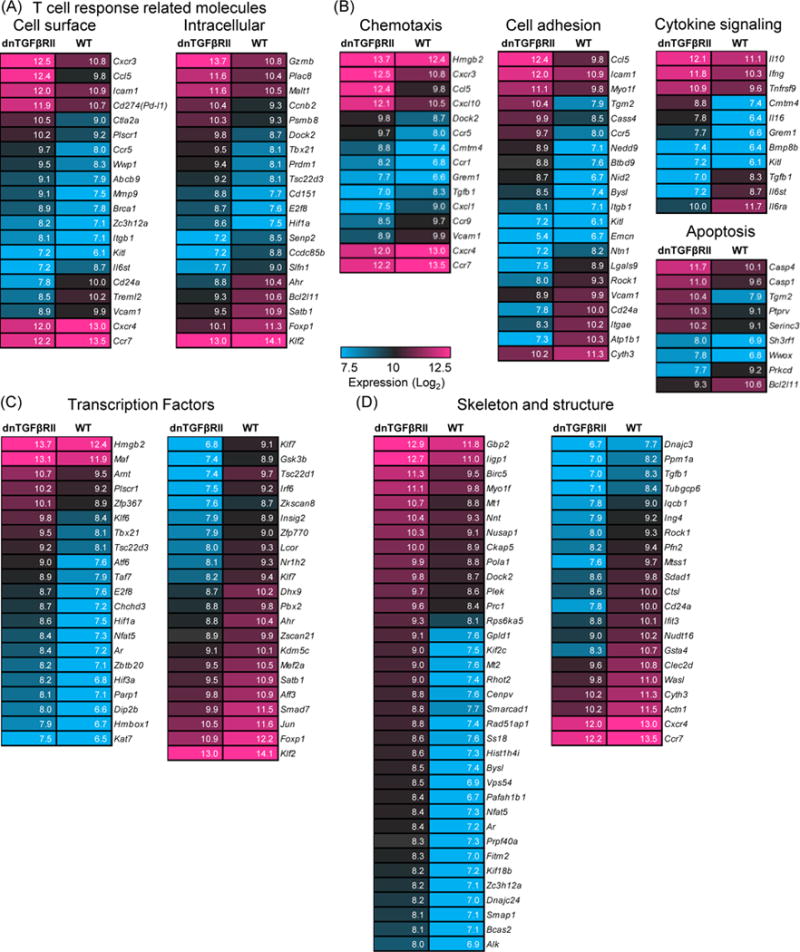
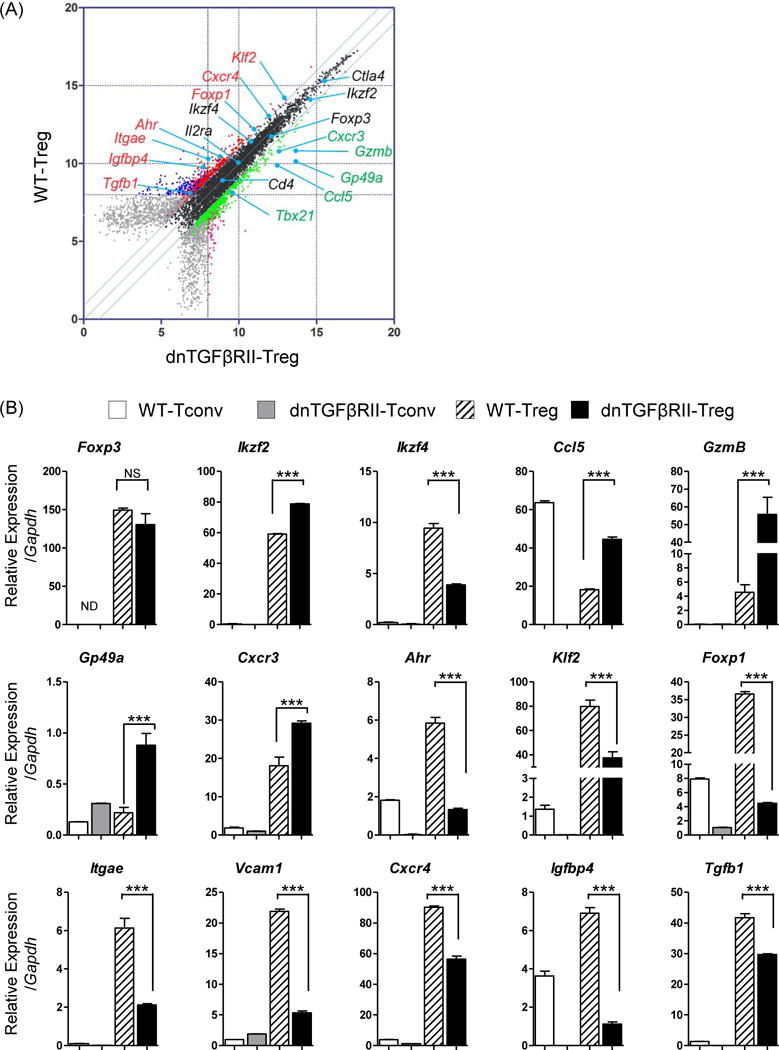
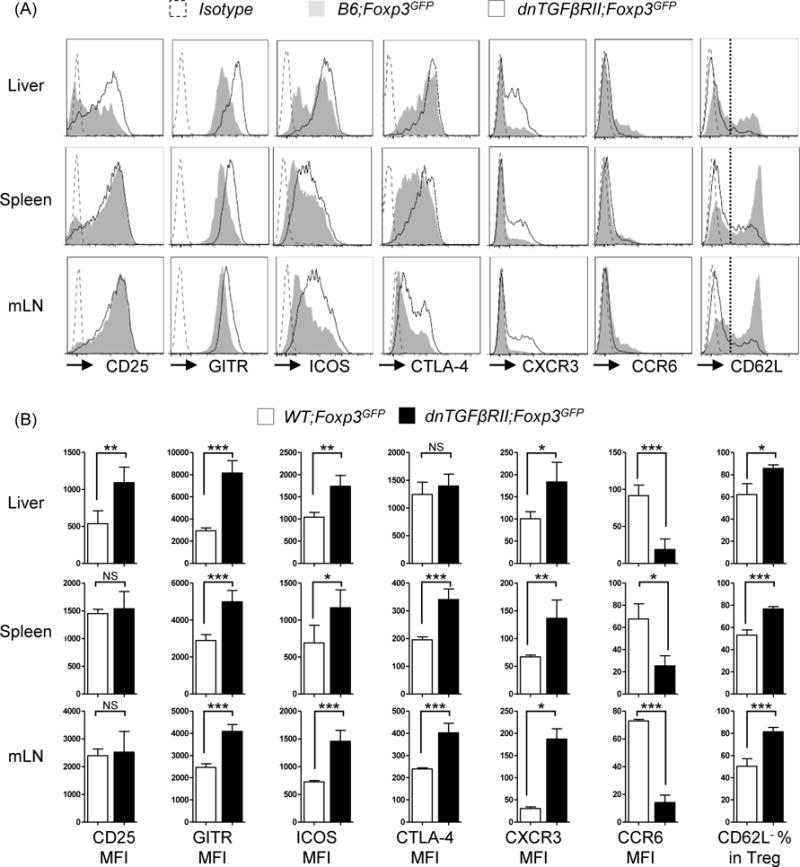
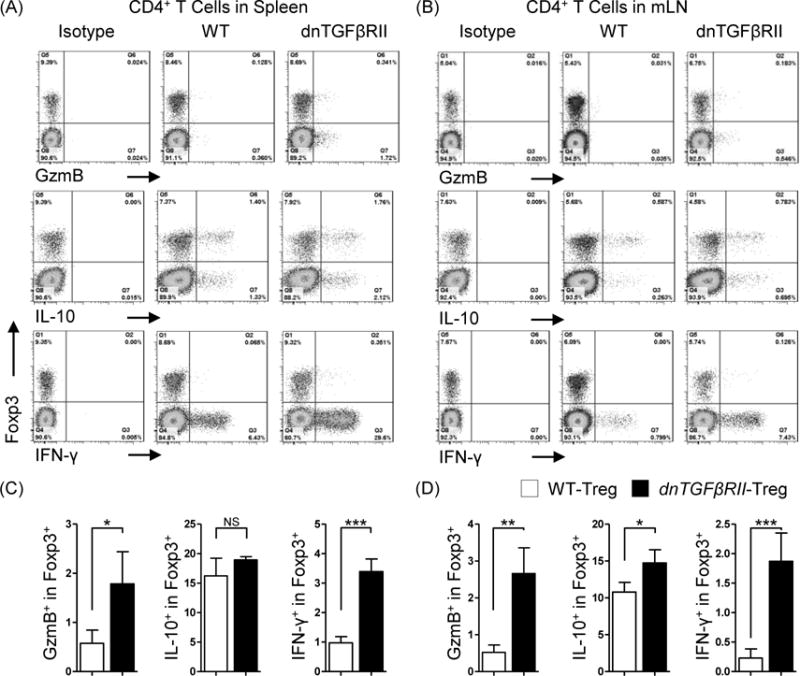
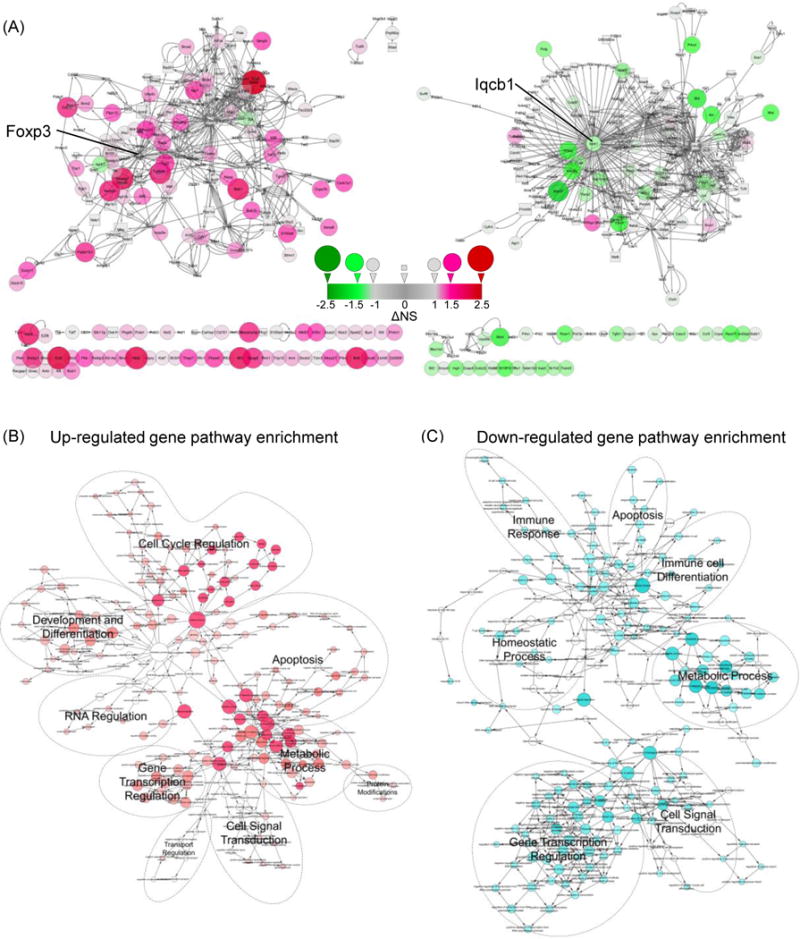
CD4(+)Foxp3(+) regulatory T cells (Tregs) play a non-redundant role in control of excessive immune responses, and defects in Tregs have been shown both in patients and murine models of primary biliary cirrhosis (PBC), a progressive autoimmune biliary disease. Herein, we took advantage of a murine model of PBC, the dominant negative transforming growth factor β receptor II (dnTGFβRII) mice, to assess Treg genetic defects and their functional effects in PBC. By using high-resolution microarrays with verification by PCR and protein expression, we found profound and wide-ranging differences between dnTGFβRII and normal, wild type Tregs. Critical transcription factors were down-regulated including Eos, Ahr, Klf2, Foxp1 in dnTGFβRII Tregs. Functionally, dnTGFβRII Tregs expressed an activated, pro-inflammatory phenotype with upregulation of Ccl5, Granzyme B and IFN-γ. Genetic pathway analysis suggested that the primary effect of loss of TGFβ pathway signaling was to down regulate immune regulatory processes, with a secondary upregulation of inflammatory processes. These findings provide new insights into T regulatory genetic defects; aberrations of the identified genes or genetic pathways should be investigated in human PBC Tregs. This approach which takes advantage of biologic pathway analysis illustrates the ability to identify genes/pathways that are affected both independently and dependent on abnormalities in TGFβ signaling. Such approaches will become increasingly useful in human autoimmunity.

Keywords: Cholangitis; Primary biliary cirrhosis; Regulatory T cells; Transcription profile and pathway analysis.


Figures

Figure 1
Figure 1
Frequency and total cell numbers of regulatory T cells in dnTGFβRII;Foxp3GFP mice did not demonstrate quantitative defects compared with WT;Foxp3GFP mice. (A) Gate strategy defining NK1.1CD3+CD4+ total classic CD4+ T cells (R1), NK1.1CD3+CD4+Foxp3+ regulatory T cells (R2) in liver, spleen and mesenteric lymph nodes. (B) Frequency of regulatory T cells in CD4+ T cells (upper panel) and total cells numbers (lower panel) in liver, spleen and mesenteric lymph nodes. Graphs present mean ± SD of 11–13 week-old 4–8 mice per group. *P <0.05 and ***P <0.001 as determined by Student Test.
Figure 2
Figure 2
Comparison of transcription profile between dnTGFβRII Tregs and WT Tregs. (A) Comparative transcriptome analysis between CD4+Foxp3+ Tregs from 10 week-old dnTGFβRII;Foxp3GFP mice (dnTGFβRII) and WT;Foxp3GFP mice (WT). Regulatory T cells were sorted from splenocytes pooled from 5 mice. Analysis was performed by Affymetrix GeneChip Mouse Genome 430 2.0 arrays. Genes of dnTGFβRII Tregs that were expressed greater than 2-fold higher or lower than WT Tregs were highlighted. Differential expression genes were divided into 4 groups by sample calibration. Dots were highlighted brilliant green and pink represented the 2-fold unregulated genes in dnTGFβRII Tregs, red and blue dots represented the 2-fold down-regulated genes in dnTGFβRII Tregs. Signal pairs from brilliant green and red groups were both distinct from chip background signal. Signal pairs from soft pink and blue groups had one probe signal cannot distinct from background, the other probe signal was higher than 8, this design was used to exclude the noise signals and still keep some positive signals. The number of genes for each comparison in the 4 groups mentioned above were indicated. (B) Distribution by functional category of up-regulated genes in dnTGFβRII Tregs and WT Tregs. Genes with greater than 2-fold differences are included. 1, T cell-related intracellular protein, 2, T cell-related membrane protein, 3, immune response-related membrane protein, 4, cytokines and cytokine receptors, 5, chemotaxis related, 6, transcription factors, 7, cytoskeleton or structural related, 8, apoptosis related, 9, metabolic process related, 10, cell cycle and proliferation related.
Figure 3
Figure 3
Characterization of different gene categories of dnTGFβRII and WT Tregs. Differentially expressed genes in dnTGFβRII Tregs and WT Tregs were chosen and classified into different groups by functional category. Heat maps showing signal values of the listed genes had greater than 2-fold differences. Genes are ranked by their signal values. Numbers in each box indicated probe signal value. Some T cell response related molecules were shown in panel (A), chemotaxis, cell adhesion, cytokine signaling, and apoptosis related genes were displayed in panel (B), some transcriptional factors and cell skeleton related genes were exhibited in panel (C) and (D), respectively.
Figure 4
Figure 4
Quantitative PCR analysis to confirm differentially expressed genes. (A) Selected genes from the transcriptional array were studied by qPCR as indicated in black (references with less than two fold change), green (upregulated in dnTGFβRII Tregs) or in red (upregulated in WT Tregs). (B) Quantitative PCR analysis comparing mRNA level expression of selected genes among WT CD4+ non-Treg cells (WT-Tconv, white bar), dnTGFβRII CD4+ non-Treg cells (dnTGFβRII-Tconv, gray bar), WT Tregs (slash white bar) and dnTGFβRII Tregs (black bar), which were listed in panel (A). P values were determined using Nonparametric Mann-Whitney U test, and *P <0.05 **P<0.01, and ***P <0.001. Graph contains results from RNA sample analyzed in microarray in two independent experiments.
Figure 5
Figure 5
CD4+Foxp3+ cells from dnTGFβRII;Foxp3GFP mice display a highly activated Th1- like phenotype. (A) Expression of activation markers (CD25, GITR, ICOS, CTLA-4) and adhesion molecule (CXCR3, CCR6, CD62L) on CD4+Foxp3+ T cells from liver, spleen and mesenteric lymph nodes of dnTGFβRII;Foxp3GFP mice and WT;Foxp3GFP mice. (B) Statistical analysis of mean fluorescence intensity (MFI) of the markers presented in (A). Graphs present mean ± SD of 11–13 week-old 4–8 mice per group. *P <0.05, **P <0.01 and *** P <0.001 as determined by Student Test.
Figure 6
Figure 6
Comparative analysis of cytokine secreting capacity between dnTGFβRII;Foxp3GFP mice Tregs and WT;Foxp3GFP mice derived Tregs. Total mononuclear cells from spleen (A) and mesenteric lymph nodes (B) of dnTGFβRII;Foxp3GFP and WT;Foxp3GFP mice were stimulated with PMA and ionomycin for 3 hours in the presence of Golgi stop reagent. Secreted IFN-γ, IL-10 and Granzyme B (GzmB) of Tregs were assessed by flow cytometry. Graphs present 10 week-old mice, 4 mice per group. (C) and (D) present the statistics analysis of the data indicated in (A) and (B), respectively. Graphs present mean ± SD. Data is representative of two independent experiments with similar results. *P <0.05, **P <0.01 and ***P <0.001 as determined by Student Test.
Figure 7
Figure 7
Visualization of up-regulated and down-regulated gene-gene interaction pathways. (A) Interaction network of up-regulated genes (left panel) and down-regulated genes (right panel) and their first neighbor nodes. Fold changes between dnTGFβRII Tregs and WT Tregs were depicted by the size and color of the nodes. More than 2-fold change genes were depicted as a circular node, while less than 2-fold change neighbor nodes were depicted as squares. Up-regulated genes are indicated in red, while down-regulated genes are indicated in green. ΔNS represents the difference of dnTGFβRII Treg normalized signal minus WT Treg normalized signal. A number greater than 1.0 indicates that the gene expression was up-regulated more than 2-fold, while a number was less than −1.0 means the gene expression was down-regulated more than 2-fold. The cycles represented below the network figure show genes with auto-interaction or lacking interaction information. (B and C) Overview of biological pathway analysis. Enrichment of biological process pathways defined by Gene Ontology were generated with the BiNGO 3.0.2 plugin in Cytoscape 3.2.0. Red nodes depict processes that were targeted by up-regulated genes, while cyan nodes represent processes targeted by down-regulated genes. Number of the genes involved in the biological pathways is depicted by the size of the nodes.

Similar articles

Cited by

References

    1. Gershwin ME, Mackay IR, Sturgess A, Coppel RL. Identification and specificity of a cDNA encoding the 70 kd mitochondrial antigen recognized in primary biliary cirrhosis. Journal of immunology. 1987;138:3525–31. - PubMed
    1. Yang CY, Ma X, Tsuneyama K, Huang S, Takahashi T, Chalasani NP, et al. IL-12/Th1 and IL-23/Th17 biliary microenvironment in primary biliary cirrhosis: implications for therapy. Hepatology. 2014;59:1944–53. - PMC - PubMed
    1. Kawata K, Yang GX, Ando Y, Tanaka H, Zhang W, Kobayashi Y, et al. Clonality, activated antigen-specific CD8(+) T cells, and development of autoimmune cholangitis in dnTGFbetaRII mice. Hepatology. 2013;58:1094–104. - PMC - PubMed
    1. Rong GH, Yang GX, Ando Y, Zhang W, He XS, Leung PS, et al. Human intrahepatic biliary epithelial cells engulf blebs from their apoptotic peers. Clinical and experimental immunology. 2013;172:95–103. - PMC - PubMed
    1. Chen RC, Naiyanetr P, Shu SA, Wang J, Yang GX, Kenny TP, et al. Antimitochondrial antibody heterogeneity and the xenobiotic etiology of primary biliary cirrhosis. Hepatology. 2013;57:1498–508. - PMC - PubMed

Publication types

MeSH terms

Substances