. 2015 Jun;3(6):620-30.
doi: 10.1158/2326-6066.CIR-14-0201. Epub 2015 Feb 19.

PD-1+Tim-3+ CD8+ T Lymphocytes Display Varied Degrees of Functional Exhaustion in Patients with Regionally Metastatic Differentiated Thyroid Cancer

Affiliations

PD-1+Tim-3+ CD8+ T Lymphocytes Display Varied Degrees of Functional Exhaustion in Patients with Regionally Metastatic Differentiated Thyroid Cancer

Jill J Severson et al. Cancer Immunol Res. 2015 Jun.

Abstract

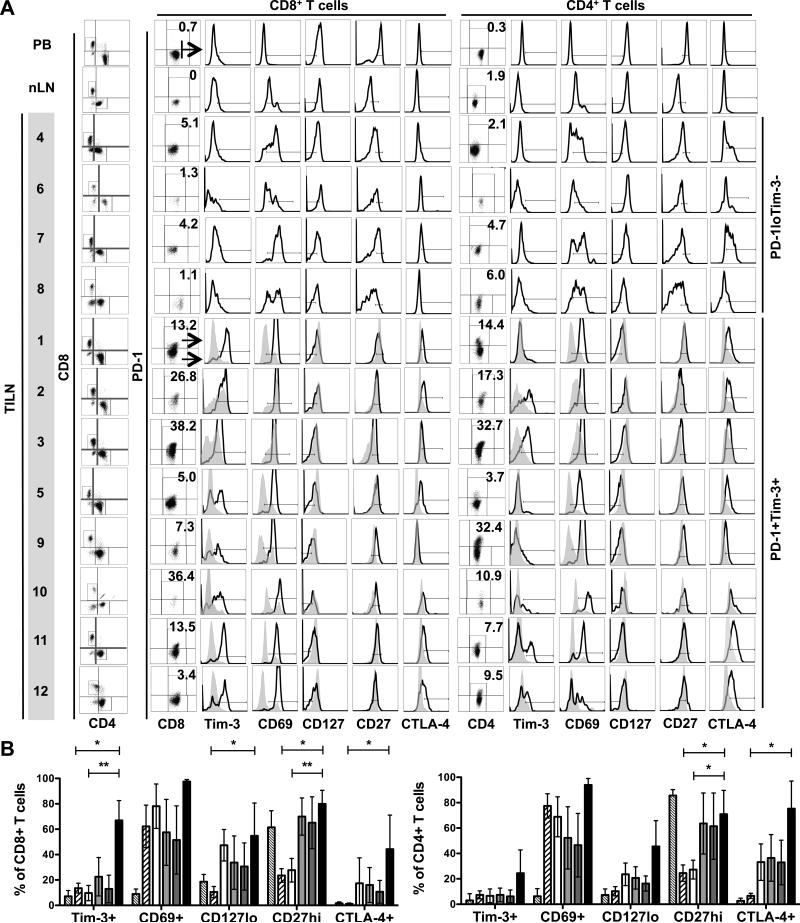
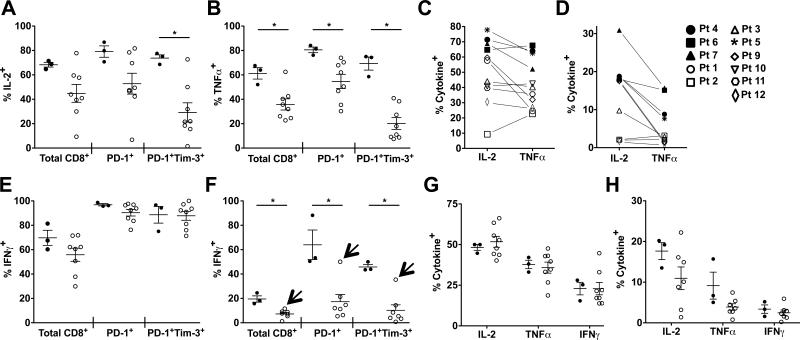
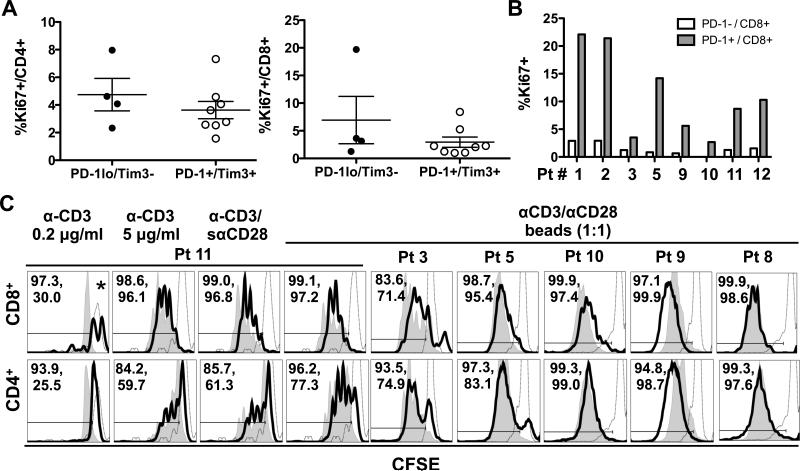
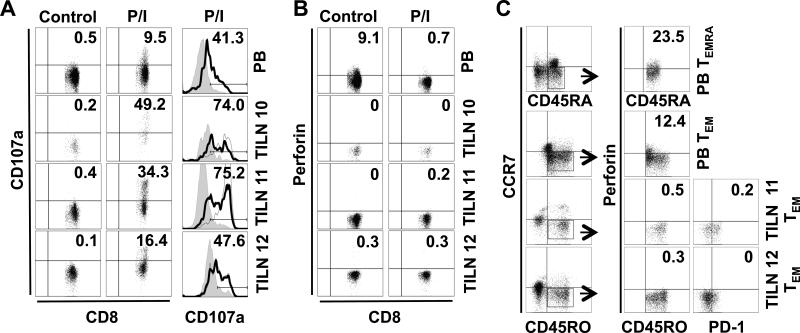
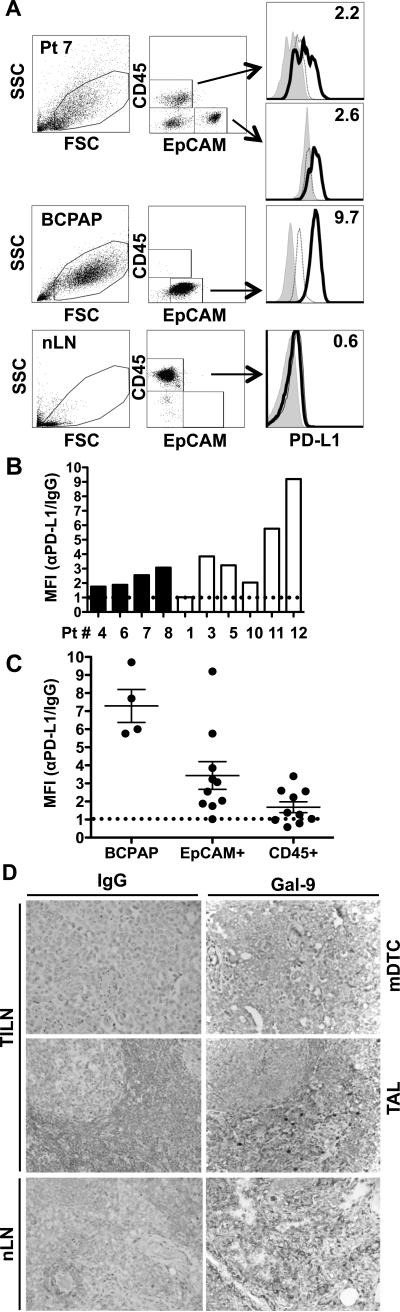
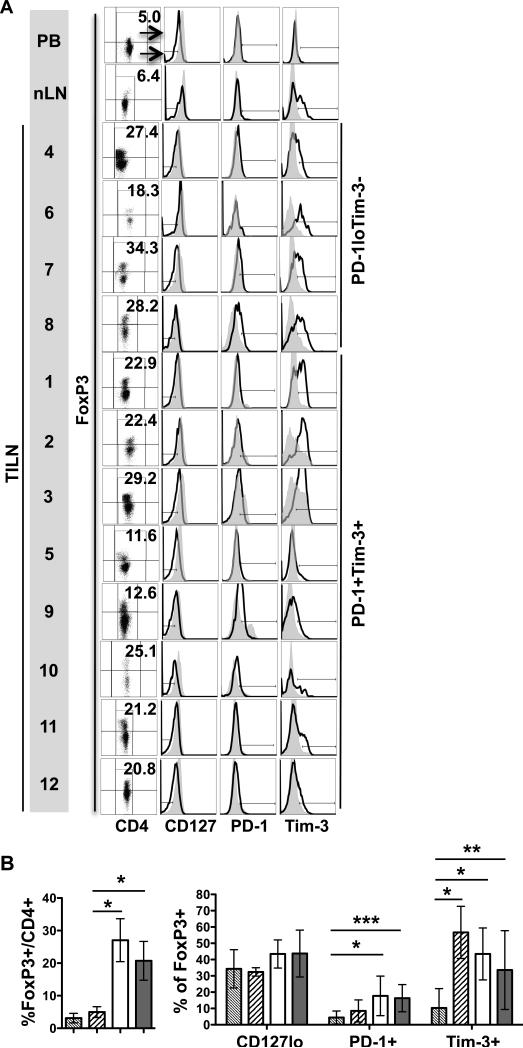
Regional metastatic differentiated thyroid cancer (mDTC) provides a unique model in which to study the tumor-immune interface. These lymph node metastases persist for years, generally without progression to distant metastases. Although the immune system likely impedes disease progression, it is unsuccessful in eliminating disease. Our previous studies revealed that programmed death-1 (PD-1)(+) T cells were enriched in tumor-involved lymph nodes (TILN). Tumor-associated leukocytes and tumor cells were collected from grossly involved lymph nodes from 12 patients to further characterize the phenotype and functional potential of mDTC-associated PD-1(+) T cells. PD-1(+)CD4(+) and PD-1(+)CD8(+) T cells were enriched in 8 of 12 TILN samples. PD-1(+) T cells coexpressed Tim-3 and CD69 and failed to downregulate CD27. CD8(+) T cells, but not CD4(+) T cells, from these samples were variably deficient in their ability to produce effector cytokines when compared with control TILNs that lacked resident PD-1(+) T cells. PD-1(+)CD8(+) T cells were capable of exocytosis but lacked intracellular perforin. Surprisingly, T-cell proliferative capacity was largely maintained in all samples. Thus, although PD-1 expression by mDTC-associated CD8(+) T cells was associated with dysfunction, exhaustion was not complete. Notably, molecular markers of exhaustion did not translate to dysfunction in all samples or in CD4(+) T cells. Regulatory T cells (Treg), PD-L1, and galectin-9 were commonly found in mDTC and likely contributed to the initiation of T-cell exhaustion and disease progression. Therapies that release the effects of PD-1 and Tim-3 and reduce the suppressive effects of Tregs may encourage tumor elimination in patients with mDTC.


Figures

Figure 1
Figure 1. Phenotype of T Cells Isolated from TILNs
T cells from PB, normal lymph node (nLN), and TILN sections from 12 mDTC patients were analyzed by flow cytometry. (A) Viable CD8+ T cells and FoxP3CD4+ T cells were analyzed for PD-1 expression (%PD-1+ is noted). Total CD8+ or FoxP3CD4+ populations were analyzed for the designated receptors in Patients 4, 6, 7, and 8 whose PD-1+ cells were too infrequent to assess (PD-1loTim-3). In the remaining samples (PD-1+Tim-3+), PD-1+ (black line) and PD-1 (filled grey histogram) subpopulations were compared. FoxP3+ Tregs were included in the analysis of intracellular CTLA-4 expression. PB samples were used to determine the gating strategy. (B) Combined analysis of PB (thin hatched), nLN (thick hatched), PD-1loTim-3 TILN (white), and PD-1+Tim-3+ TILN (light grey) or PD-1 (dark gray) and PD-1+ (black) subsets in PD-1+Tim-3+ TILN. * p ≤ 0.05; ** p ≤ 0.01
Figure 2
Figure 2. Stimulated Cytokine Production in T Cells Isolated from TILNs
Total CD8+ T cell and PD-1+ or PD-1+Tim-3+ subsets from PD-1loTim-3 (filled circles) and PD-1+Tim-3+ (open circles) TILNs were compared following stimulation with PMA/ionomycin for frequencies of IL2+ (A) or TNFα+ (B) cells. Percentages of total CD8+ T cells expressing IL2 or TNFα are shown for each patient following PMA/ionomycin (C) or anti-CD3/anti-CD28 (D) stimulation. The percentage of IFNγ+ cells are shown for total CD8+ T cells and PD-1+ or PD-1+Tim-3+ subsets following PMA/ionomycin (E) or anti-CD3/anti-CD28 (F) stimulation. Arrows designate the values for Patient 5. The percentage of cytokine+ cells are shown for total CD4+ T cells following PMA/ionomycin (G) or anti-CD3/anti-CD28 (H) stimulation. Mean and SEM are shown. * p ≤ 0.05
Figure 3
Figure 3. Proliferation profiles of T cells recovered from TILNs
Non-adherent cells from TILNs were analyzed by flow cytometry for expression of Ki67. (A) Percent Ki67+ of total CD8+ or total CD4+ T cells is compared between PD-1loTim-3 and PD-1+Tim-3+ TILN groups. Mean and SEM are shown. (B) Percent Ki67+ in PD-1 and PD-1+ CD8+ T-cell subsets is shown for all PD-1+Tim-3+ patient (Pt) samples. (C) Non-adherent cells from TILN samples (black line) were compared to those in patient or normal PB (filled grey histogram) in an ex vivo proliferation assay. CD3 cells in the PB population were used to define the undivided CFSEhi population (open grey histograms). The percentage of cells that had undergone at least one division is noted (PBMCs, TILNs). *Fewer than 100 events were collected in the CD8+ T-cell gate from TILNs.
Figure 4
Figure 4. Cytotoxic potential of CD8+ T cells from PD-1+Tim-3+ TILNs
T cells from normal PB or TILNs were left unstimulated (control) or stimulated with PMA and ionomycin (P/I). (A) Viable CD8+ T cells were for CD107a expression by flow cytometry (percent positive is noted). CD107a expression levels in PD-1 (filled grey histogram), PD-1+(black line; percent positive is shown), and PD-1+Tim-3+ (dotted line) subsets were compared following stimulation. (B) Corresponding intracellular perforin levels are shown. (C) Unstimulated CD8+ T cells were analyzed for expression of memory markers. TEMRA and TEM populations were further analyzed for intracellular perforin and PD-1 expression.
Figure 5
Figure 5. PD-L1 and galectin-9 expression in TILNs
(A) Viable EpCAM+ tumor cells and CD45+ leukocytes that remained in the adherent cells from TILNs were gated and analyzed for PD-L1 expression by flow cytometry. Patient (Pt) 7 is shown as a representative sample. PD-L1 (black line) is compared to IgG (dotted line) or unstained (grey histogram) controls. Fold median fluorescence index (MFI) of anti-PD-L1/IgG is noted. (B) Relative PD-L1 expression is shown for each PD-1loTim-3 (black bars) or PD-1+Tim-3+ (white bars) TILN. (C) Combined analysis of 4 experiments is shown. The dotted line denotes the threshold for PD-L1 expression. (D) Representative images of galectin-9 expression in TILNs (Patient 1; 40X magnification) and normal LN (nLN). mDTC = metastasis; TAL = mDTC-associated leukocytes.
Figure 6
Figure 6. Treg frequency and phenotype in TILNs
(A) The percentage of FoxP3+ cells in the total CD4+ T-cell population was determined by flow cytometry. FoxP3+ Tregs (black line) and FoxP3 (filled grey histogram) subsets were compared for expression of CD127, PD-1, and Tim-3. (B) Combined analysis of Treg frequency and activation markers in PB (thin hatched), normal lymph node (thick hatched), PD-1loTim-3 TILNs (white), and PD-1+Tim-3+ TILNs (light grey).

References

    1. Howlader N, NA, Krapcho M, Neyman N, Aminou R, Waldron W, Altekruse SF, et al., editors. Surveillance Epidemiology and End Results (SEER): Cancer Statistics Review 1975-2008. National Cancer Institute; Bethesda, MD: 2011. http://seer.cancer.gov/csr/1975_2008, based on November 2010 SEER data submission, posted to the SEER web site.
    1. Mazzaferri EL, Jhiang SM. Long-term impact of initial surgical and medical therapy on papillary and follicular thyroid cancer. Am J Med. 1994;97:418–28. - PubMed
    1. Ito Y, Jikuzono T, Higashiyama T, Asahi S, Tomoda C, Takamura Y, et al. Clinical significance of lymph node metastasis of thyroid papillary carcinoma located in one lobe. World J Surg. 2006;30:1821–8. - PubMed
    1. French JD, Kotnis GR, Said S, Raeburn CD, McIntyre RC, Jr., Klopper JP, et al. Programmed Death-1+ T Cells and Regulatory T Cells Are Enriched in Tumor-Involved Lymph Nodes and Associated with Aggressive Features in Papillary Thyroid Cancer. J Clin Endocrinol Metab. 2012;97:E934–43. - PMC - PubMed
    1. Wherry EJ. T cell exhaustion. Nat Immunol. 2011;12:492–9. - PubMed

Publication types

MeSH terms