. 2015 Mar 16;25(6):772-779.
doi: 10.1016/j.cub.2015.01.041. Epub 2015 Feb 19.

Human-chimpanzee differences in a FZD8 enhancer alter cell-cycle dynamics in the developing neocortex

Affiliations

Human-chimpanzee differences in a FZD8 enhancer alter cell-cycle dynamics in the developing neocortex

J Lomax Boyd et al. Curr Biol. .

Abstract

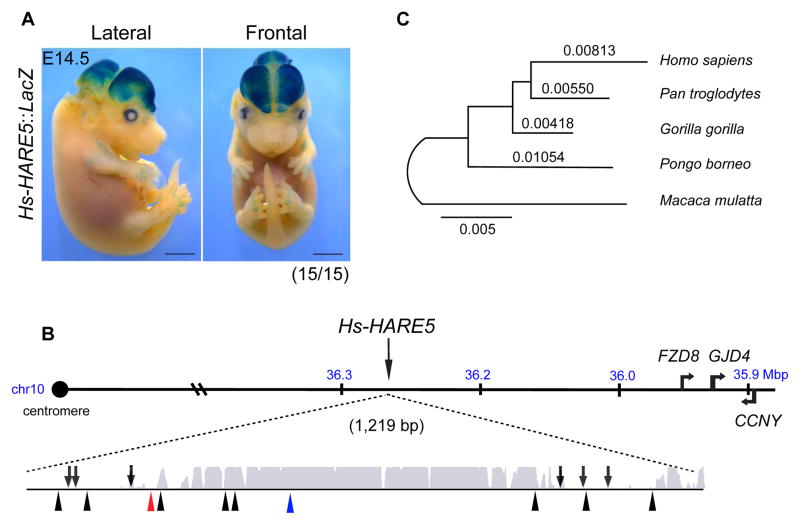
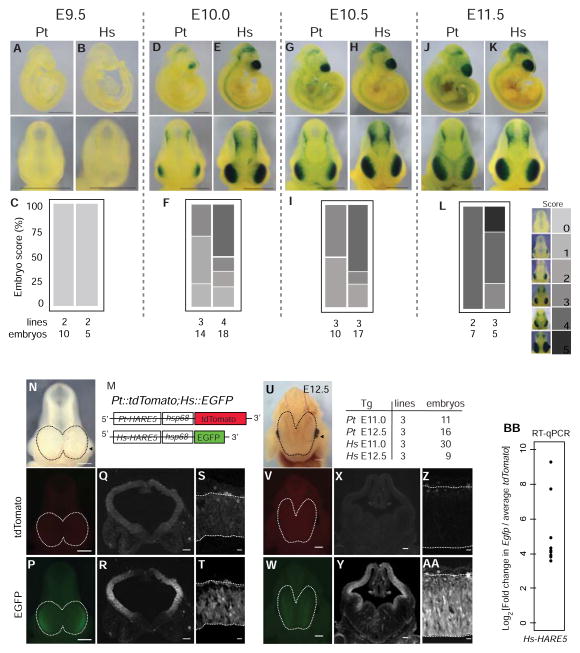
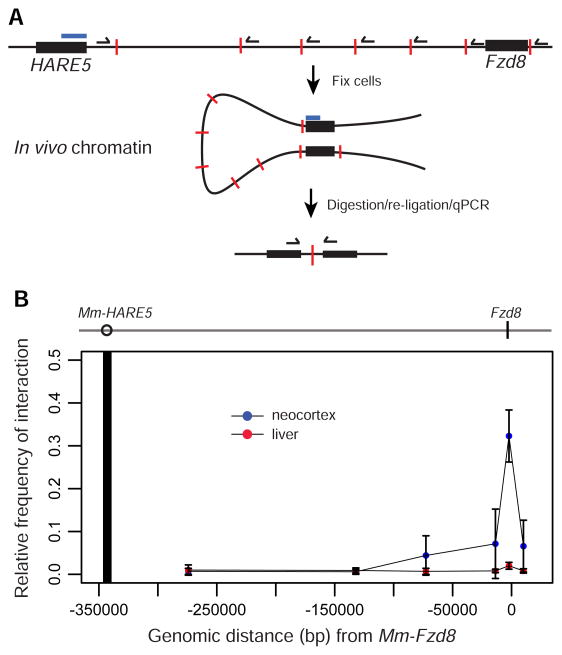
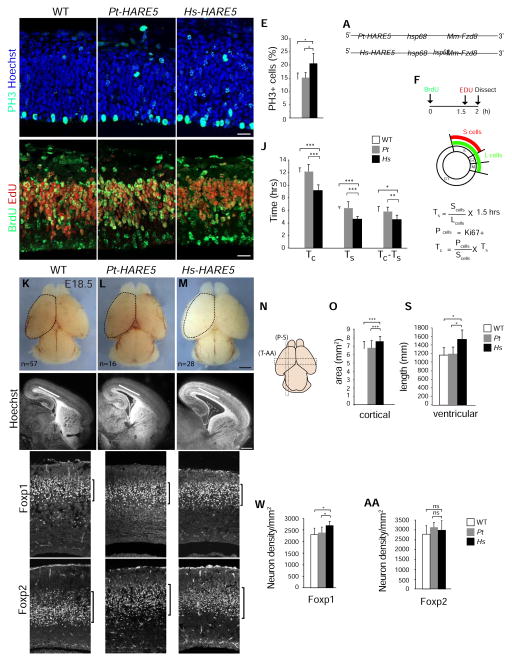
The human neocortex differs from that of other great apes in several notable regards, including altered cell cycle, prolonged corticogenesis, and increased size [1-5]. Although these evolutionary changes most likely contributed to the origin of distinctively human cognitive faculties, their genetic basis remains almost entirely unknown. Highly conserved non-coding regions showing rapid sequence changes along the human lineage are candidate loci for the development and evolution of uniquely human traits. Several studies have identified human-accelerated enhancers [6-14], but none have linked an expression difference to a specific organismal trait. Here we report the discovery of a human-accelerated regulatory enhancer (HARE5) of FZD8, a receptor of the Wnt pathway implicated in brain development and size [15, 16]. Using transgenic mice, we demonstrate dramatic differences in human and chimpanzee HARE5 activity, with human HARE5 driving early and robust expression at the onset of corticogenesis. Similar to HARE5 activity, FZD8 is expressed in neural progenitors of the developing neocortex [17-19]. Chromosome conformation capture assays reveal that HARE5 physically and specifically contacts the core Fzd8 promoter in the mouse embryonic neocortex. To assess the phenotypic consequences of HARE5 activity, we generated transgenic mice in which Fzd8 expression is under control of orthologous enhancers (Pt-HARE5::Fzd8 and Hs-HARE5::Fzd8). In comparison to Pt-HARE5::Fzd8, Hs-HARE5::Fzd8 mice showed marked acceleration of neural progenitor cell cycle and increased brain size. Changes in HARE5 function unique to humans thus alter the cell-cycle dynamics of a critical population of stem cells during corticogenesis and may underlie some distinctive anatomical features of the human brain.


Figures

Figure 1
Figure 1. Identification of Hs-HARE5 as a human-accelerated neocortical enhancer
(A) Representative E14.5 Hs-HARE5::LacZ embryo stained for β-galactosidase (LacZ) activity. (B) Schematic of Hs-HARE5 locus on human chromosome 10 (hg19). The 1,219 bp long HARE5 genomic locus with enhancer activity includes the original 619 bp human-accelerated sequence and flanking 5′ and 3′ sequences. Represented below is a PhastCons conservation track for the HARE5 locus, shown with the region of high conservation (grey). Also shown are lineage-specific mutations for chimpanzee (6, arrows, above line), and human (10, arrowheads, bottom), including 1 Denisovan (red) and 1 currently identified human polymorphism (blue). (C) Maximum likelihood phylogenetic tree for the HARE5 orthologous locus from five anthropoid primates. Scale bars, 2 mm (A). See also Figure S1 and Table S1.
Figure 2
Figure 2. Hs-HARE5 activity drives robust, early enhancer activity relative to Pt-HARE5 during corticogenesis
(A–L) Developmental time-series of Pt-HARE5::LacZ (A,D,G,J) and Hs-HARE5::LacZ (B,E,H,K) reporter activity from stable transgenic lines. Representative images of LacZ stained embryos from lateral (top) and anterior (bottom) views. (C,F,I,L) Enhancer activity was qualitatively scored in the telencephalon, using the indicated scoring schema shown on the right, on a scale from no reporter activity (score 0) to full telencephalic activity (score 5). Number of embryos and independent transgenic lines analyzed for each stage are listed below. Embryos were scored blindly and independently by at least three individuals. (M) Schematic of destabilized reporter constructs drawn to scale. (N-AA) Representative embryos from dual reporter transgenic Pt-HARE5::tdTomato; Hs-HARE5::EGFP E11.0 (N–T) and E12.5 (U-AA) embryos detected by brightfield (N,U), and endogenous fluorescence for tdTomato (O,Q,S,V,X,Z) and EGFP (P,R,T,W,Y,AA) channels. Dotted lines demarcate dorsal neocortices of whole mount embryos (N–P, U–W). (Q,R,X,Y) Coronal sections from mid-cortex (plane indicated by arrowhead in N,U) in tdTomato (Q,X) and EGFP (R,Y) channels. (S,T,Z,AA) High-magnification images of the lateral telencephalon for tdTomato (S,Z) and EGFP (T,AA). The number of embryos and lines for each analysis is listed beside U. Endogenous fluorescence images were captured using identical exposure conditions. (BB) Graph depicting log fold changes for RT-qPCR from E12.5 neocortices. Each data point is the average fold change for an individual Hs-HARE5::EGFP embryo relative to the aggregated average for all Pt-HARE5::tdTomato embryos. mRNA input levels were normalized to Gapdh. n=4 technical replicates per embryo; n=9 embryos from 3 transgenic lines from each genotype. Scale bars, 1 mm (A–K), 500 μm (N–P, U–W); 150 μm (Q,R,X,Y); 25 μm (S,T,Z,AA). See also Figure S2 and Table S2.
Figure 3
Figure 3. 3C analysis showing HARE5 physically contacts the Fzd8 promoter
(A) Schematic of 3C protocol showing HARE5 and Fzd8 loci (black bars), with indicated TaqMan probe (blue bar), test primers (black half arrows), and HindIII restriction sites (red lines). (B) 3C assay of E12.5 mouse neocortices (blue dots) and liver control tissue (red dots). Dark vertical line indicates location of TaqMan probe and constant primer anchored within the Mm-HARE5 locus. The 0 position indicates ATG of Fzd8 coding sequence. The graph depicts the relative frequency of interactions between Mm-HARE5 and 6 genomic locations. See also Figure S3.
Figure 4
Figure 4. Hs-HARE5 driven expression of Fzd8 accelerates cell cycle of neural progenitors, and increases neuron number and neocortical size
(A) Schematic of Pt-HARE5::Fzd8 and Hs-HARE5::Fzd8 constructs. (B–I) Images of coronal sections from E12.5 WT littermate (B,G), Pt-HARE::Fzd8 (C,H), and Hs-HARE5::Fzd8 (D,I) transgenic cortices. Sections stained for (B–D) PH3 (green) and Hoechst (blue), (G–I) BrdU (green) and EdU (red). (E) Graph of WT (white), Pt-HARE::Fzd8 (grey), and Hs-HARE5::Fzd8 (black) depicting percentage of all cells that are PH3-positive. (F) Paradigm for analysis of cell cycle length using double pulse of BrdU and EdU. Nucleotide analogs were injected at indicated time-points and overall cell cycle length (Tc) and S phase length (Ts) were calculated as shown. (J) Graph of WT (white), Pt-HARE::Fzd8 (grey), and Hs-HARE5::Fzd8 (black) cell cycle lengths of cycling progenitors. (K–M) Whole mount E18.5 brains from indicated genotypes with n=number of brains examined. A dotted line was drawn on WT cortex in K to indicate dorsal cortical area, and then superimposed on transgenic cortices in L and M. (N) Schematic cartoon representation of E18.5 brain with indicated regions of analyses for sagittal sections (P–S) and coronal sections (T-AA). (O) Graph of WT (white), Pt-HARE::Fzd8 (grey), and Hs-HARE5::Fzd8 (black) dorsal cortical area measurements. Note a 12% increase was seen in Hs-HARE5::Fzd8 cortical area. (P–R) Sagittal E18.5 sections from brains of indicated genotypes. A line drawn on WT cortex in P indicates ventricular length, and was superimposed on transgenic cortices in Q and R. Note no evidence of cortical gyrification was seen. (S) Graph depicting ventricular length for indicated genotypes. (T–V, X–Z) Coronal E18.5 sections from neocortices of indicated genotypes and stained for Foxp1 (T–V) and Foxp2 (X–Z). Note no significant apoptosis was observed. (W, AA) Graphs depicting densities of Foxp1 (W) and Foxp2 (AA) neurons in radial columns of neocortical sections. The following were analyzed for each genotype: for B–E, n=5 embryos each from 3 transgenic lines; for F–J, 5–7 embryos each from 2–3 transgenic lines; K–O, 16–57 embryos each from 2–3 transgenic lines; P–S, 4–5 embryos each (2–5 sections per embryo) from 2–3 transgenic lines; T-AA, 5–6 embryos each (2–4 sections per embryo) from 2–3 transgenic lines. All analyses were done blind to genotype. Error bars, s.d., *, P < 0.05, **, P<0.01, ***, P<0.001. Scale bars, 25 μm (B–I), 1 mm (K–M), 500 μm (P–R), and 100 μm (T–Z). See also Figure S4 and Table S3.

Comment in

Similar articles

Cited by

References

    1. Geschwind DH, Rakic P. Perspective. Neuron. 2013;80:633–647. - PMC - PubMed
    1. Lui JH, Hansen DV, Kriegstein AR. Development and evolution of the human neocortex. Cell. 2011;146:18–36. - PMC - PubMed
    1. Enard W, Gehre S, Hammerschmidt K, HOlter SM, Blass T, Somel M, BrUckner MK, Schreiweis C, Winter C, Sohr R, et al. A Humanized Version of Foxp2 Affects Cortico-Basal Ganglia Circuits in Mice. Cell. 2009;137:961–971. - PubMed
    1. Herculano-Houzel S. The remarkable, yet not extraordinary, human brain as a scaled-up primate brain and its associated cost. Proceedings of the National Academy of Sciences. 2012;109(Suppl 1):10661–10668. - PMC - PubMed
    1. Dennis MY, Nuttle X, sudmant PH, antonacci F, Graves TA, Nefedov M, Rosenfeld JA, Sajjadian S, malig M, Kotkiewicz H, et al. Evolution of Human-Specific Neural SRGAP2 Genes by Incomplete Segmental Duplication. Cell. 2012:1–11. - PMC - PubMed

Publication types

MeSH terms

LinkOut - more resources