. 2015 Mar 2;25(5):663-70.
doi: 10.1016/j.cub.2015.01.025. Epub 2015 Feb 19.

Mechanical stress and network structure drive protein dynamics during cytokinesis

Affiliations

Mechanical stress and network structure drive protein dynamics during cytokinesis

Vasudha Srivastava et al. Curr Biol. .

Abstract

Cell-shape changes associated with processes like cytokinesis and motility proceed on several-second timescales but are derived from molecular events, including protein-protein interactions, filament assembly, and force generation by molecular motors, all of which occur much faster [1-4]. Therefore, defining the dynamics of such molecular machinery is critical for understanding cell-shape regulation. In addition to signaling pathways, mechanical stresses also direct cytoskeletal protein accumulation [5-7]. A myosin-II-based mechanosensory system controls cellular contractility and shape during cytokinesis and under applied stress [6, 8]. In Dictyostelium, this system tunes myosin II accumulation by feedback through the actin network, particularly through the crosslinker cortexillin I. Cortexillin-binding IQGAPs are major regulators of this system. Here, we defined the short timescale dynamics of key cytoskeletal proteins during cytokinesis and under mechanical stress, using fluorescence recovery after photobleaching and fluorescence correlation spectroscopy, to examine the dynamic interplay between these proteins. Equatorially enriched proteins including cortexillin I, IQGAP2, and myosin II recovered much more slowly than actin and polar crosslinkers. The mobility of equatorial proteins was greatly reduced at the furrow compared to the interphase cortex, suggesting their stabilization during cytokinesis. This mobility shift did not arise from a single biochemical event, but rather from a global inhibition of protein dynamics by mechanical-stress-associated changes in the cytoskeletal structure. Mechanical tuning of contractile protein dynamics provides robustness to the cytoskeletal framework responsible for regulating cell shape and contributes to cytokinesis fidelity.


Figures

Figure 1
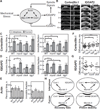
Figure 1. Changes in protein dynamics during cytokinesis
(A) Cytoskeletal proteins are asymmetrically localized during cytokinesis. (B) From FRAP analysis, the network release rate is inversely proportional to the recovery time (τ), while the immobile fraction (dark red circles) represents the protein population that does not turnover during the experiment. The protein mobile fraction is represented by light orange circles. The thick and thin lines represent the immobile and mobile populations of actin, respectively. (C) Recovery times and immobile fractions for soluble GFP and cytoskeletal proteins at the cell cortex and in the cytoplasm as measured by FRAP. Cytoskeletal proteins show slower recovery in the cortex than in the cytoplasm. (D) Recovery times and immobile fractions of different cytoskeletal proteins in the interphase cortex and at the cleavage furrow. Equatorially enriched proteins – myosin II, cortexillin I and IQGAP2 – have markedly reduced mobility at the cleavage furrow. Values plotted are mean ± SEM; sample sizes are listed on the bars (see Table S1). Asterisks represent the significance of difference between interphase and furrow measurements where ns: p >0.05, *: p <0.05, **: p <0.005, ***: p <0.0005 based on ANOVA with Fischer’s LSD post-test. #: FRAP data for myosin II is reproduced from [16] and for dynacortin and fimbrin from [9]. (See also Figure S1)
Figure 2
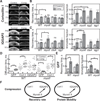
Figure 2. Changes in cortexillin I and IQGAP2 dynamics at the cleavage furrow
(A) A myosin II-cortexillin I-actin-based mechanosensory system regulates contractility at the furrow, and IQGAP proteins regulate accumulation of the contractile proteins. (B) Confocal images showing photobleaching and fluorescence recovery of GFP-cortexillin I and GFP-IQGAP2 in the cortex of interphase cells and at the cleavage furrow. (C, D) Recovery times and immobile fractions for GFP-cortexillin I (C) and GFP-IQGAP2 (D) in different genetic mutants in the cortex of interphase and dividing cells. (E) Recovery times and immobile fractions for GFP-actin in different genetic mutants in the interphase cortex. (F, G) Cytoplasmic diffusion times measured by FCS for GFP-cortexillin I (F) and GFP-IQGAP2 (G) in different mutants (see Table S3). (H) Schematic showing the effect of key cytoskeletal proteins on the dynamics of cortexillin I and IQGAP2, based on FRAP measurements. Values plotted are mean ± SEM; sample sizes are listed on the bars (see Table S1). p values represented as ns: p >0.05, *: p <0.05, **: p <0.005, ***: p <0.0005 based on ANOVA with Fischer’s LSD post-test. Asterisks above the furrow measurement represent significance of difference from interphase values. Comparisons across mutants are represented by asterisks above the connecting lines. Scale bar, 5 µm. (See also Figure S2)
Figure 3
Figure 3. Mechanical stress drives changes in dynamics and mobility of cortexillin I and IQGAP2
(A) Confocal images showing photobleaching and fluorescence recovery of GFP-cortexillin I and GFP-IQGAP2 in the cortex of uncompressed cells (control) and cells compressed using agarose overlay (comp). (B, C) Recovery times and immobile fractions for GFP-cortexillin I (B) and IQGAP2 (C) in different genetic mutants in absence or presence of compressive stress. (D) Cytoplasmic protein diffusion in absence or presence of compressive stress. (E) Recovery times and immobile fractions for GFP in WT and myoII cells in absence or presence of compressive stress. (F) Schematic showing the effect of key cytoskeletal proteins on the dynamics of cortexillin I and IQGAP2 under compression, based on FRAP measurements. Values plotted are mean ± SEM; sample sizes are listed on the bars (see Table S1). p values represented as ns: p >0.05, *: p <0.05, **: p <0.005, ***: p<0.0005 based on ANOVA with Fischer’s LSD post-test. Asterisks above the compression measurement represent significance of difference from the control. Comparisons across mutants are represented by asterisks above the connecting lines. Scale bar, 5 µm. (See also Figure S3)
Figure 4
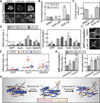
Figure 4. Changes in cytoskeletal network structure result in altered protein dynamics
(A) Confocal images of TRITC-phalloidin and anti-actin stained cells show changes in the cytoskeletal architecture 15 minutes post-treatment with 5 µM latrunculin-A or 2 µM jasplakinolide. (B) Quantification of relative F-actin amount based on the fluorescence intensity of TRITC-phalloidin and anti-actin staining. (C) Cortical tension measured by micropipette aspiration on cells treated with 1 µM latrunculin-A or 2 µM jasplakinolide. (D) Recovery times and immobile fractions of soluble GFP, GFP-actin, GFP-cortexillin I and GFP-IQGAP2 in untreated, 5 µM latrunculin A or 2 µM jasplakinolide treated cells as measured by FRAP (see Table S2). (E) Diffusion times for GFP, GFP-cortexillin I and GFP-IQGAP2 in untreated, 5 µM latrunculin-A or 2 µM jasplakinolide treated cells as measured by FCS (see Table S3). Cortexillin I shows two differently diffusing populations upon latrunculin-A treatment, while the diffusion of GFP and IQGAP2 is unaffected by the pharmacological treatment. (F) Confocal images showing cleavage furrow recruitment of GFP-cortexillin I in untreated and 5 µM latrunculin-A-treated cells. (G) Recovery times and immobile fractions of GFP-cortexillin I in interphase and dividing cells with or without 5µM latrunculin-A treatment. (H) A schematic showing the changes in protein mobility arise from cytoskeletal rearrangement under mechanical stress or upon latrunculin-A treatment. Under high stress, the crosslinkers show reduced mobility leading to accumulation, while actin mobility increases even though filament amount is relatively unchanged. Upon latrunculin-A treatment, F-actin amount is reduced and actin mobility increases while the crosslinker mobility decreases significantly. Values plotted are mean ± SEM; sample sizes are listed on the bars (see Table S2). Asterisks represent significance of difference from DMSO control, where p values represented as ns: p >0.05, *: p <0.05, **: p <0.005, ***: p <0.0005 based on ANOVA with Fischer’s LSD post-test. Scale bar, 5 µm. (See also Figure S4)

Similar articles

Cited by

References

    1. Craig Erin M, Van Goor D, Forscher P, Mogilner A. Membrane Tension, Myosin Force, and Actin Turnover Maintain Actin Treadmill in the Nerve Growth Cone. Biophysical Journal. 2012;102:1503–1513. - PMC - PubMed
    1. Engl W, Arasi B, Yap LL, Thiery JP, Viasnoff V. Actin dynamics modulate mechanosensitive immobilization of E-cadherin at adherens junctions. Nat Cell Biol. 2014;16:587–594. - PubMed
    1. Luo T, Mohan K, Iglesias PA, Robinson DN. Molecular mechanisms of cellular mechanosensing. Nat Mater. 2013;12:1064–1071. - PMC - PubMed
    1. Luo T, Mohan K, Srivastava V, Ren Y, Iglesias PA, Robinson DN. Understanding the Cooperative Interaction between Myosin II and Actin Cross-Linkers Mediated by Actin Filaments during Mechanosensation. Biophysical Journal. 2012;102:238–247. - PMC - PubMed
    1. Effler JC, Kee Y-S, Berk JM, Tran MN, Iglesias PA, Robinson DN. Mitosis-Specific Mechanosensing and Contractile-Protein Redistribution Control Cell Shape. Current Biology. 2006;16:1962–1967. - PMC - PubMed

Publication types

MeSH terms

LinkOut - more resources