. 2015 Mar 2;25(5):641-6.
doi: 10.1016/j.cub.2015.01.012. Epub 2015 Feb 19.

Inverse size scaling of the nucleolus by a concentration-dependent phase transition

Affiliations

Inverse size scaling of the nucleolus by a concentration-dependent phase transition

Stephanie C Weber et al. Curr Biol. .

Abstract

Just as organ size typically increases with body size, the size of intracellular structures changes as cells grow and divide. Indeed, many organelles, such as the nucleus [1, 2], mitochondria [3], mitotic spindle [4, 5], and centrosome [6], exhibit size scaling, a phenomenon in which organelle size depends linearly on cell size. However, the mechanisms of organelle size scaling remain unclear. Here, we show that the size of the nucleolus, a membraneless organelle important for cell-size homeostasis [7], is coupled to cell size by an intracellular phase transition. We find that nucleolar size directly scales with cell size in early C. elegans embryos. Surprisingly, however, when embryo size is altered, we observe inverse scaling: nucleolar size increases in small cells and decreases in large cells. We demonstrate that this seemingly contradictory result arises from maternal loading of a fixed number rather than a fixed concentration of nucleolar components, which condense into nucleoli only above a threshold concentration. Our results suggest that the physics of phase transitions can dictate whether an organelle assembles, and, if so, its size, providing a mechanistic link between organelle assembly and cell size. Since the nucleolus is known to play a key role in cell growth, this biophysical readout of cell size could provide a novel feedback mechanism for growth control.


Figures

Figure 1
Figure 1
Nucleolar size scales directly with cell and nuclear volume during development of early C. elegans embryos. (A) Maximum intensity projections of 3D stacks of a control embryo expressing FIB-1::GFP at various stages. 8, 16 and 32-cell stages were taken from a time-lapse movie of a single embryo; 64-cell stage represents a different embryo. Lower panel shows individual nuclei with assembled nucleoli. Scalebar = 10 µm for whole embryos; 5 µm for individual nuclei. (B) Integrated intensity in arbitrary units of individual nucleoli as a function of time in a developing control embryo. Colors correspond to cell stage as indicated below. Time was measured relative to nuclear envelope breakdown in cells ABa and ABp. (C) Direct scaling of maximum nucleolar intensity with nuclear volume for embryos at the 8 to 64-cell stages. Data from time-lapse movies (n = 10) and snapshot images (n = 10–15 per stage) are plotted together. Raw data (points) and mean ± standard deviation for each cell stage (8, circle; 16, square; 32, triangle; 64, diamond) are shown with a linear fit through the origin. r2 = 0.15; p = 9.1 × 10⁻²³ by two-tailed t-test. (D) The nucleoplasmic pool of FIB-1::GFP is depleted as nucleoli assemble. Mean ± standard deviation of the integrated intensity of the nucleoplasm and nucleoli are plotted as a function of time for the 8-cell stage AB-lineage nuclei in the embryo shown in panel A. See also Figure S1 and Movie S1.
Figure 2
Figure 2
Nucleolar size scales inversely with nuclear volume following RNAi. (A) RNAi knockdown of select genes produces embryos of different size. n = 25 embryos for control; 10 embryos for each RNAi condition. Images depict 4-cell stage embryos following RNAi. Scalebar = 10 µm. (B) Inverse scaling of maximum nucleolar intensity with nuclear volume across RNAi conditions at the 8-cell stage. Raw data (points) and mean ± standard deviation for each condition (squares) are shown with the model prediction, Io = α[(N/8)-CsatVn] (solid line). n = 25 embryos for control; 10 embryos for each RNAi condition. The means are all statistically different; p = 1.3 × 10⁻³⁴ by ANOVA. Representative images of ABal nuclei are shown for each condition. Scalebar = 5 µm.
Figure 3
Figure 3
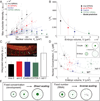
Maternal loading of an intact nucleolus results in concentration differences that explain direct and inverse scaling regimes. (A) Direct scaling of maximum nucleolar intensity with nuclear volume during development in each RNAi condition; inverse scaling across RNAi conditions. Raw data (points) and mean ± standard deviation across 50-µm bins (squares) are shown for embryos at the 8 to 64-cell stages. Raw data for each RNAi condition were fit to a line through the origin to determine the slope, Io/Vn. n = 20–25 embryos per stage for control; 8–15 embryos per stage for each RNAi condition. (B) Fitted slopes from panel A are plotted as a function of mean embryo volume for each RNAi condition. Error bars are 95% confidence intervals. The master scaling equation, Io/Vn = α[N/(Vξ)-Csat], is plotted with zero free parameters (solid line). Dashed lines represent the range of uncertainty in model parameters. (C) Nucleoli are loaded into oocytes intact. Integrated intensity (mean ± standard deviation) of nucleoli in the first cellularized oocyte in the hermaphrodite gonad for each RNAi condition (n = 10 oocytes per condition). Wild-type (WT) RNAi conditions are not statistically different; p = 0.73 by ANOVA. ncl-1 is statistically different from all WT RNAi conditions; p = 0.0038 by ANOVA. Image shows WT control gonad expressing fluorescent markers for cell membranes (red) and nucleoli (green). White arrow indicates the intact nucleolus loaded into an oocyte. (D) Nuclear concentration decreases with increasing embryo volume. Raw data (points) and mean ± standard deviation for each condition (squares) are shown with a fit to the equation Cn = N/(ξV) for WT embryos (filled markers; solid line) and ncl-1 mutant embryos (open markers; dashed line). n = 15 embryos for WT control; 10, WT ima-3(RNAi); 14, WT ani-2(RNAi); 11, WT C27D9.1(RNAi); 10, ncl-1 control; 12, ncl-1 ima-3(RNAi) 16, ncl-1 ani-2(RNAi); 18, ncl-1 C27D9.1(RNAi). (inset) Schematic diagram of nucleoli loaded into oocytes of different size that subsequently disassemble to yield different concentrations in the embryos. (E) Schematic diagram illustrating the direct and inverse scaling regimes. See also Figure S2.
Figure 4
Figure 4
A concentration-dependent phase transition controls nucleolar size and assembly. (A) Maximum nucleolar intensity increases with nuclear concentration above Csat for a given nuclear volume, Vn = 200 µm3. Circles correspond to nucleoli at the 8-cell stage; triangles correspond to nucleoli at the 4-cell stage. Solid line is the model’s prediction, Io = α[Cn-Csat]Vn, for the 8-cell stage. Dashed line is the model’s prediction, Io = α[Cn-Csat4-cell]Vn, for the 4-cell stage. (B) Phase diagram for nucleolar assembly. Asterisks mark the measured saturation concentration at the 4- and 8-cell stages. Circles correspond to embryos at the 8-cell stage; triangles correspond to embryos at the 4-cell stage. Open symbols indicate no nucleolar assembly. Lines from panel A correspond to horizontal lines on the phase diagram. Representative images of ABal nuclei are shown for 8-cell stage embryos; ABa nuclei are shown for 4-cell stage embryos. See also Figure S3 and Table S1.

Similar articles

Cited by

References

    1. Neumann FR, Nurse P. Nuclear size control in fission yeast. J. Cell Biol. 2007;179:593–600. - PMC - PubMed
    1. Jorgensen P, Edgington NP, Schneider BL, Rupes I, Tyers M, Futcher B. The size of the nucleus increases as yeast cells grow. Mol. Biol. Cell. 2007;18:3523–3532. - PMC - PubMed
    1. Rafelski SM, Viana MP, Zhang Y, Chan Y-HM, Thorn KS, Yam P, Fung JC, Li H, da F Costa L, Marshall WF. Mitochondrial network size scaling in budding yeast. Science. 2012;338:822–824. - PMC - PubMed
    1. Hazel J, Krutkramelis K, Mooney P, Tomschik M, Gerow K, Oakey J, Gatlin JC. Changes in cytoplasmic volume are sufficient to drive spindle scaling. Science. 2013;342:853–856. - PMC - PubMed
    1. Good MC, Vahey MD, Skandarajah A, Fletcher DA, Heald R. Cytoplasmic volume modulates spindle size during embryogenesis. Science. 2013;342:856–860. - PMC - PubMed

Publication types