. 2015 Mar 5;57(5):860-872.
doi: 10.1016/j.molcel.2015.01.018. Epub 2015 Feb 19.

Limited mitochondrial permeabilization causes DNA damage and genomic instability in the absence of cell death

Affiliations

Limited mitochondrial permeabilization causes DNA damage and genomic instability in the absence of cell death

Gabriel Ichim et al. Mol Cell. .

Erratum in

  • Mol Cell. 2015 Jun 4;58(5):900

Abstract

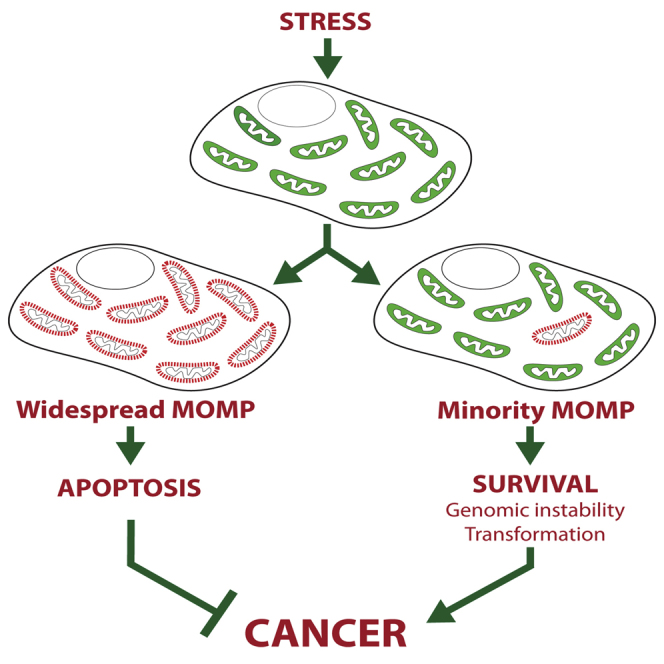
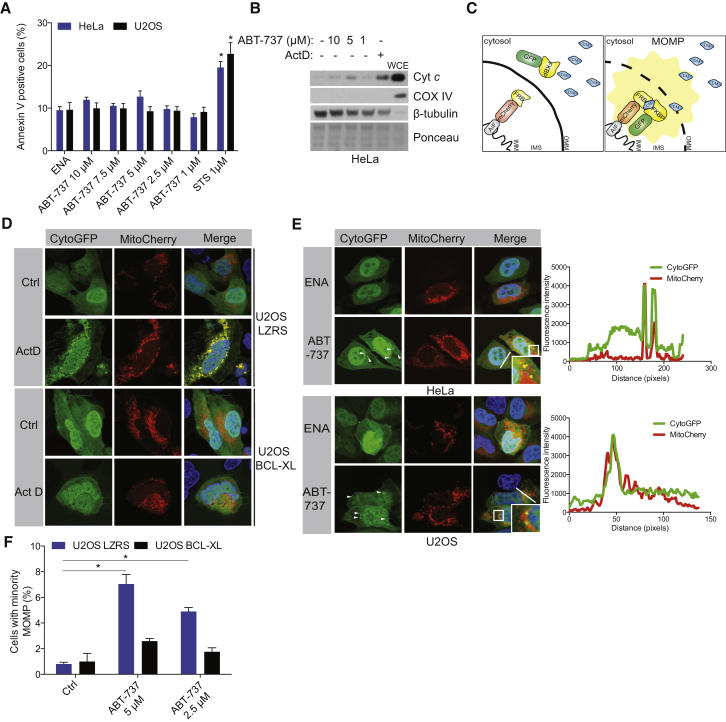
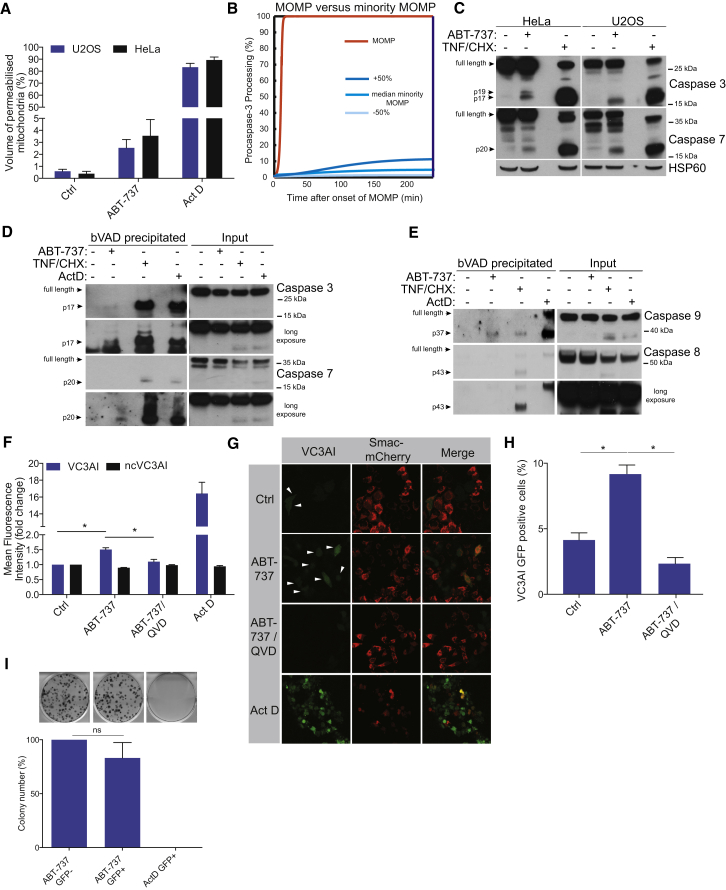
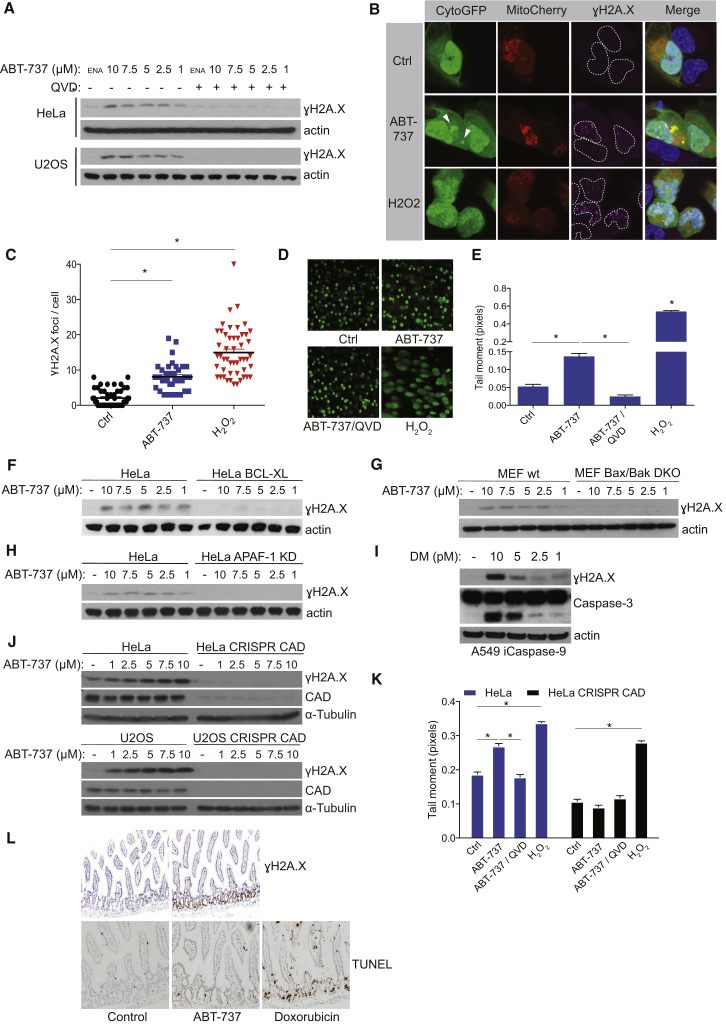
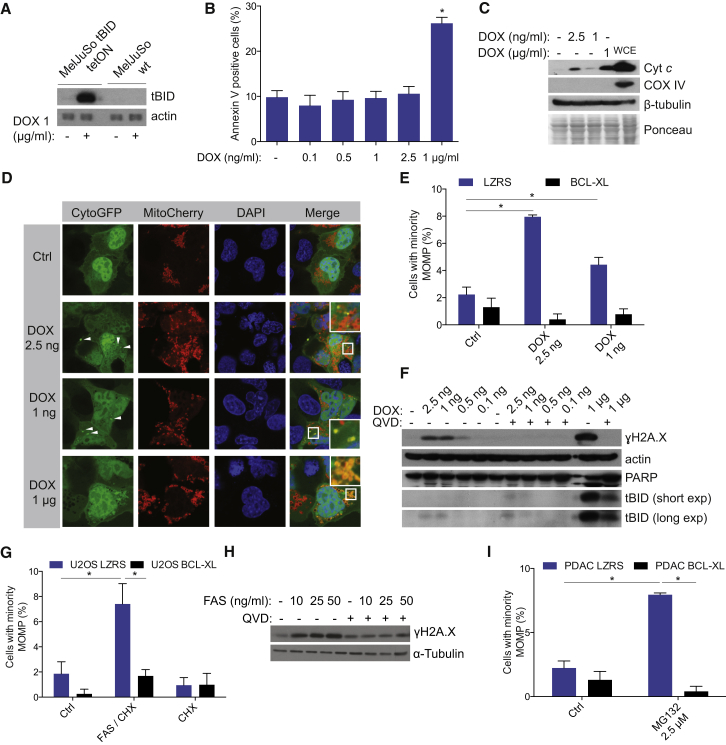
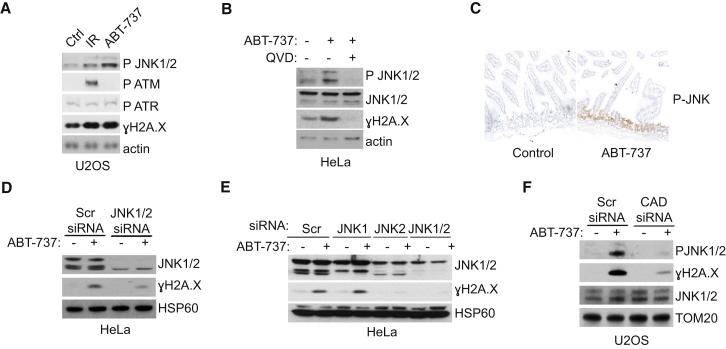
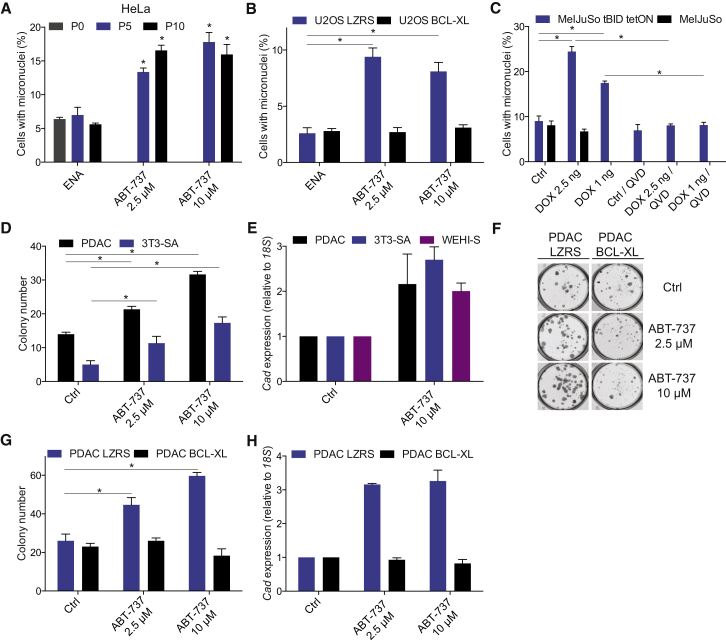
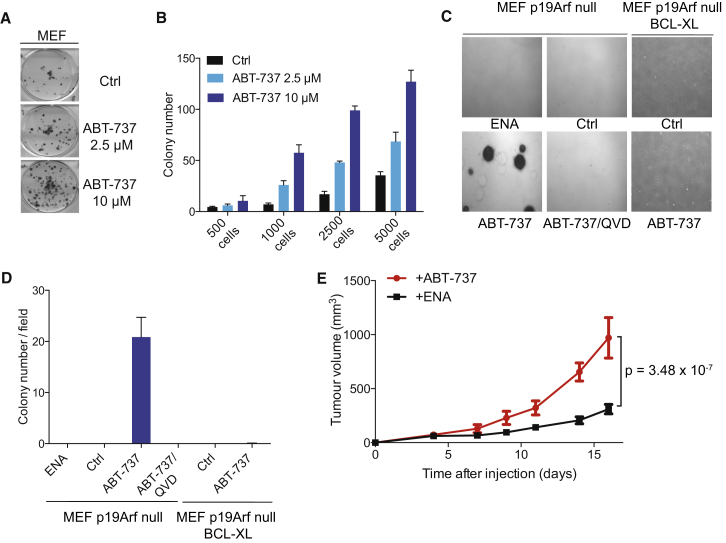
During apoptosis, the mitochondrial outer membrane is permeabilized, leading to the release of cytochrome c that activates downstream caspases. Mitochondrial outer membrane permeabilization (MOMP) has historically been thought to occur synchronously and completely throughout a cell, leading to rapid caspase activation and apoptosis. Using a new imaging approach, we demonstrate that MOMP is not an all-or-nothing event. Rather, we find that a minority of mitochondria can undergo MOMP in a stress-regulated manner, a phenomenon we term "minority MOMP." Crucially, minority MOMP leads to limited caspase activation, which is insufficient to trigger cell death. Instead, this caspase activity leads to DNA damage that, in turn, promotes genomic instability, cellular transformation, and tumorigenesis. Our data demonstrate that, in contrast to its well-established tumor suppressor function, apoptosis also has oncogenic potential that is regulated by the extent of MOMP. These findings have important implications for oncogenesis following either physiological or therapeutic engagement of apoptosis.


Figures

None
Graphical abstract
Figure 1
Figure 1
Limited Mitochondrial Outer Membrane Permeabilization Occurs without Triggering Cell Death (A) HeLa and U2OS cells were treated for 3 hr with different concentrations of ABT-737 or enantiomer (ENA, 10 μM) or with staurosporine (STS, 1 μM) for 12 hr and analyzed by flow cytometry for Annexin V-positive cells. Data represent mean ± SEM of three independent experiments. (B) HeLa cells were treated for 3 hr with different concentrations of ABT-737 or actinomycin D for 6 hr (Act D, 1 μM), and cytosolic extracts were western blotted for cytochrome c, COX IV, and β-tubulin. WCE, whole-cell extract. (C) Schematic representation of GFP relocalization-based MOMP detection method. DM, chemical heterodimerizer; IMM, inner mitochondrial membrane; IMS, intermembrane space; OMM, outer mitochondrial membrane. (D) U2OS cells expressing vector or BCL-xL together with CytoGFP/MitoCherry were treated with Act D (1 μM) for 3 hr in the presence of heterodimerizer and imaged by confocal microscopy. (E) HeLa or U2OS cells expressing CytoGFP/MitoCherry were treated with vehicle or ABT-737 (5 μM) or enantiomer (5 μM, ENA) for 3 hr and imaged by confocal microscopy. Arrows denote permeabilized mitochondria. Line scans represent variation in red and green fluorescence intensity along the denoted line. (F) U2OS cells expressing CytoGFP/MitoCherry were treated for 3 hr with ABT-737, and minority MOMP was quantified. Data represent mean ± SEM of three independent experiments. p < 0.05, compared versus control. See also Figure S1 and Movies S1 and S2.
Figure 2
Figure 2
Minority MOMP Engages Sub-Lethal Caspase Activity (A) U2OS and HeLa cells expressing CytoGFP/MitoCherry were treated or not with ABT-737 (10 μM for 3 hr in the presence of dimerizer) to induce minority MOMP, and then z stack confocal imaging was performed. Act D (1 μM) was used to induce complete MOMP. Mitochondrial volume was measured using ImageJ. Data represent mean of permeabilized mitochondrial volume ± SEM from ten cells per condition. (B) Data from (A) were used as inputs into a mathematical HeLa cell model of apoptosis execution signaling to calculate the consequences of minority MOMP on the efficacy of procaspase-3 processing. (C) HeLa and U2OS cells were treated with ABT-737 (10 μM) or TNF/CHX (20 ng/ml TNF and 1 μg/ml CHX) for 3 hr, and cell extracts were western blotted for caspases-3 and -7. (D) Biotinylated-VAD-FMK (bVAD) was incubated with HeLa cells for 1 hr following 3 hr treatments with the indicated stimuli. Cell lysates and precipitated proteins were western blotted for caspases-3 and -7. (E) As in (D), except HeLa cells were pre-incubated for 1 hr with bVAD and treated for 3 hr with ABT-737 (10 μM) or 16 hr Act D (16 hr, 1 μM) or 3 hr TNF/CHX (20 ng/ml TNF and 1 μg/ml CHX). Proteins were precipitated with neutravidin agarose resin. Cell lysates and precipitated proteins were western blotted for caspases-8 and -9. (F) HeLa cells stably expressing the caspase activity reporter (VC3AI) or non-cleavable control (ncVC3AI) were treated for 24 hr with 10 μM ABT-737 in presence or absence of Q-VD-OPh (10 μM). GFP mean fluorescence intensity of the viable cells was quantified by flow cytometry. Results represent the fold increase in fluorescence over control. Data represent mean ± SEM of four independent experiments. (G) HeLa cells stably expressing VC3AI together with Smac-mCherry were treated as in (F) and imaged for GFP. Arrows denote caspase reporter (GFP)-positive cells. (H) Quantification of percentage of GFP-positive cells following ABT-737 (10 μM) treatment in the presence or absence of Q-VD-OPh (10 μM). Data represent mean ± SEM of three independent experiments. (I) HeLa VC3AI cells were treated with ABT-737 (10 μM) for 24 hr or Act D (0.5 μM), and equal numbers of GFP-positive cells (ABT-737 and Act D treated sample) and GFP-negative cells (ABT-737 treated cells) were sorted by flow cytometry and assessed for clonogenic survival. Data represent mean ± SEM of three independent experiments. p < 0.05, compared versus control. See also Figure S2.
Figure 3
Figure 3
Minority MOMP Induces Caspase-Dependent DNA Damage (A) HeLa and U2OS cells were treated for 3 hr with indicated sub-lethal doses of ABT-737 or enantiomer (10 μM, ENA) in presence or absence of caspase inhibitor Q-VD-OPh (10 μM). Cell lysates were for probed by western blot for γH2A.X and actin (as loading control). (B) U2OS cells transiently expressing CytoGFP and MitoCherry were treated with ABT-737 (5 μM) for 3 hr or H2O2 (25 μM) for 10 min and immunostained for γH2A.X. Representative images are shown. (C) Quantification of γH2A.X foci in cells displaying minority MOMP (ABT-737-treated cells), control, and H2O2-treated cells. Data represent mean ± SEM of three independent experiments. (D) HeLa cells were treated as in (B) and subject to comet assay. Representative images are shown. (E) Quantification of comet tail moment following ABT-737 treatment. Data represent mean ± SEM of three independent experiments. (F–H) HeLa and HeLa overexpressing BCL-xL (F), wild-type MEF and MEF double knockout for Bax and Bak (G), or HeLa versus HeLa knockdown for APAF-1 (H) were treated as in (A) and western blotted for γH2A.X and actin. (I) A549 cells expressing caspase-9 fused to a FKBP dimerization domain were treated with indicated sub-lethal concentrations of homodimerizer (DM) for 3 hr to induce caspase-9 dimerization and activation. Cleavage of caspase-3 and γH2A.X was assessed by western blot. (J) Wild-type HeLa and U2OS cells and their Cad-deleted counterparts were treated and immunoblotted as in (A). (K) Wild-type and Cad-deleted HeLa cells were treated as in (D) and used to perform comet assay. Graph represents quantification of comet tail moment. Data represent mean ± SEM of four independent experiments. (L) Representative images of γH2A.X and TUNEL immunohistochemical staining in small intestine of mice treated with ABT-737 (75 mg/kg) for 1 day (n = 3). p < 0.05, compared versus control. See also Figure S3.
Figure 4
Figure 4
Sub-Lethal BH3-Only Protein and Apoptotic Stress Induces Minority MOMP and DNA Damage (A) MelJuSo tBID tetON or wild-type cells were treated for 12 hr with 1 μg/ml of doxycycline (DOX), and cell lysates were probed for tBID. (B) MelJuSo tBID tetON cells were treated for 6 hr with DOX and cell viability was assessed by Annexin V-based flow cytometry. Data represent mean ± SEM of three independent experiments. p < 0.05, compared to control. (C) Cytosolic fractions from MelJuSo tetON tBID cells treated as in (B) were probed for cytochrome c. To induce apoptosis, 1 μg/ml DOX was used as a positive control. WCE, whole-cell extract. (D) MelJuSo tBID tetON expressing CytoGFP/MitoCherry were treated with DOX as in (A) and imaged by confocal microscopy. Arrows denote mitochondria undergoing permeabilization. (E) Quantification of cells undergoing minority MOMP. Data represent mean ± SEM of three independent experiments. (F) MelJuSo tBID tetON were treated with DOX as in (A) and cell lysates were probed by western blot for γH2A.X, PARP, and tBID. (G) U2OS cells stably expressing empty vector or BCL-xL were treated for 3 hr with FAS ligand (10 ng/ml) and CHX (1 μg/ml) and scored for the presence of minority MOMP. Data represent mean ± SEM of three independent experiments. (H) U2OS cells were treated for 3 hr with the indicated concentrations of FAS ligand and CHX (1 μg/ml), and western blot was performed for γH2A.X. (I) PDAC cells were treated with MG132 (2.5 μM) for 3 hr, and minority MOMP was quantified. Data represent mean ± SEM of three independent experiments. p < 0.05, compared versus control. See also Figure S4.
Figure 5
Figure 5
JNK Regulates the DNA Damage Response (A) U2OS cells were treated for 3 hr with 10 μM ABT-737, and phospho JNK1/2, ATM, and ATR were assessed by western blot. Ionizing radiation (2 Gy) was used as a positive control. (B) U2OS were treated with ABT-737 as in (A) in the presence or absence of Q-VD-OPh (10 μM) and immunoblotted for P-JNK1/2 and γH2A.X. (C) Representative images of P-JNK1/2 immunohistochemical staining in small intestine of mice treated with ABT-737 (75 mg/kg) for 1 day (n = 3); untreated mice (n = 3) were used as control. (D) HeLa cells were transiently transfected with siRNA for JNK1/2 and treated as in (A). Cell lysates were probed for total JNK1/2 and γH2A.X. (E) As in (D), except that siRNA oligos targeting JNK1, JNK2, or both JNK1 and JNK2 together were used. (F) U2OS cells were transfected with siRNA targeting CAD and treated with ABT-737. Cell lysates were probed for γH2A.X and P-JNK1/2. See also Figure S5.
Figure 6
Figure 6
Minority MOMP Promotes Genomic Instability (A) HeLa cells were treated daily with ABT-737 or enantiomer (10 μM, Ctrl) at the indicated concentrations for either 5 (P5) or 10 (P10) passages and then scored for micronuclei. Data represent mean ± SEM of three independent experiments. (B) U2OS cells stably expressing BCL-xL (U2OS BCL-xL) or empty vector (U2OS LZRS) were treated as in (A) and assessed for micronuclei. Data represent mean ± SEM of three independent experiments. (C) MelJuSo tetON or wild-type MelJuSo cells were treated daily for ten passages with the indicated concentration of doxycycline (DOX) in the absence or presence of Q-VD-OPh, and micronuclei were scored. Data represent mean ± SEM of three independent experiments. (D) PDAC and 3T3-SA cells were treated daily for five passages with ABT-737 at the indicated concentrations, and clonogenic survival assay was performed in media containing PALA (100 μM). Data represent mean ± SEM of three independent experiments. (E) Genomic DNA was extracted from PALA-resistant PDAC, 3T3-SA, and WEHI-S clones, and Cad gene levels were quantified by qPCR. Data represent the mean ± SD from triplicate samples from a representative experiment carried out twice independently. (F) Representative images of PALA-resistant colonies from PDAC cells stably expressing BCL-xL (PDAC BCL-xL) or empty vector (PDAC LZRS). Cells were treated daily for five passages with ABT-737 at the indicated concentrations, and clonogenic survival assay was performed in media containing PALA (100 μM). (G) Quantification of PALA-resistance clonogenic survival in PDAC BCL-xL versus PDAC LZRS cells. Data represent mean ± SEM of three independent experiments. (H) Cad expression in PDAC BCL-xL and PDAC-LZRS PALA resistant colonies. Data represent the mean from a representative experiment carried out twice independently. Where stated, p < 0.05, compared versus control. See also Figure S6.
Figure 7
Figure 7
Minority MOMP Promotes Transformation and Tumorigenesis (A and B) Primary mouse embryonic fibroblasts (MEF) were treated daily for seven passages with the indicated concentrations of ABT-737 and transduced with E1A- and KRAS-expressing retrovirus. Representative images are shown in (A), and quantitation of the number of transformed colonies is depicted in (B). Data represent mean ± SEM of triplicate samples for a representative experiment (out of three independent experiments). (C) Primary p19Arf null MEFs or p19Arf null MEFs transduced with empty vector or BCL-xL-expressing retrovirus were treated for ten passages with ABT-737 (10 μM) in the presence or absence of Q-VD-OPh (10 μM), enantiomer (10 μM), or DMSO (Ctrl), and their anchorage-independent growth was assessed by soft agar assay. Representative images for each condition are shown. (D) Quantification of triplicate samples (mean ± SEM) from one representative soft agar assay (out of three independent experiments). (E) Primary p19Arf null MEF were treated with ABT-737 (10 μM) or enantiomer (ENA, 10 μM) for ten passages. CD1-Nude female mice were injected subcutaneously with treated MEF and tumor growth was measured over time. Data are plotted as mean with error bars representing 95% CI (n = 15 for both treatments). Applying Welch’s t test to the area-under-the-curve data produces a p value of 3.48 × 10−7 for the tumor growth rates. See also Figure S7.

Comment in

  • Life after MOMP.
    Gama V, Deshmukh M. Gama V, et al. Mol Cell. 2015 Apr 16;58(2):199-201. doi: 10.1016/j.molcel.2015.03.035. Mol Cell. 2015. PMID: 25884366 Free PMC article.

References

    1. Belshaw P.J., Ho S.N., Crabtree G.R., Schreiber S.L. Controlling protein association and subcellular localization with a synthetic ligand that induces heterodimerization of proteins. Proc. Natl. Acad. Sci. USA. 1996;93:4604–4607. - PMC - PubMed
    1. Berardo M.D., Elledge R.M., de Moor C., Clark G.M., Osborne C.K., Allred D.C. bcl-2 and apoptosis in lymph node positive breast carcinoma. Cancer. 1998;82:1296–1302. - PubMed
    1. Biswas S., Shi Q., Wernick A., Aiello A., Zinkel S.S. The loss of the BH3-only Bcl-2 family member Bid delays T-cell leukemogenesis in Atm-/- mice. Cell Death Differ. 2013;20:869–877. - PMC - PubMed
    1. Colell A., Ricci J.E., Tait S., Milasta S., Maurer U., Bouchier-Hayes L., Fitzgerald P., Guio-Carrion A., Waterhouse N.J., Li C.W. GAPDH and autophagy preserve survival after apoptotic cytochrome c release in the absence of caspase activation. Cell. 2007;129:983–997. - PubMed
    1. Delbridge A.R., Valente L.J., Strasser A. The role of the apoptotic machinery in tumor suppression. Cold Spring Harb. Perspect. Biol. 2012;4 pii: a008789. - PMC - PubMed

Publication types

MeSH terms