

Bridging topological and functional information in protein interaction networks by short loops profiling
- PMID: 25703051
- PMCID: PMC5224520
- DOI: 10.1038/srep08540
Bridging topological and functional information in protein interaction networks by short loops profiling
Abstract
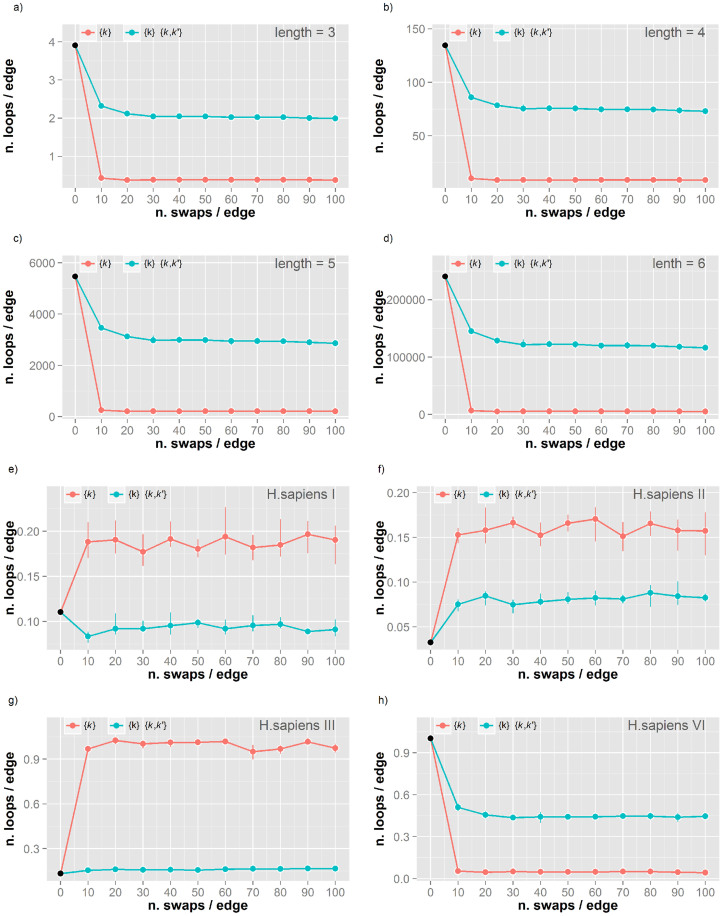
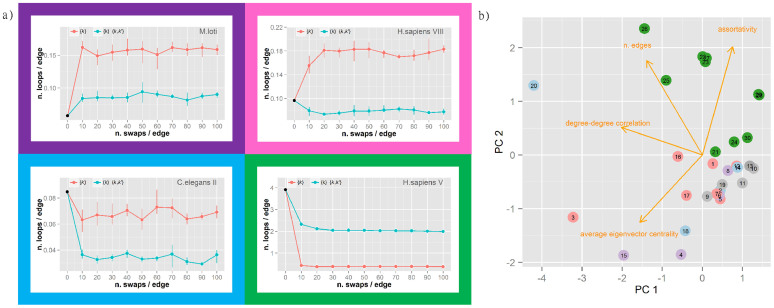
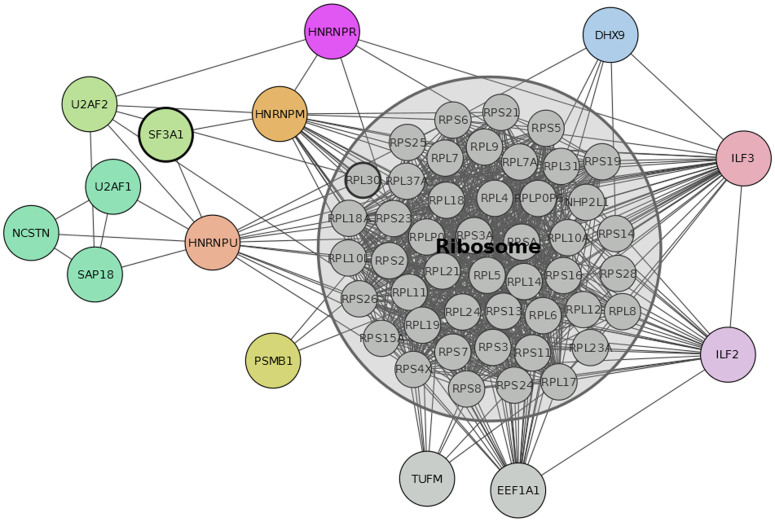
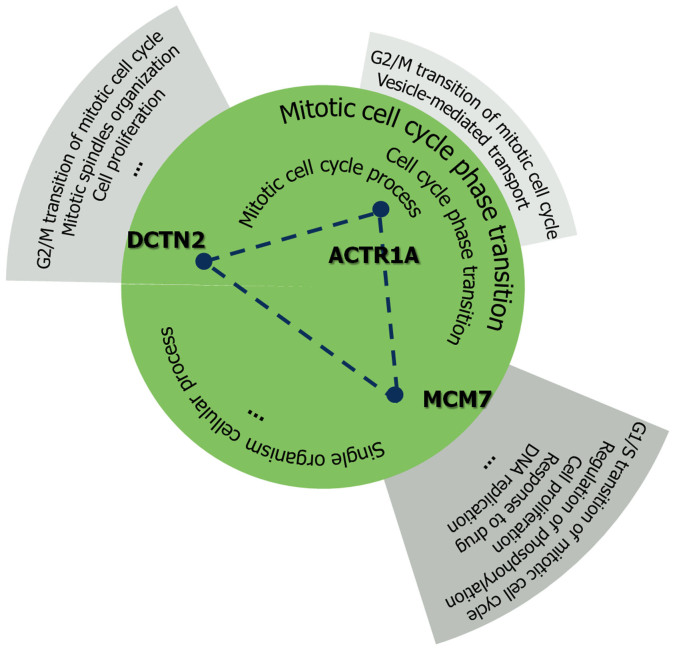
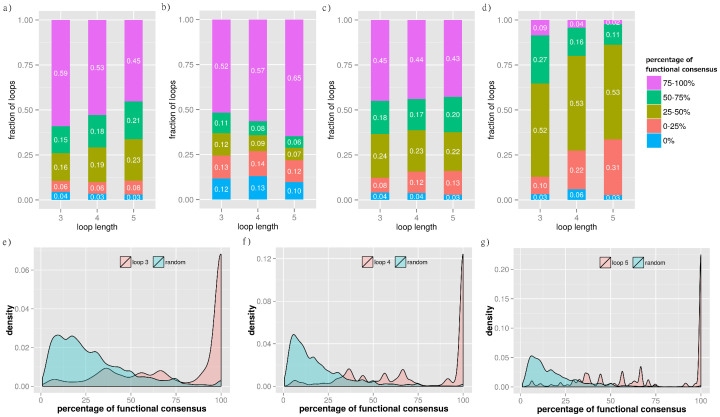
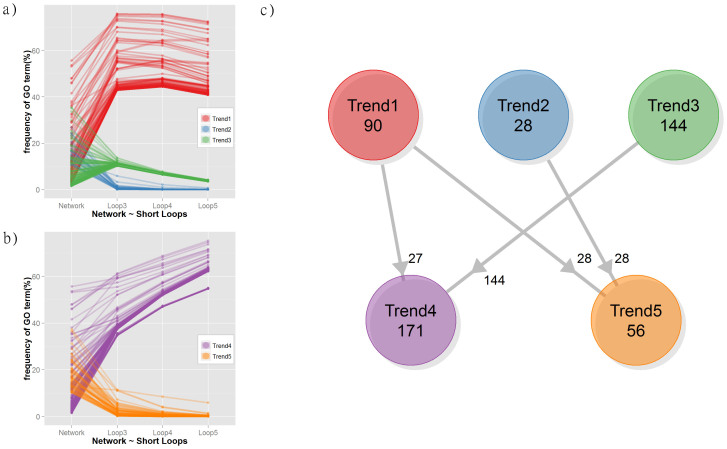
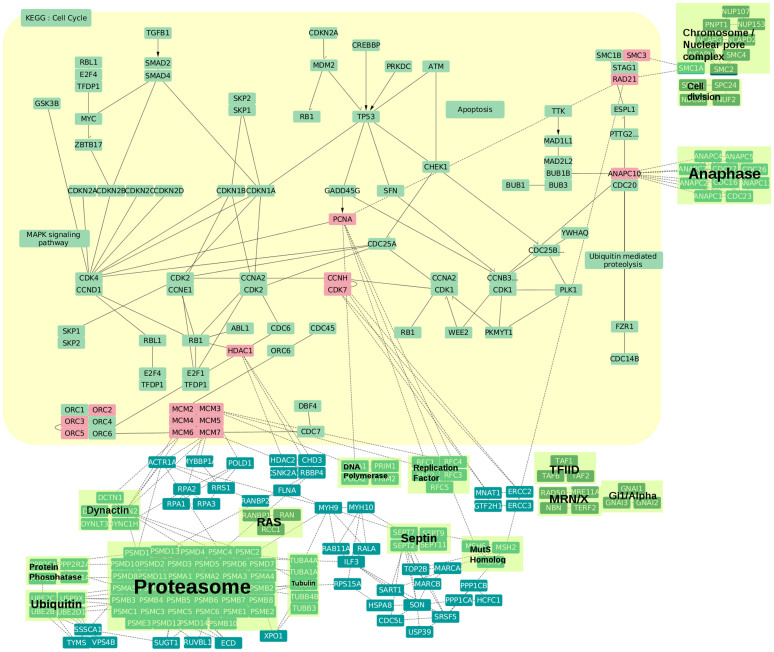
Protein-protein interaction networks (PPINs) have been employed to identify potential novel interconnections between proteins as well as crucial cellular functions. In this study we identify fundamental principles of PPIN topologies by analysing network motifs of short loops, which are small cyclic interactions of between 3 and 6 proteins. We compared 30 PPINs with corresponding randomised null models and examined the occurrence of common biological functions in loops extracted from a cross-validated high-confidence dataset of 622 human protein complexes. We demonstrate that loops are an intrinsic feature of PPINs and that specific cell functions are predominantly performed by loops of different lengths. Topologically, we find that loops are strongly related to the accuracy of PPINs and define a core of interactions with high resilience. The identification of this core and the analysis of loop composition are promising tools to assess PPIN quality and to uncover possible biases from experimental detection methods. More than 96% of loops share at least one biological function, with enrichment of cellular functions related to mRNA metabolic processing and the cell cycle. Our analyses suggest that these motifs can be used in the design of targeted experiments for functional phenotype detection.
Figures
Similar articles
-
Sensitivity analysis on protein-protein interaction networks through deep graph networks.BMC Bioinformatics. 2025 May 8;26(1):124. doi: 10.1186/s12859-025-06140-1. BMC Bioinformatics. 2025. PMID: 40340825 Free PMC article.
-
Triangle network motifs predict complexes by complementing high-error interactomes with structural information.BMC Bioinformatics. 2009 Jun 27;10:196. doi: 10.1186/1471-2105-10-196. BMC Bioinformatics. 2009. PMID: 19558694 Free PMC article.
-
Protein-protein interaction networks studies and importance of 3D structure knowledge.Expert Rev Proteomics. 2013 Dec;10(6):511-20. doi: 10.1586/14789450.2013.856764. Expert Rev Proteomics. 2013. PMID: 24206225 Review.
-
AligNet: alignment of protein-protein interaction networks.BMC Bioinformatics. 2020 Nov 18;21(Suppl 6):265. doi: 10.1186/s12859-020-3502-1. BMC Bioinformatics. 2020. PMID: 33203353 Free PMC article.
-
[Protein-protein interacting networks, their structures and disease-related mutations].Biol Aujourdhui. 2017;211(3):223-228. doi: 10.1051/jbio/2017031. Epub 2018 Feb 7. Biol Aujourdhui. 2017. PMID: 29412132 Review. French.
Cited by
-
IRES-dependent translated genes in fungi: computational prediction, phylogenetic conservation and functional association.BMC Genomics. 2015 Dec 15;16:1059. doi: 10.1186/s12864-015-2266-x. BMC Genomics. 2015. PMID: 26666532 Free PMC article.
-
Thermodynamic measures of cancer: Gibbs free energy and entropy of protein-protein interactions.J Biol Phys. 2016 Jun;42(3):339-50. doi: 10.1007/s10867-016-9410-y. Epub 2016 Mar 24. J Biol Phys. 2016. PMID: 27012959 Free PMC article.
-
Data-dependent visualization of biological networks in the web-browser with NDExEdit.PLoS Comput Biol. 2022 Jun 8;18(6):e1010205. doi: 10.1371/journal.pcbi.1010205. eCollection 2022 Jun. PLoS Comput Biol. 2022. PMID: 35675360 Free PMC article.
-
Network-Based Methods for Identifying Key Active Proteins in the Extracellular Electron Transfer Process in Shewanella oneidensis MR-1.Genes (Basel). 2018 Jan 16;9(1):41. doi: 10.3390/genes9010041. Genes (Basel). 2018. PMID: 29337910 Free PMC article.
-
PinSnps: structural and functional analysis of SNPs in the context of protein interaction networks.Bioinformatics. 2016 Aug 15;32(16):2534-6. doi: 10.1093/bioinformatics/btw153. Epub 2016 Mar 24. Bioinformatics. 2016. PMID: 27153707 Free PMC article.
References
-
- Vidal M. A unifying view of 21st century systems biology. FEBS Letters 583, 3891–3894 (2009). - PubMed
Publication types
MeSH terms
Substances
Grants and funding
LinkOut - more resources
Full Text Sources
Other Literature Sources
