. 2015 Mar 3;23(3):584-597.
doi: 10.1016/j.str.2014.12.019. Epub 2015 Feb 19.

Nothing to sneeze at: a dynamic and integrative computational model of an influenza A virion

Affiliations

Nothing to sneeze at: a dynamic and integrative computational model of an influenza A virion

Tyler Reddy et al. Structure. .

Abstract

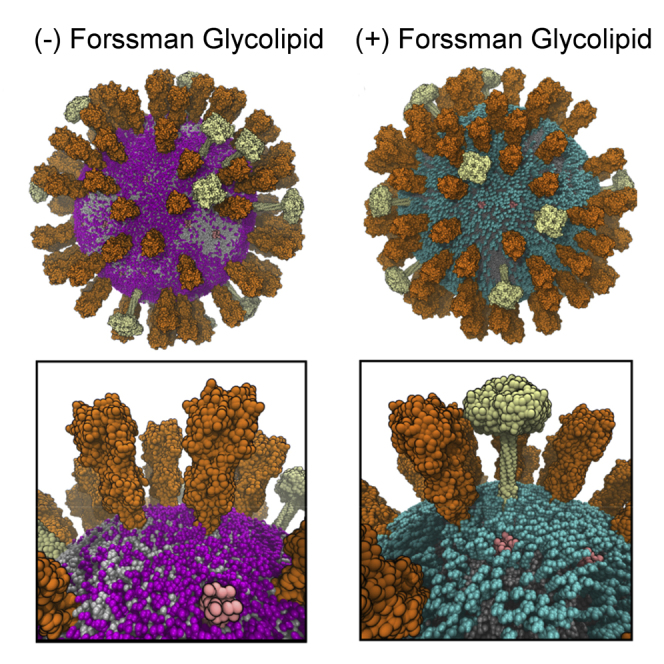
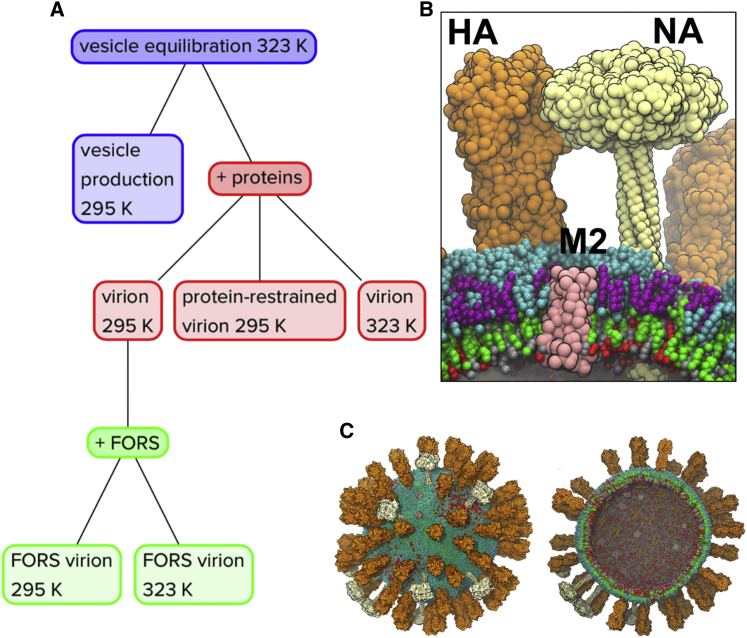
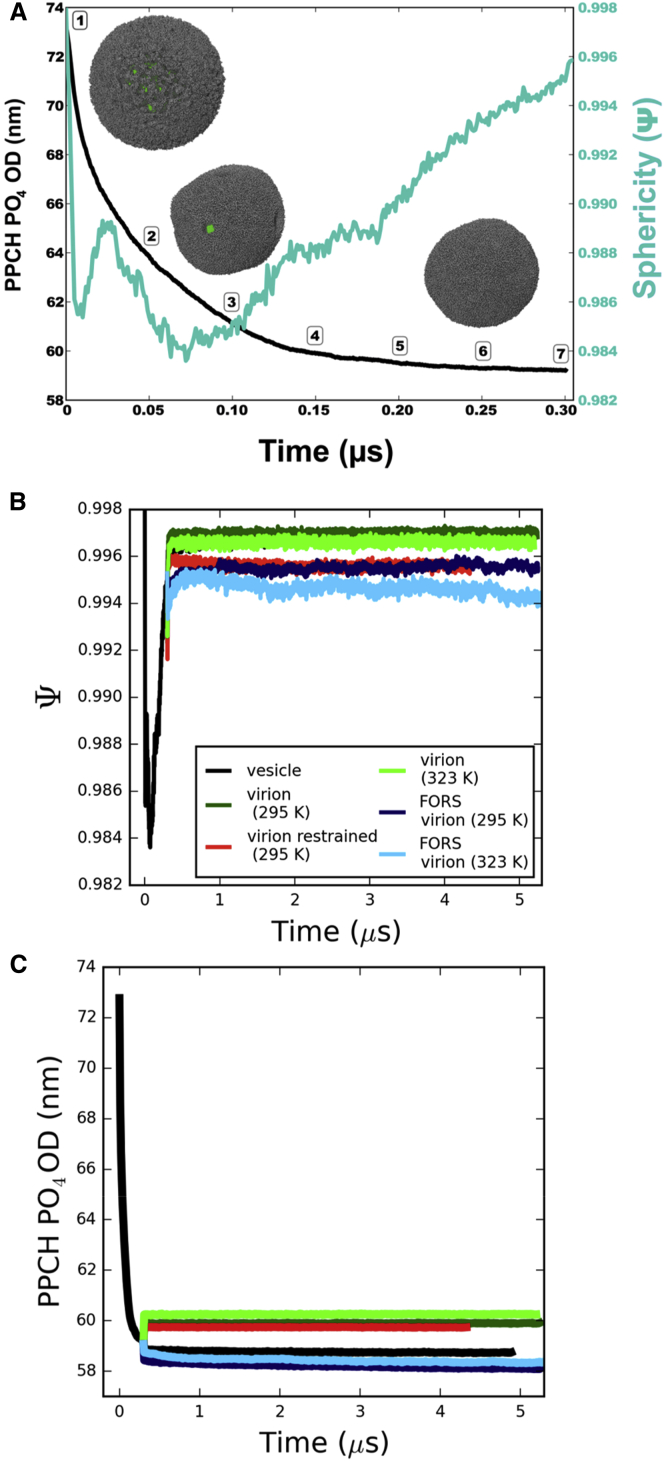
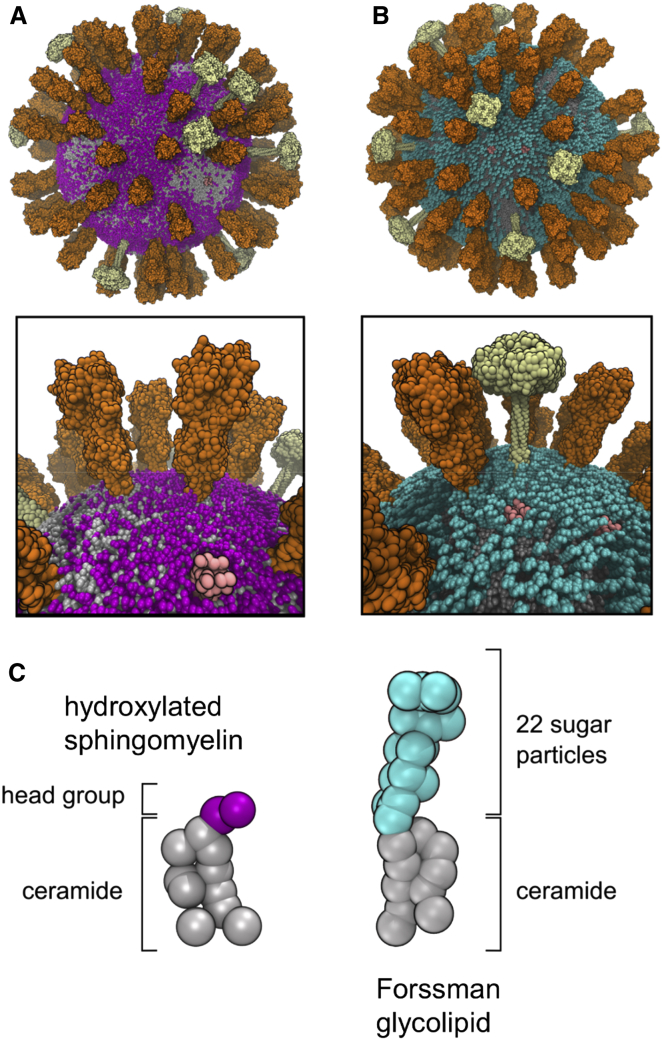
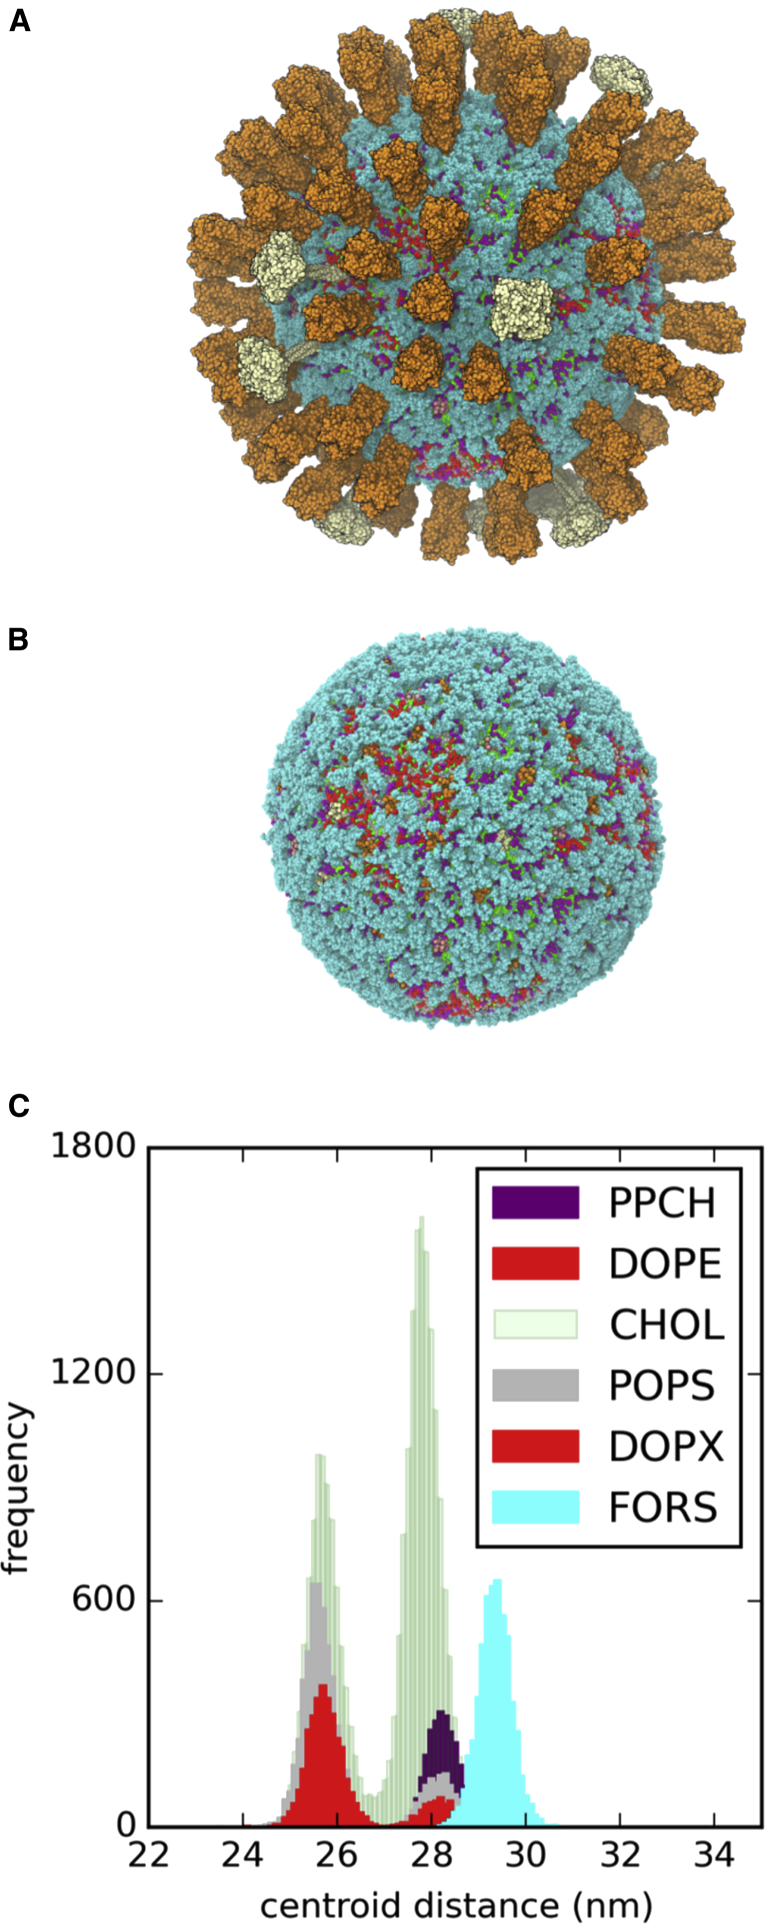
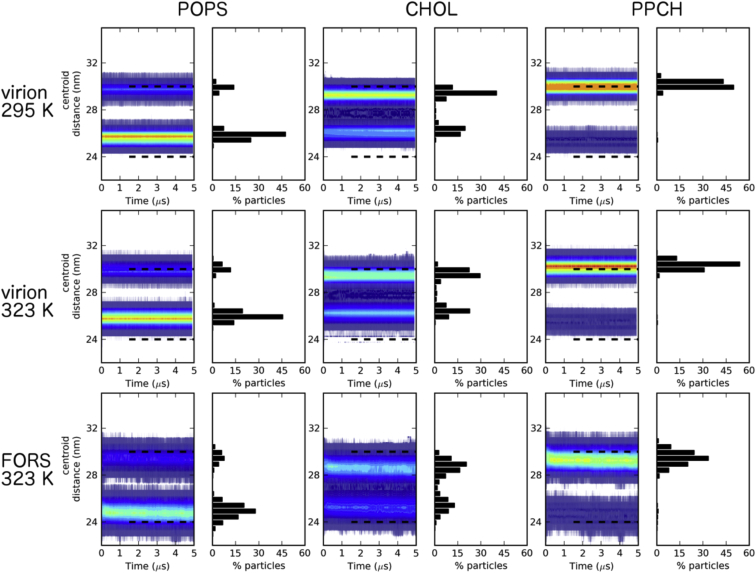
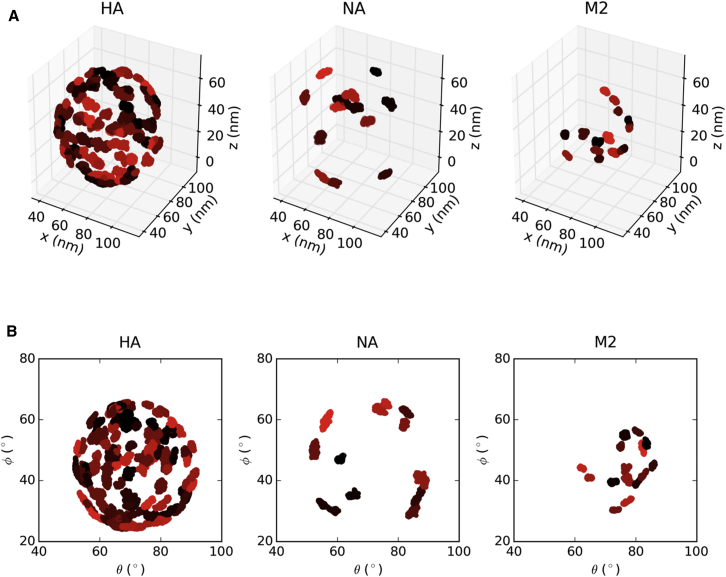
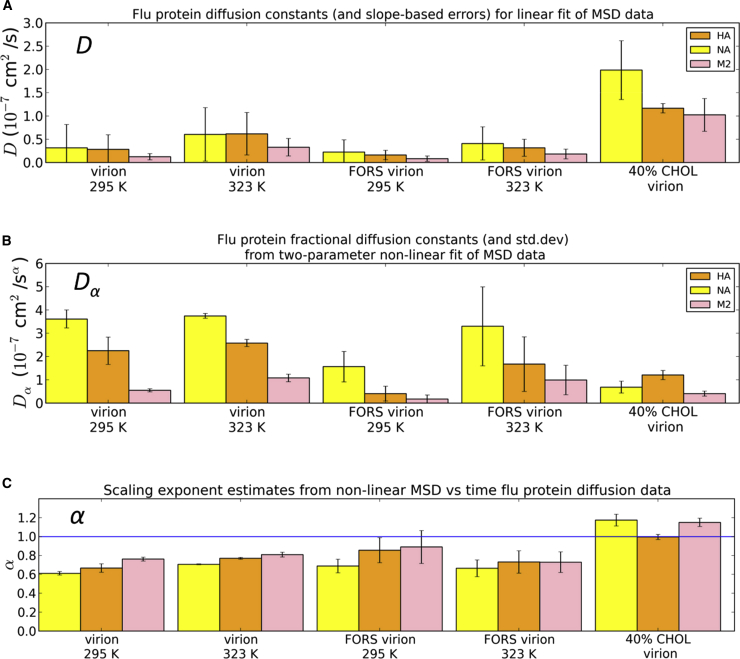
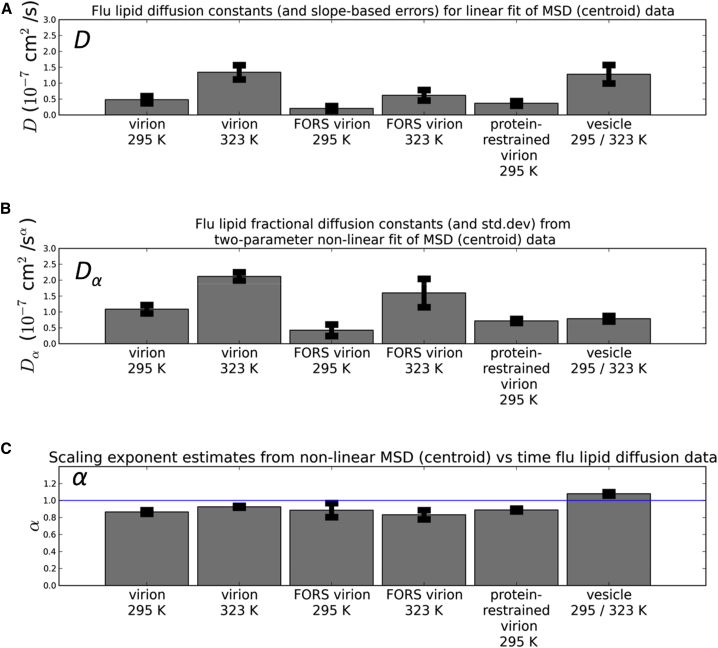
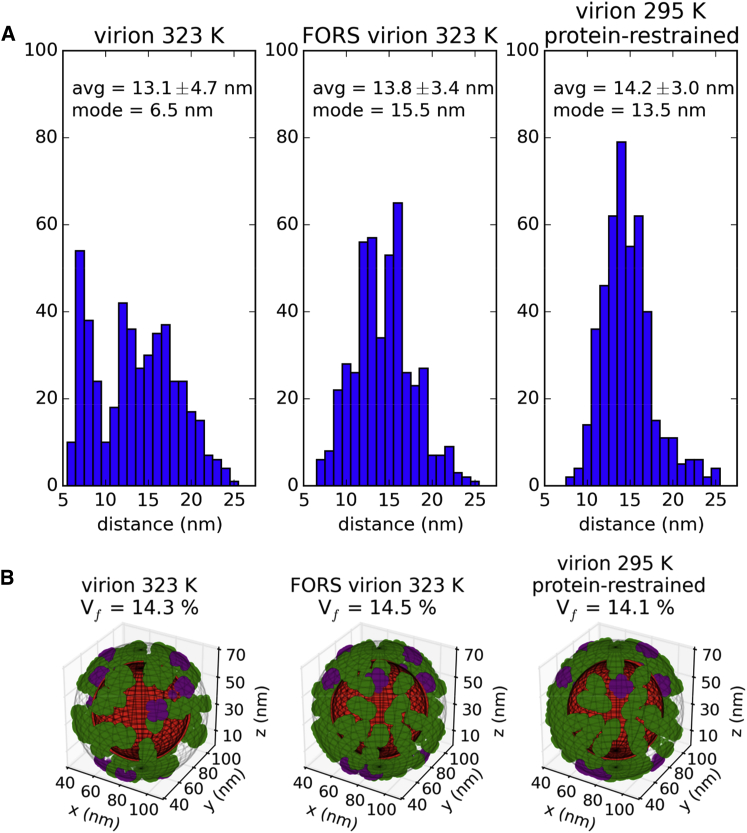
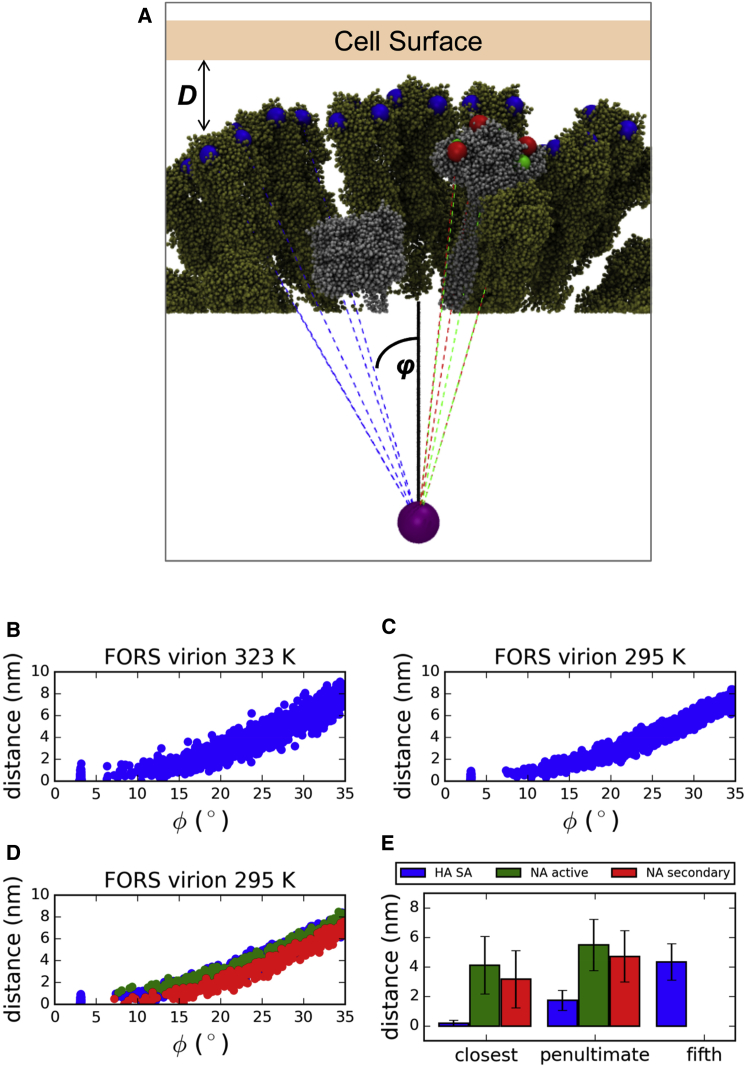
The influenza virus is surrounded by an envelope composed of a lipid bilayer and integral membrane proteins. Understanding the structural dynamics of the membrane envelope provides biophysical insights into aspects of viral function, such as the wide-ranging survival times of the virion in different environments. We have combined experimental data from X-ray crystallography, nuclear magnetic resonance spectroscopy, cryo-electron microscopy, and lipidomics to build a model of the intact influenza A virion. This is the basis of microsecond-scale coarse-grained molecular dynamics simulations of the virion, providing simulations at different temperatures and with varying lipid compositions. The presence of the Forssman glycolipid alters a number of biophysical properties of the virion, resulting in reduced mobility of bilayer lipid and protein species. Reduced mobility in the virion membrane may confer physical robustness to changes in environmental conditions. Our simulations indicate that viral spike proteins do not aggregate and thus are competent for multivalent immunoglobulin G interactions.


Figures

None
Graphical abstract
Figure 1
Figure 1
Influenza Virion Models and Simulations (A) Flowchart summary of the influenza A virion simulations. The initial vesicle equilibration simulation was for 0.3 μs; all other simulations were for ∼5 μs. The lipid species used include palmitoyl-oleoyl-phosphatidylserine (POPS), dioleoylphosphatidylethanolamine (DOPE), ether-linked DOPE (DOPX), cholesterol (CHOL), hydroxylated sphingomyelin (PPCH), and the Forssman glycolipid (FORS). All virion simulations including proteins contained 80 HA trimers, 12 NA tetramers, and 15 M2 tetramers. A restrained inner core of 31,767 particles was assembled into a hollow sphere to represent the approximate volume occupied by the nucleoprotein. The systems also contained ∼5% antifreeze water. (B) Zoom-in view of a representative region from the FORS-inclusive virion simulation at 323 K showing the HA (orange), NA (white), and M2 (pink) viral proteins in the context of the multicomponent asymmetric lipid envelope (CHOL: green; DOPE/X: red; FORS: cyan; POPS: silver; PPCH: purple). (C) The starting configuration of the 295 K virion simulation. An outside view (left) and a cross-sectional view (right) are shown, the central core having been omitted from the latter diagram for clarity. See also Figures S1–S3 and S18. See also Supplemental Information Files S20–S24 for coordinate files corresponding to the virus models at the end of each of the five simulations.
Figure 2
Figure 2
Progress of the Simulations (A) Progress of the 0.3 μs vesicle equilibration simulation, tracking the outer diameter (black line, left-hand axis) and sphericity (cyan, right-hand axis) as functions of time. The outer diameter is calculated as twice the average radius of all hydroxylated sphingomyelin headgroup phosphate (PPCH PO4) particles from the lipid centroid of the system. Seven time points are marked in 50 ns intervals. The inset images of the equilibrating vesicle (at time points 1, 3, and 6) have lipids shown in gray and the central core in green. (B and C) Progress of the virion model simulations was also monitored by tracking sphericity (B) and outer diameter (C). The vesicle (black, temperature adjusted from 323 to 295 K at 0.3 μs), the virion (295 K, dark green; 323 K, light green), the protein-restrained virion (red), and the Forssman glycolipid inclusive virion (295 K, dark blue; 323 K, light blue) are shown. See also Figures S4 and S5.
Figure 3
Figure 3
Virion Models and Glycolipids (A and B) Visual comparison of virion starting models without (A) and containing (B) the Forssman glycolipid (cyan). Overall and zoom-in views of the respective virions are shown. (C) Comparison of the CG representations of a hydroxylated sphingomyelin and a Forssman glycolipid. See also Figure S3.
Figure 4
Figure 4
Snapshot at the End of the 295 K + Forssman Glycolipid Virion Simulation (A and B) Protein ectodomains are shown in (A) and omitted for clarity in (B) (HA orange, NA white, M2 pink). The glycolipid is shown in cyan. (C) The composition of lipid species and their distributions between the inner and outer leaflets of the bilayer are shown as a histogram of centroid distances from the overall virion centroid, with the colors approximately matched to those used for lipids in the structural snapshots.
Figure 5
Figure 5
Distribution of Selected Lipids between the Outer and Inner Leaflets of the Bilayer Heatmaps are shown for the time-dependent distributions of the distances between lipid species and the virion centroid. These are shown for representative inner leaflet (POPS, left), central (CHOL, middle), and outer leaflet species (PPCH, right). Phosphate particles were used for POPS and PPCH, while the ROH group was used for calculations with CHOL. The histogram data from the last analyzed frame of each replicate is shown to the right of each contour plot. See also Figures S6 and S17.
Figure 6
Figure 6
Protein Mobility during the Simulation (A and B) The centroids of all 107 influenza membrane proteins were tracked over the duration of the virion simulation at 295 K excluding the Forssman glycolipid. The results are shown in Cartesian coordinate space (A) or in 2D spherical polar projection space (B). Each individual protein centroid is colored in a different shade for each of the three protein types. See also Figure S8.
Figure 7
Figure 7
Protein Diffusion Coefficients (A–C) Protein diffusion coefficients calculated for either (A) linear (MSD = 4Dt) or (B) nonlinear (MSD = 4Dαtα) diffusion models. The scaling exponents (C), α, were also calculated for the nonlinear fit to the data, with values <1 consistent with anomalous subdiffusion and values ≅1 consistent with random-walk diffusion. SD values were extracted from two-parameter fits for the nonlinear analysis while uncertainties in the linear data were estimated as the difference between the slopes of the first and final halves of the MSD versus time data. See also Figure S9.
Figure 8
Figure 8
Lipid Diffusion Coefficients (A–C) Lipid diffusion coefficients calculated for either (A) linear (MSD = 4Dt) or (B) nonlinear (MSD = 4Dαtα) diffusion models and their reported uncertainties were averaged across all lipid species for a given simulation condition. The scaling exponents (C), α, were also calculated for the nonlinear fit to the data. The uncertainty metrics are as described in Figure 7, and the full diffusion analysis results for all lipid species in all simulation conditions is available in the Supporting Information. See also Figure S10.
Figure 9
Figure 9
Spatial Disposition of Membrane Proteins (A) Comparison of interprotein distance histograms in final snapshots of simulations (excluding the M2 proton channel). The centroids of each protein were employed and the closest five neighboring proteins were included for 460 distances. (B) Assessment of influenza A spike glycoprotein fractional surface volume in final snapshots of production simulations. The phosphate particles in each virion (red) were used to define the inner boundary of the outer surface layer (contained within a diffuse meshgrid), while the outer boundary was assigned 13 nm farther from the virion centroid (contained within outermost diffuse meshgrid). The coordinates of particles representing the convex hulls of the spike glycoproteins are shown for HA (green) and NA (purple). The percentage of the outer surface layer volume (Vf) occupied by the spike glycoproteins is indicated above each condition. See also Figures S11–S15 and S19.
Figure 10
Figure 10
Geometric Constraints on the Binding of HA Trimers and NA Tetramers on the Approximately Spherical Influenza A Virion Surface at the End of the Simulations to Sialic Acid Receptors on an Idealized Host Cell Surface (A) Schematic of SA receptor binding sites (blue) in HA trimers (tan), and of active site (green) and secondary SA receptor binding sites (red) in NA tetramers (silver) for 1/80 randomly chosen influenza A virion-host cell attack orientations with a single reference HA aligned along the +Z direction (solid black line). A subset of the binding site vectors (dashed lines) are shown and their angles (φ) are measured relative to the +Z reference axis. Putative binding sites are only shown if they fall within φ ± 35° of the virion centroid (purple sphere). (B and C) The cumulative (all 80 attack orientations) HA binding site surface distances and their corresponding angles are plotted for the FORS-inclusive virion at both simulation temperatures. (D and E) The matching results for SA binding sites on NA are also plotted for comparison for the FORS-inclusive virion at 295 K (D), with the closest, penultimate and fifth-closest average protein binding site distances compared (E), where available. For the FORS-inclusive virion at 295 K, the two closest HA trimers have average SA to binding site distances of 0.18 ± 0.20 nm and 1.73 ± 0.68 nm, respectively, which may be compared with closest HA and closest neighbor measured experimentally (Wasilewski et al., 2012). See also Figure S16.

Comment in

Similar articles

Cited by

References

    1. Almeida P.F.F., Vaz W.L.C. Lateral diffusion in membranes. In: Lipowsky R., Sackmann E., editors. Structure and Dynamics of Membranes: From Cells to Vesicles. Vol. 1. North-Holland; 1995. pp. 305–357. (Handbook of Biological Physics).
    1. Ayton G.S., Voth G.A. Hybrid coarse-graining approach for lipid bilayers at large length and time scales. J. Phys. Chem. B. 2009;113:4413–4424. - PMC - PubMed
    1. Ayton G.S., Voth G.A. Systematic multiscale simulation of membranes protein systems. Curr. Opin. Struct. Biol. 2009;19:138–144. - PMC - PubMed
    1. Ayton G.S., Voth G.A. Multiscale computer simulation of the immature HIV-1 virion. Biophys. J. 2010;99:2757–2765. - PMC - PubMed
    1. Banks D.S., Fradin C. Anomalous diffusion of proteins due to molecular crowding. Biophys. J. 2005;89:2960–2971. - PMC - PubMed

Publication types

LinkOut - more resources