. 2015 Mar 3;23(3):527-541.
doi: 10.1016/j.str.2015.01.009. Epub 2015 Feb 19.

The membrane- and soluble-protein helix-helix interactome: similar geometry via different interactions

Affiliations

The membrane- and soluble-protein helix-helix interactome: similar geometry via different interactions

Shao-Qing Zhang et al. Structure. .

Abstract

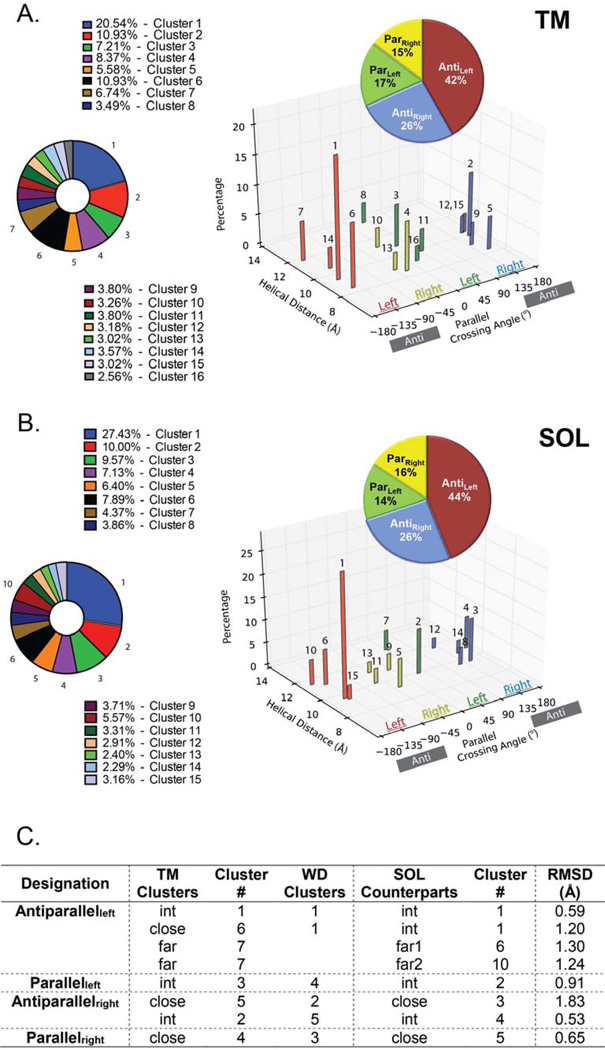
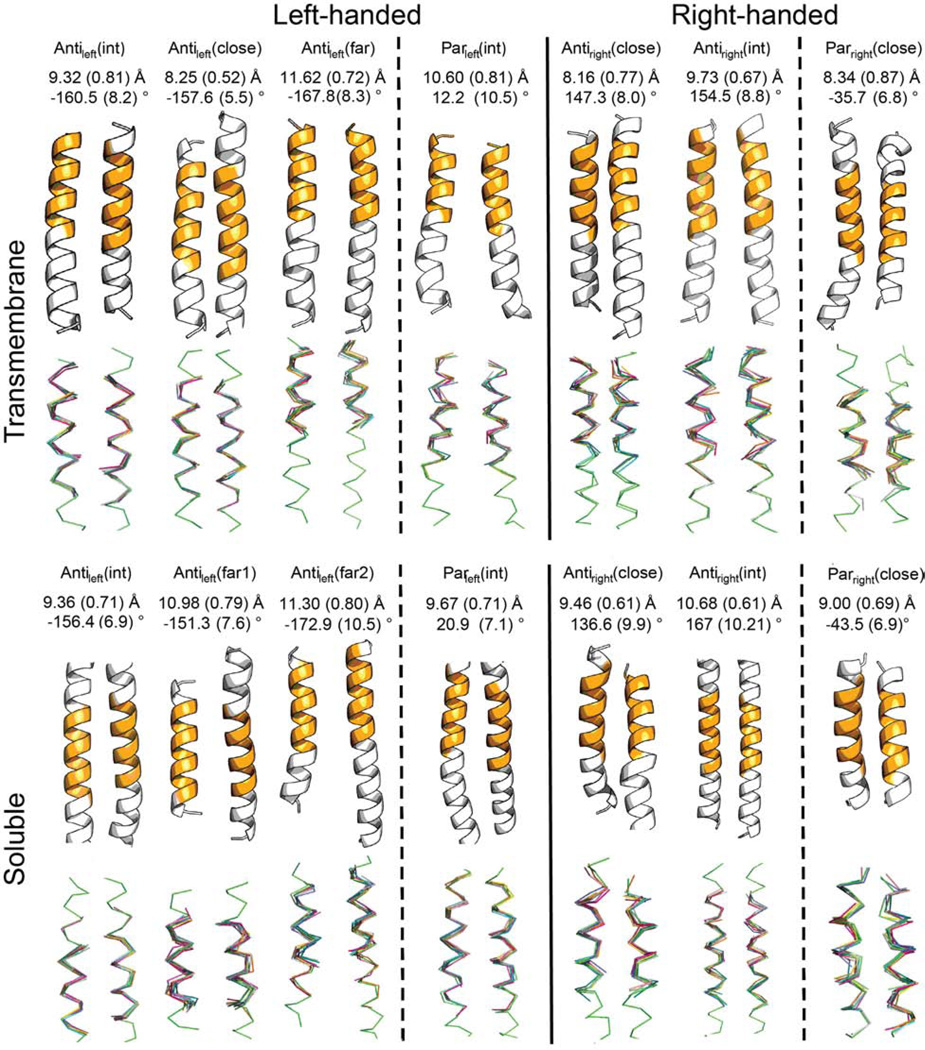
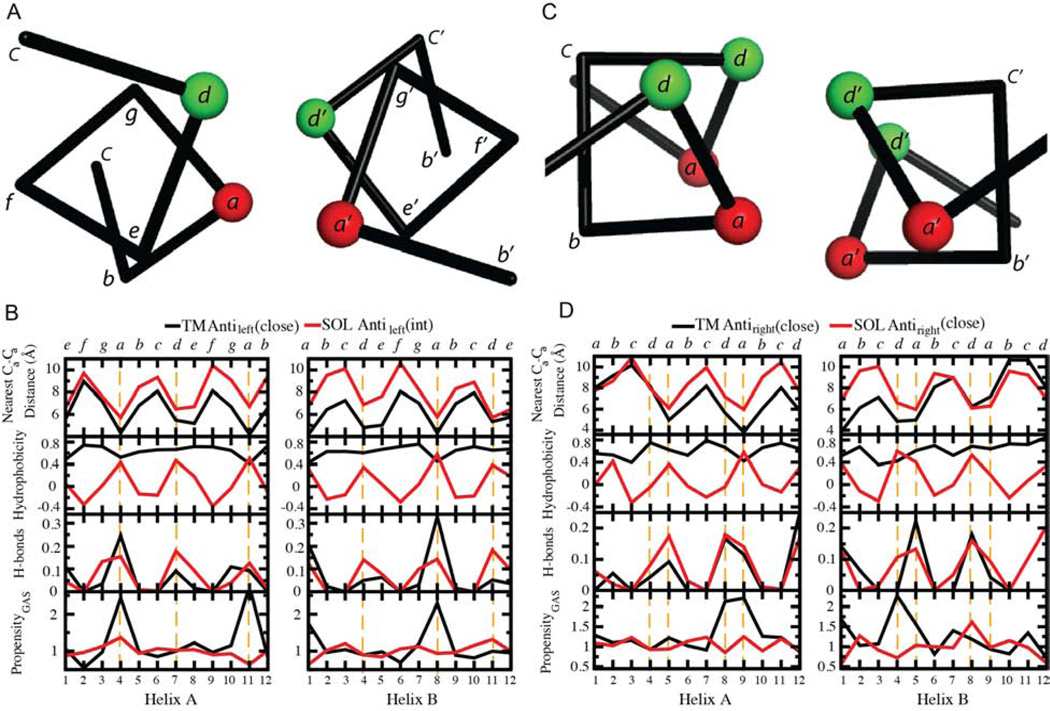
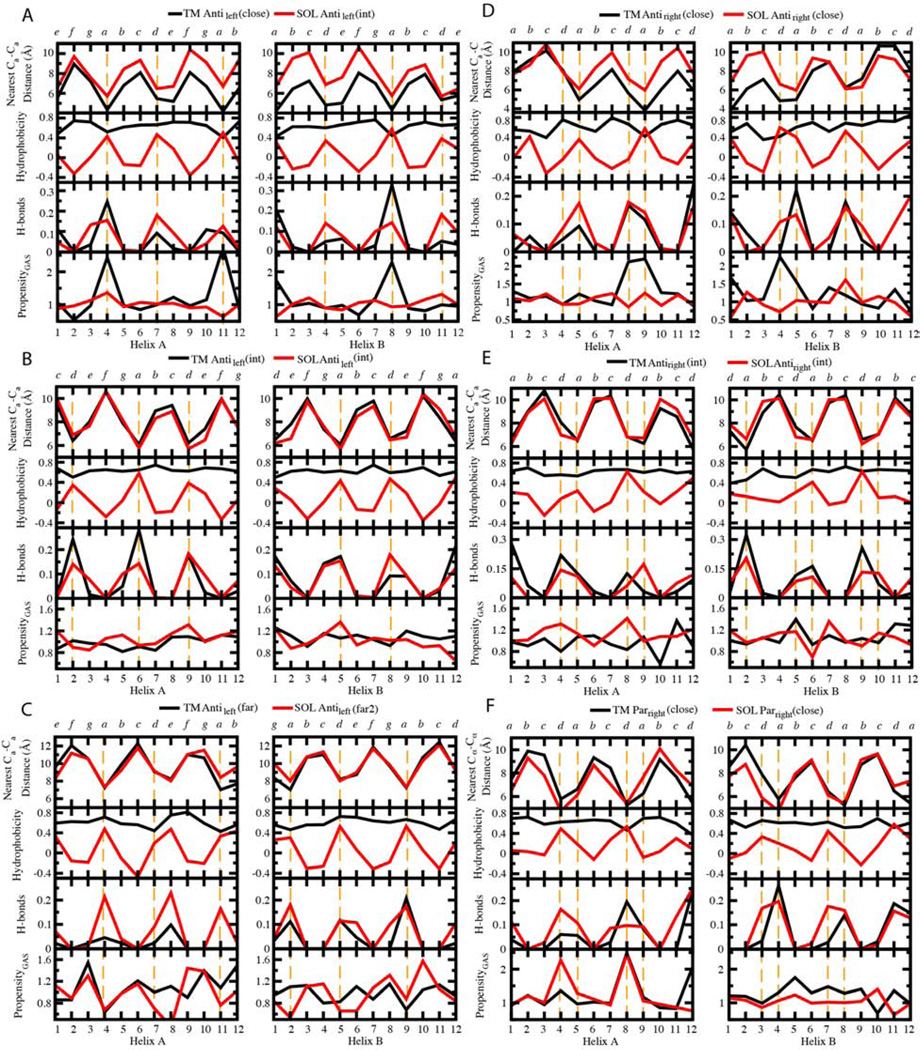
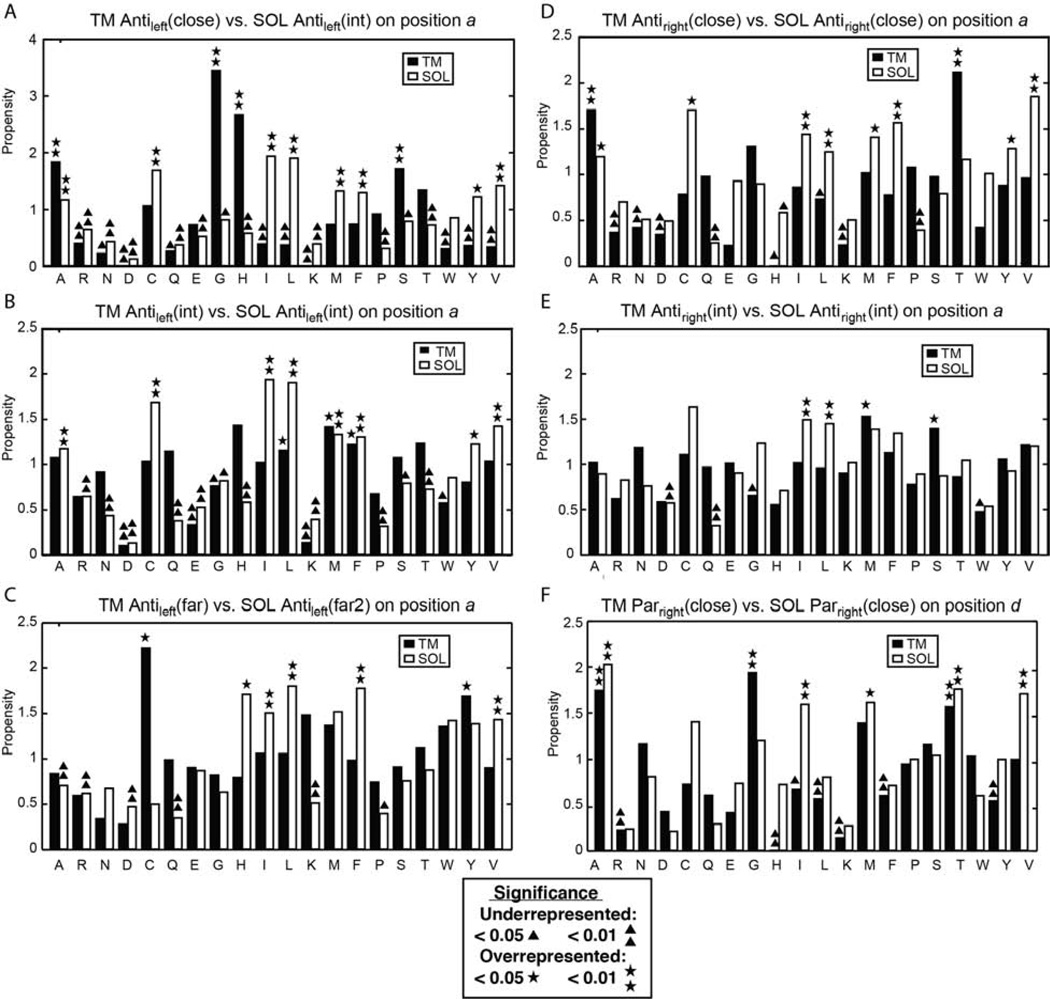
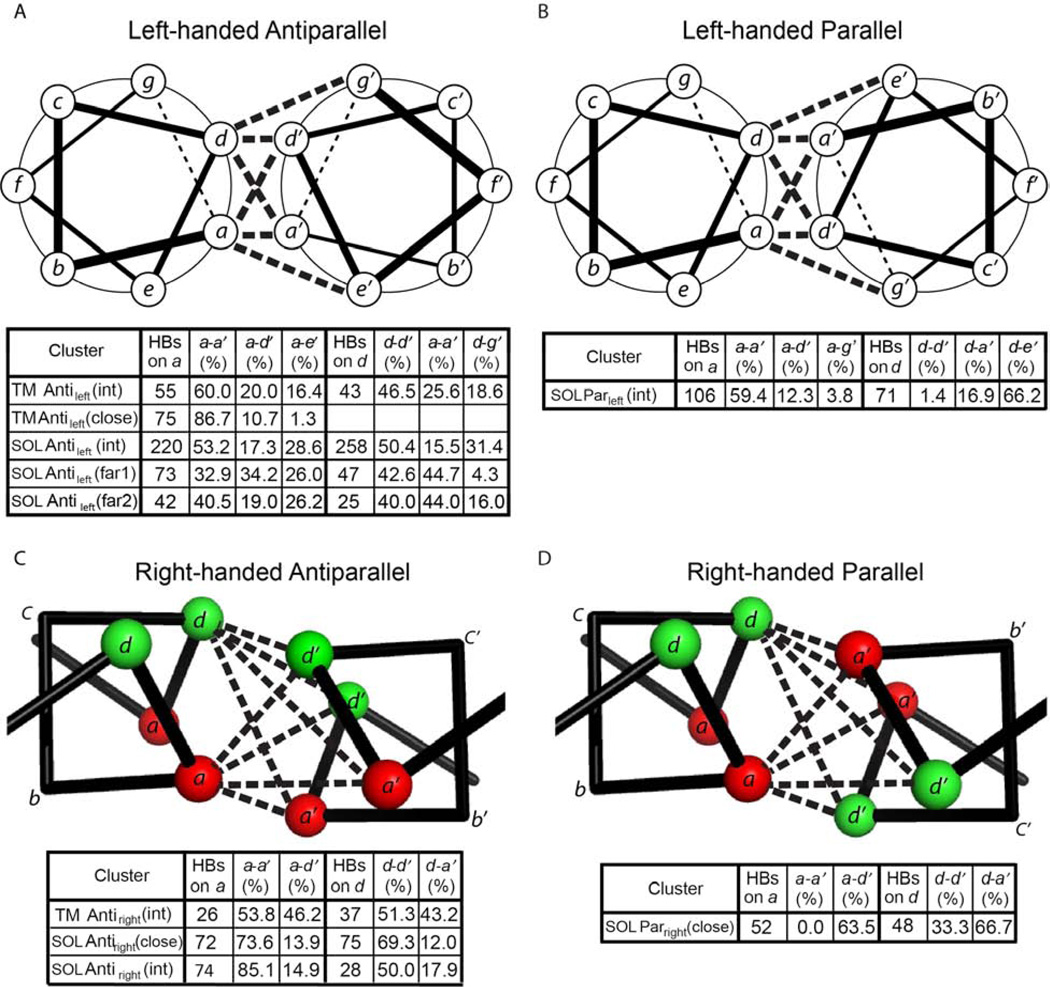
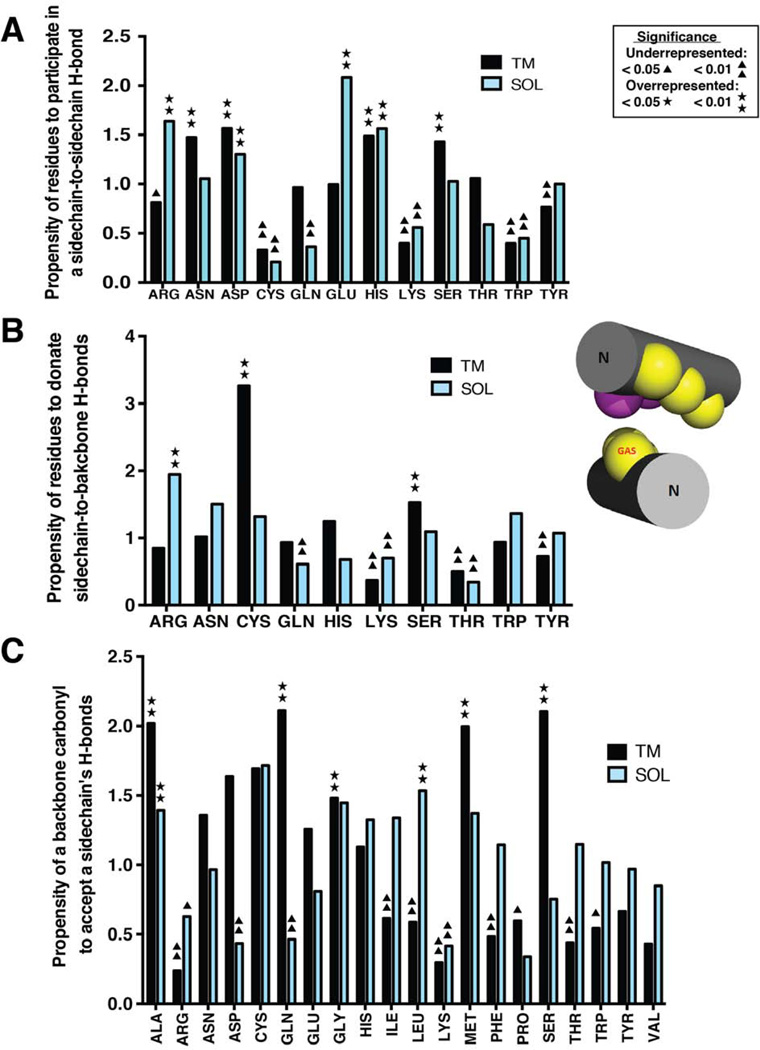
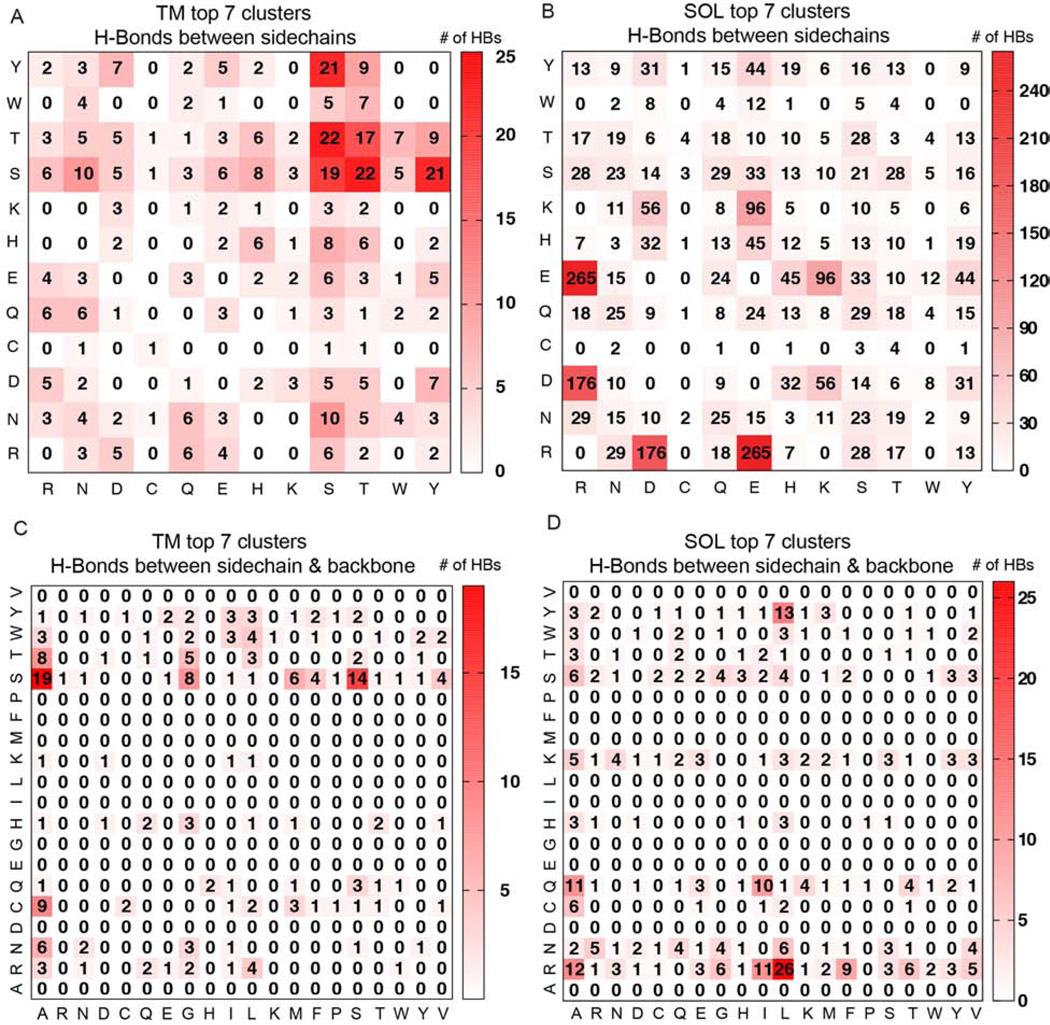
α Helices are a basic unit of protein secondary structure and therefore the interaction between helices is crucial to understanding tertiary and higher-order folds. Comparing subtle variations in the structural and sequence motifs between membrane and soluble proteins sheds light on the different constraints faced by each environment and elucidates the complex puzzle of membrane protein folding. Here, we demonstrate that membrane and water-soluble helix pairs share a small number of similar folds with various interhelical distances. The composition of the residues that pack at the interface between corresponding motifs shows that hydrophobic residues tend to be more enriched in the water-soluble class of structures and small residues in the transmembrane class. The latter group facilitates packing via sidechain- and backbone-mediated hydrogen bonds within the low-dielectric membrane milieu. The helix-helix interactome space, with its associated sequence preferences and accompanying hydrogen-bonding patterns, should be useful for engineering, prediction, and design of protein structure.


Figures

Figure 1
Figure 1. Similarities between the TM and SOL helix-helix clusters
A. Description of the 15 SOL (left panel) and 15 TM (right panel) clusters in respect to their crossing angle, interhelical distance. Helix-helix crossing angle is color coded by 90° segments as in the WD study (Walters and DeGrado, 2006) to Antileft (red), Parright (yellow), Parleft (green) and Antiright (blue) with the percentage of each group (insert pie graph) and B. each cluster (bottom pie graph) shown. C. The RMSD similarity of the top 7 TM clusters relative to their SOL structural counterparts are measured on the 12-residue windows on the centroids with the smallest RMSDs along the most populated 15-residue regions. The corresponding cluster number from the WD study is depicted.
Figure 2
Figure 2. Description of the seven frequent TM and SOL clusters
Average values of interhelical distance and crossing angle for the clusters are measured on the most populated 12-residue windows of the clusters colored in orange in the centroids and standard deviations are shown in parentheses. The top 10 members in the clusters with the closest RMSD to the centroid are overlapped in the bottom.
Figure 3
Figure 3. Profiles of the nearest Cα-Cα distance, average hydrophobicity, H-bonding fractions and propensity of small residues GAS on structurally matched windows between TM and SOL clusters
Residues at the interhelical interface are highlighted by orange dashed lines. The designation of positions in the heptad and tetrad repeats is shown at the top.
Figure 4
Figure 4. Comparisons of interhelical distances, average hydrophobicity, H-bonding fractions and propensity of small residues GAS for structurally matched TM and SOL motifs
The 12 residue window of each TM centroid that contains the most cluster members were chosen as a representative sample for analysis. These and the matching windows on each corresponding SOL cluster are analyzed together. Residues at the interhelical interface are highlighted by orange dashed lines. The interhelical distances refer to the closest distance at a given Cα for one helix to a Cα in the neighboring helix. This figure is continued for additional pairs in Figure S1.
Figure 5
Figure 5. Propensities of amino acids in different positions at the interhelical interface
Residues labeled by asterisks or triangles are statistically overrepresented or under-represented, respectively as determined by, respectively, the p-value of a binomial test (p <0.05 or <0.01), relative to the expected amino acid frequency as described in Experimental Procedures (Table S4). This figure is continued for additional pairs in Figure S2.
Figure 6
Figure 6. H-bonding connectivity networks for the clusters with different geometry
The number of hydrogen bonds is the arithmetic summation of those on the most populated position a or d from both chains. The percentage of each contact type, e.g. a-e’, is the fraction of the sum on that position, i.e. sum on an a or d.
Figure 7
Figure 7. Propensity of residues in the top 7 TM and SOL clusters to donate or accept an interhelical hydrogen bond of different types
(A) Interhelical hydrogen bonding propensity of residues participating in sidechain-to-sidechain hydrogen bonds. (B) Interhelical hydrogen bonding propensity of residues that donate a sidechain hydrogen bond to the backbone carbonyl on the helical pair. (C) Interhelical hydrogen bonding propensity of residues that accept a hydrogen bond via the backbone carbonyl to the sidechains of their helical pair. As an example, the TM Parright(close) motif adopts configuration shown in the insert. Positions a and b are represented by yellow and magenta spheres, respectively. The one-sided small residue positions are labelled by GAS. The N-termini of the helices are labeled. Residues labeled by asterisks or triangles are statistically overrepresented or underrepresented as hydrogen bond participants, respectively as determined by the p-value of a binomial test (p <0.05 or <0.01).
Figure 8
Figure 8. Number of interhelical H-Bonds between the sidechains of residues (A, B) and between sidechain and the backbone carbonyl (C, D) in the top 7 TM (A, C) and SOL (B, D) clusters
In A and B, the numbers in the grids are the arithmetic summations of the numbers of specific sidechain-to-sidechain hydrogen bonds in the top 7 clusters from each category. In C and D, the numbers of H-bonds denote those from the sidechain of the residue on the column to the backbone carbonyl on the residue on the row.

Comment in

References

    1. Acharya A, Rishi V, Vinson C. Stability of 100 homo and heterotypic coiled-coil a-a' pairs for ten amino acids (A, L, I, V, N, K, S, T, E, and R) Biochemistry. 2006;45:11324–11332. - PubMed
    1. Adamian L, Liang J. Interhelical hydrogen bonds and spatial motifs in membrane proteins: polar clamps and serine zippers. Proteins. 2002;47:209–218. - PubMed
    1. Baker E, Hubbard R. Hydrogen bonding in globular proteins. Progress in biophysics and molecular biology. 1984;44:97–179. - PubMed
    1. Bansal M, Kumar S, Velavan R. HELANAL: a program to characterize helix geometry in proteins. J Biomol Struct Dyn. 2000;17:811–819. - PubMed
    1. Barth P, Wallner B, Baker D. Prediction of membrane protein structures with complex topologies using limited constraints. Proceedings of the National Academy of Sciences of the United States of America. 2009;106:1409–1414. - PMC - PubMed

Publication types

Substances