Review
. 2015 Mar;264(1):88-102.
doi: 10.1111/imr.12269.

The human immune response to tuberculosis and its treatment: a view from the blood

Affiliations
Review

The human immune response to tuberculosis and its treatment: a view from the blood

Jacqueline M Cliff et al. Immunol Rev. 2015 Mar.

Abstract

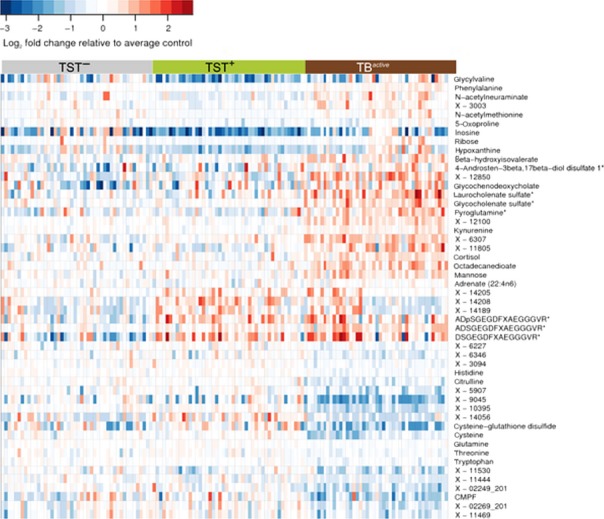
The immune response upon infection with the pathogen Mycobacterium tuberculosis is poorly understood, hampering the discovery of new treatments and the improvements in diagnosis. In the last years, a blood transcriptional signature in tuberculosis has provided knowledge on the immune response occurring during active tuberculosis disease. This signature was absent in the majority of asymptomatic individuals who are latently infected with M. tuberculosis (referred to as latent). Using modular and pathway analyses of the complex data has shown, now in multiple studies, that the signature of active tuberculosis is dominated by overexpression of interferon-inducible genes (consisting of both type I and type II interferon signaling), myeloid genes, and inflammatory genes. There is also downregulation of genes encoding B and T-cell function. The blood signature of tuberculosis correlates with the extent of radiographic disease and is diminished upon effective treatment suggesting the possibility of new improved strategies to support diagnostic assays and methods for drug treatment monitoring. The signature suggested a previously under-appreciated role for type I interferons in development of active tuberculosis disease, and numerous mechanisms have now been uncovered to explain how type I interferon impedes the protective response to M. tuberculosis infection.

Keywords: immune response; transcriptional signature; tuberculosis.


Figures

Figure 1
Figure 1
The blood transcriptional signature of active tuberculosis correlates with radiographic extent of disease in the lung. Hierarchical clustering analysis and statistical filtering generated a gene tree (green, left of figure) of 393 transcripts, and an expression profile (vertical columns) (4) (A) here shown for selected participants correlating with lung radiographic extent of disease. Each row of the heatmap represents an individual transcript and each column an individual participant. Relative abundance of transcripts is shown as: over-abundant red; under-abundant blue; median colored yellow. (B) The Weighted Molecular Distance to Health calculated for the transcriptional signature is shown against the score for the radiographic extent of disease. Adapted from Berry et al., 2010, Nature (4).
Figure 2
Figure 2
Comparison of differential expression in three independent cohorts. Comparison of differential gene expression between active tuberculosis (TB) and individuals with latently infected with M. tuberculosis (LTBI) in cohorts in South Africa (SUN) and The Gambia (MRC) with gene profiles in a cohort in the United Kingdom (UK) and South Africa identified by Berry et al. (4). Significance of differential expression at corrected p-value level of q  < 0.05. From Maertzdorf et al., 2011, Plos One (7).
Figure 3
Figure 3
The blood transcriptional signature of tuberculosis is diminished upon successful treatment. (A) The transcriptional signature of active TB is extinguished during treatment (4). (B) Transcriptional profiles of Active TB patients, resampled at 2 and 12 months postantimycobacterial drug treatment were compared with baseline and compared to X-ray (4). (C) The Weighted Molecular Distance to Health calculated for the transcriptional signature is shown against the time after treatment (A–C From Berry et al., Nature 2010) (4). (D) A blood transcript signature is seen to change on treatment by as early as 1 week (12) ‘Cliff et al., Distinct phases of blood gene expression pattern through tuberculosis treatment reflect modulation of the humoral immune response. (From Cliff et al., J Infect Dis 2013; 207(1): pp. 18–29, by permission of Oxford University Press’ (E) A 664 transcript signature is seen to change on treatment by as early as 2 weeks (From Bloom et al., Plos One 2012) (11).
Figure 4
Figure 4
The blood transcriptional signature changes during different phases of treatment. Pathway analysis of the blood transcriptional signature reveals (A) early changes in complement related genes after 1 week; (B) later changes of other gene sets and restoration of T and B-cell related genes. (C) There is heterogeneity in the rate of change of gene expression between patients, but large-scale similarity in the overall pattern of change. (From Cliff et al., Distinct phases of blood gene expression pattern through tuberculosis treatment reflect modulation of the humoral immune response. J Infect Dis 2013; 207(1): pp. 18–29, by permission of Oxford University Press).
Figure 5
Figure 5
Metabolomics uncovers a signature of active tuberculosis in the blood reflecting immunosuppression. Heat map showing fold changes of small metabolic compounds in the three study groups, tuberculosis patients, healthy uninfected, and latently infected individuals. Fold changes are relative to the average abundance in the tuberculin skin test (TST) – group. Red indicates relative abundance higher than average in the TST– group; blue indicates relative abundance lower than average in the TST– group. Horizontal axis: samples belonging to the three study groups; vertical axis: top 50 compounds selected by variable importance in RF analysis, including compounds that could not be identified, but were strong predictors of sample status. Color bars above the heat map denote study groups: gray, TST–; green, TST+; red, TBactive. (From Weiner et al., Plos One 2012) (52).
Figure 6
Figure 6
Modular and pathway analysis reveal a dominant IFN-inducible signature in tuberculosis. Modular analysis reveals overabundance of IFN-inducible genes (M3.1) and myeloid genes (M1.5 and M2.6) and under abundance of B (M1.3) and T cell (M2.8) related genes (A) (4); (B) (From Cliff et al., Distinct phases of blood gene expression pattern through tuberculosis treatment reflect modulation of the humoral immune response. J Infect Dis 2013; 207(1): pp. 18–29, by permission of Oxford University Press). (12). (C) The canonical pathway for IFN signaling from Ingenuity Pathways Analysis; with transcripts over-represented in test set patients with active tuberculosis (1, 4) shaded red. GAS, Gamma-activated site; ISRE, IFN-sensitive element. Modified from (1, 4). Transcript abundance in whole blood and (c) separated blood leucocyte populations of representative IFN-inducible genes (from top to bottom: OAS1, IFI6, IFI44, IFI44L, OAS3, IRF7,IFIH1, IFI16, IFIT3, IFIT2, OAS2, IFITM3, IFITM1, GBP1, GBP5, STAT1, GBP2, TAP1, STAT1, STAT2, IFI35, TAP2, CD274, SOCS1, CXCL10, IFIT5) in active tuberculosis. Transcript abundance/expression is normalized to the median of the healthy controls. Modified from (A and C modified from Berry et al., Nature 2010) (1, 3, 4).
Figure 7
Figure 7
Using a systems biology approach in infectious diseases. This figure defines the strategy for elucidating determinants of protection or disease in tuberculosis: an iterative process between human disease and experimental models. Modified from O'Garra et al., 2013 (1); O'Garra et al., 2013 (80); Berry et al., 2013 (3); Blankley et al., 2014 (5).

References

    1. O'Garra A, Redford PS, McNab FW, Bloom CI, Wilkinson RJ, Berry MP. The immune response in tuberculosis. Annu Rev Immunol. 2013;31:475–527. - PubMed
    1. Barry CE, 3rd, et al. The spectrum of latent tuberculosis: rethinking the biology and intervention strategies. Nat Rev Microbiol. 2009;7:845–855. - PMC - PubMed
    1. Berry MP, Blankley S, Graham CM, Bloom CI, O'Garra A. Systems approaches to studying the immune response in tuberculosis. Curr Opin Immunol. 2013;25:579–587. - PubMed
    1. Berry MP, et al. An interferon-inducible neutrophil-driven blood transcriptional signature in human tuberculosis. Nature. 2010;466:973–977. - PMC - PubMed
    1. Blankley S, Berry MP, Graham CM, Bloom CI, Lipman M, O'Garra A. The application of transcriptional blood signatures to enhance our understanding of the host response to infection: the example of tuberculosis. Philos Trans R Soc Lond B Biol Sci. 2014;369:20130427. - PMC - PubMed