

Pathological glycogenesis through glycogen synthase 1 and suppression of excessive AMP kinase activity in myeloid leukemia cells
- PMID: 25703587
- PMCID: PMC4497855
- DOI: 10.1038/leu.2015.46
Pathological glycogenesis through glycogen synthase 1 and suppression of excessive AMP kinase activity in myeloid leukemia cells
Abstract
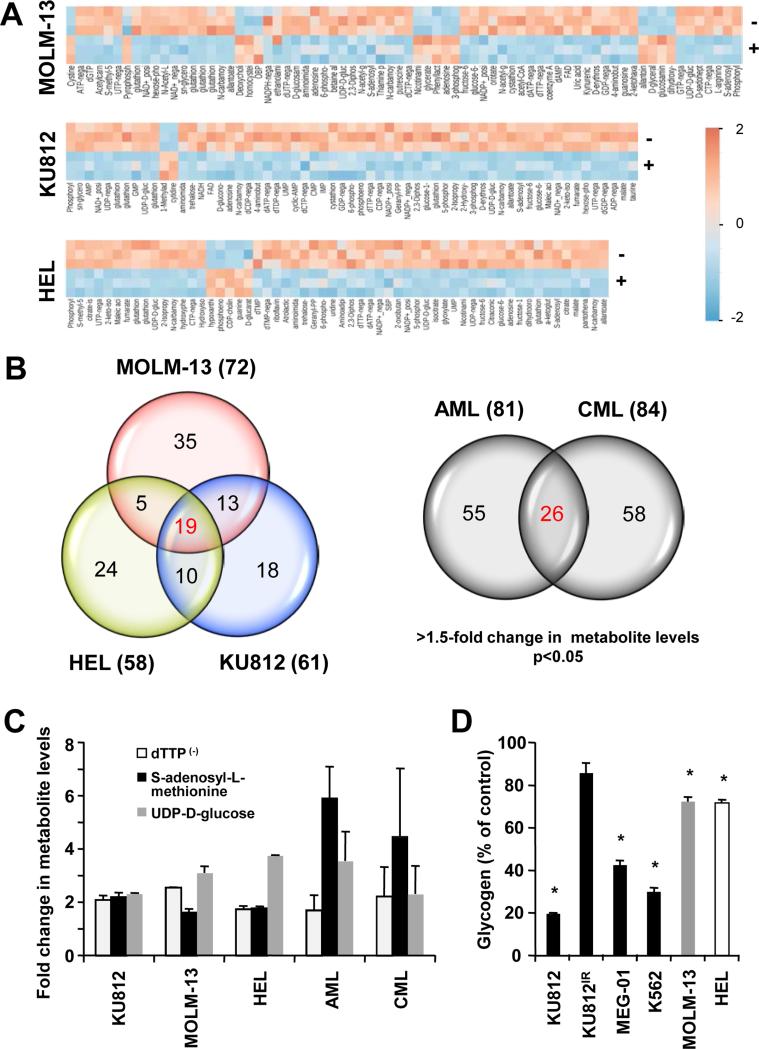
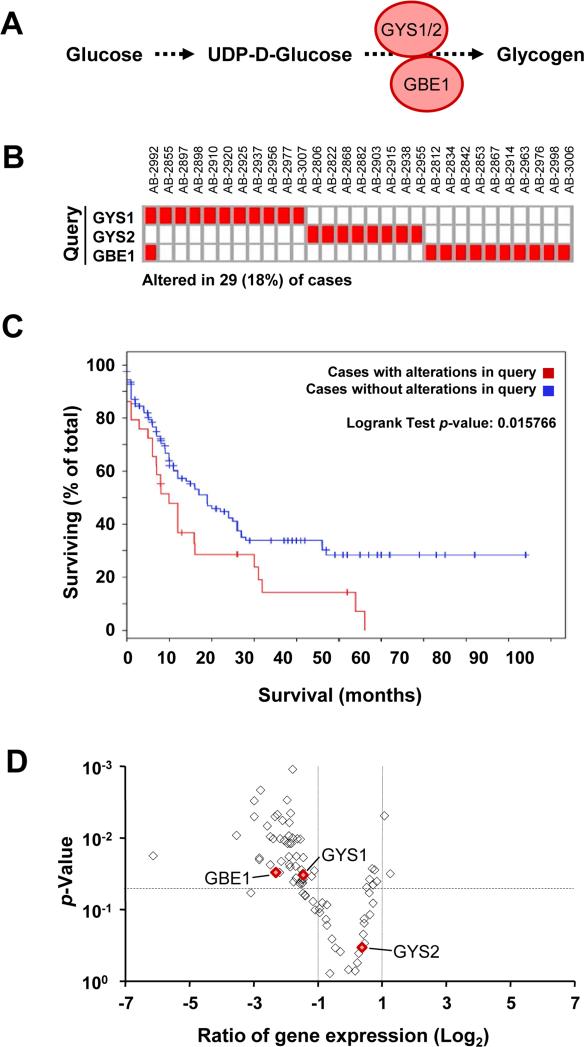
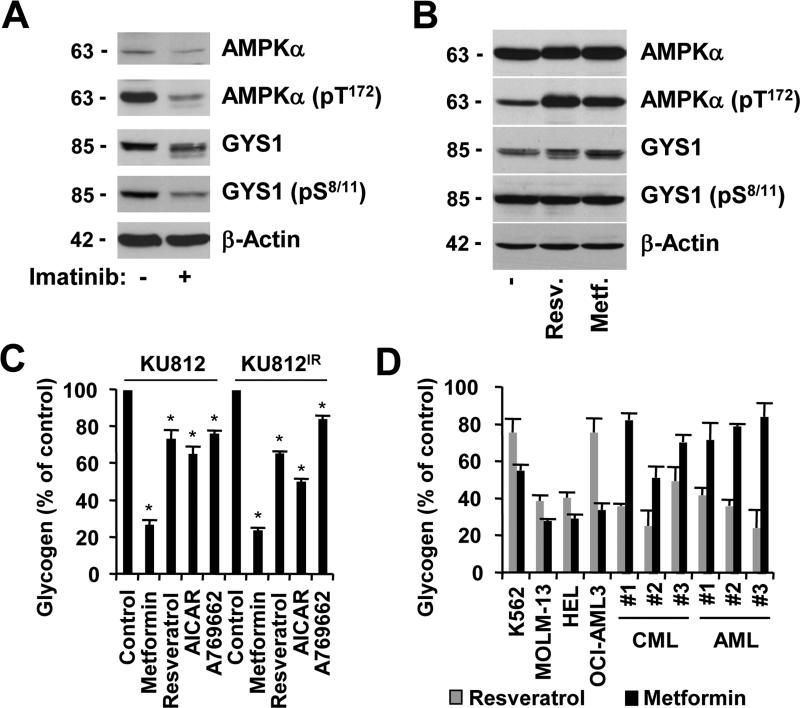
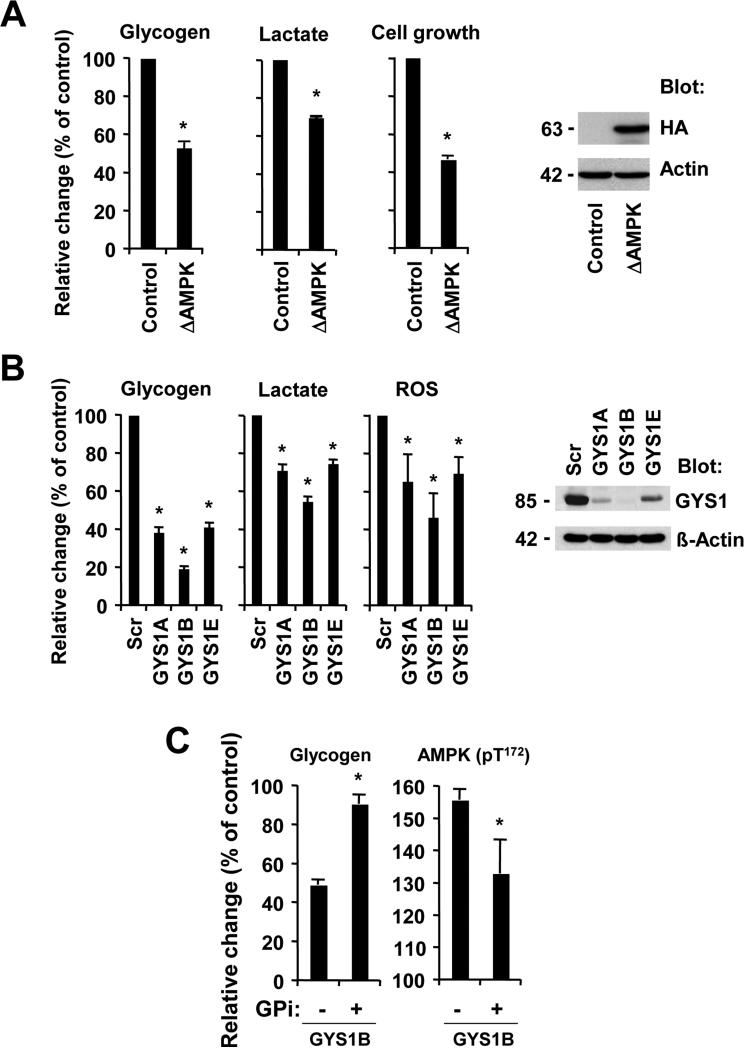
The rapid proliferation of myeloid leukemia cells is highly dependent on increased glucose metabolism. Through an unbiased metabolomics analysis of leukemia cells, we found that the glycogenic precursor UDP-D-glucose is pervasively upregulated, despite low glycogen levels. Targeting the rate-limiting glycogen synthase 1 (GYS1) not only decreased glycolytic flux but also increased activation of the glycogen-responsive AMP kinase (AMPK), leading to significant growth suppression. Further, genetic and pharmacological hyper-activation of AMPK was sufficient to induce the changes observed with GYS1 targeting. Cancer genomics data also indicate that elevated levels of the glycogenic enzymes GYS1/2 or GBE1 (glycogen branching enzyme 1) are associated with poor survival in AML. These results suggest a novel mechanism whereby leukemic cells sustain aberrant proliferation by suppressing excess AMPK activity through elevated glycogenic flux and provide a therapeutic entry point for targeting leukemia cell metabolism.
Figures

Similar articles
-
Glycogen synthase 1 targeting reveals a metabolic vulnerability in triple-negative breast cancer.J Exp Clin Cancer Res. 2023 Jun 6;42(1):143. doi: 10.1186/s13046-023-02715-z. J Exp Clin Cancer Res. 2023. PMID: 37280675 Free PMC article.
-
Polyglucosan neurotoxicity caused by glycogen branching enzyme deficiency can be reversed by inhibition of glycogen synthase.J Neurochem. 2013 Oct;127(1):101-13. doi: 10.1111/jnc.12277. Epub 2013 May 9. J Neurochem. 2013. PMID: 23607684
-
Effect of acute activation of 5'-AMP-activated protein kinase on glycogen regulation in isolated rat skeletal muscle.J Appl Physiol (1985). 2007 Mar;102(3):1007-13. doi: 10.1152/japplphysiol.01034.2006. Epub 2006 Nov 22. J Appl Physiol (1985). 2007. PMID: 17122373
-
AMP-activated protein kinase--a sensor of glycogen as well as AMP and ATP?Acta Physiol (Oxf). 2009 May;196(1):99-113. doi: 10.1111/j.1748-1716.2009.01975.x. Epub 2009 Feb 19. Acta Physiol (Oxf). 2009. PMID: 19245651 Review.
-
How does insulin stimulate glycogen synthesis?Biochem Soc Symp. 1978;(43):69-95. Biochem Soc Symp. 1978. PMID: 219866 Review.
Cited by
-
Aurora Kinase B Expression, Its Regulation and Therapeutic Targeting in Human Retinoblastoma.Invest Ophthalmol Vis Sci. 2021 Mar 1;62(3):16. doi: 10.1167/iovs.62.3.16. Invest Ophthalmol Vis Sci. 2021. PMID: 33704359 Free PMC article.
-
Absence of HIF1A Leads to Glycogen Accumulation and an Inflammatory Response That Enables Pancreatic Tumor Growth.Cancer Res. 2019 Nov 15;79(22):5839-5848. doi: 10.1158/0008-5472.CAN-18-2994. Epub 2019 Oct 4. Cancer Res. 2019. PMID: 31585939 Free PMC article.
-
Mitochondrial Effects on Seeds of Cancer Survival in Leukemia.Front Oncol. 2021 Oct 7;11:745924. doi: 10.3389/fonc.2021.745924. eCollection 2021. Front Oncol. 2021. PMID: 34692527 Free PMC article. Review.
-
Glycogen synthase 1 targeting reveals a metabolic vulnerability in triple-negative breast cancer.J Exp Clin Cancer Res. 2023 Jun 6;42(1):143. doi: 10.1186/s13046-023-02715-z. J Exp Clin Cancer Res. 2023. PMID: 37280675 Free PMC article.
-
Overexpression of pyruvate dehydrogenase kinase 1 in retinoblastoma: A potential therapeutic opportunity for targeting vitreous seeds and hypoxic regions.PLoS One. 2017 May 15;12(5):e0177744. doi: 10.1371/journal.pone.0177744. eCollection 2017. PLoS One. 2017. PMID: 28505181 Free PMC article.
References
-
- Dohner H, Estey EH, Amadori S, Appelbaum FR, Buchner T, Burnett AK, et al. Diagnosis and management of acute myeloid leukemia in adults: recommendations from an international expert panel, on behalf of the European LeukemiaNet. Blood. 2010;115:453–474. - PubMed
-
- Hehlmann R, Muller MC, Lauseker M, Hanfstein B, Fabarius A, Schreiber A, et al. Deep molecular response is reached by the majority of patients treated with imatinib, predicts survival, and is achieved more quickly by optimized high-dose imatinib: results from the randomized CML-study IV. J Clin Oncol. 2014;32:415–423. - PubMed
-
- Lunt SY, Vander Heiden MG. Aerobic glycolysis: meeting the metabolic requirements of cell proliferation. Annu Rev Cell Dev Biol. 2011;27:441–464. - PubMed
-
- Schulze A, Harris AL. How cancer metabolism is tuned for proliferation and vulnerable to disruption. Nature. 2012;491:364–373. - PubMed
-
- Warburg O. On respiratory impairment in cancer cells. Science. 1956;124:269–270. - PubMed
Publication types
MeSH terms
Substances
Grants and funding
LinkOut - more resources
Full Text Sources
Other Literature Sources
