. 2015 Feb 23:5:8397.
doi: 10.1038/srep08397.

Diversity in gut bacterial community of school-age children in Asia

Affiliations

Diversity in gut bacterial community of school-age children in Asia

Jiro Nakayama et al. Sci Rep. .

Erratum in

  • Author Correction: Diversity in gut bacterial community of school-age children in Asia.
    Nakayama J, Watanabe K, Jiang J, Matsuda K, Chao SH, Haryono P, La-Ongkham O, Sarwoko MA, Sujaya IN, Zhao L, Chen KT, Chen YP, Chiu HH, Hidaka T, Huang NX, Kiyohara C, Kurakawa T, Sakamoto N, Sonomoto K, Tashiro K, Tsuji H, Chen MJ, Leelavatcharamas V, Liao CC, Nitisinprasert S, Rahayu ES, Ren FZ, Tsai YC, Lee YK. Nakayama J, et al. Sci Rep. 2019 Apr 25;9(1):6530. doi: 10.1038/s41598-019-42780-z. Sci Rep. 2019. PMID: 31024062 Free PMC article.

Abstract

Asia differs substantially among and within its regions populated by diverse ethnic groups, which maintain their own respective cultures and dietary habits. To address the diversity in their gut microbiota, we characterized the bacterial community in fecal samples obtained from 303 school-age children living in urban or rural regions in five countries spanning temperate and tropical areas of Asia. The microbiota profiled for the 303 subjects were classified into two enterotype-like clusters, each driven by Prevotella (P-type) or Bifidobacterium/Bacteroides (BB-type), respectively. Majority in China, Japan and Taiwan harbored BB-type, whereas those from Indonesia and Khon Kaen in Thailand mainly harbored P-type. The P-type microbiota was characterized by a more conserved bacterial community sharing a greater number of type-specific phylotypes. Predictive metagenomics suggests higher and lower activity of carbohydrate digestion and bile acid biosynthesis, respectively, in P-type subjects, reflecting their high intake of diets rich in resistant starch. Random-forest analysis classified their fecal species community as mirroring location of resident country, suggesting eco-geographical factors shaping gut microbiota. In particular, children living in Japan harbored a less diversified microbiota with high abundance of Bifidobacterium and less number of potentially pathogenic bacteria, which may reflect their living environment and unique diet.


Figures

Figure 1
Figure 1. Composition and count of fecal bacteria of the Asian children living in the ten cities.
(a) Family-level bacterial composition determined by performing 454-pyrotag sequencing of 16S rRNA genes. Each pie chart represents the mean compositions of the subjects from each city. (b) Cell counts of the Bacteroides fragilis group, the genus Bifidobacterium, and the genus Prevotella were determined using qPCR. For each city, the box plots show the smallest and largest values, 25% and 75% quartiles, the median, and outliers.
Figure 2
Figure 2. PCA and clustering of samples of 303 Asian children by using species-level composition data.
(a) We performed PCA by using the relative abundance data of all bacterial families; in this figure, we have plotted the results according to the PC1 and PC2 scores, with specific colors being used to indicate places of residence. The five largest loadings of bacterial families are indicated by arrows together with their family names. (b) Distribution of the five dominant bacterial families in the 303 Asian children. The bacterial-composition data of the 303 samples were sorted according to the PC1 score (left) and PC2 score (right). In the graphs, the variance between participants from each city is shown in a boxplot. Refer to Fig. 1b for definition of box plot. (c) Clustering of the 303 Asian participants based on family composition data. The 303 samples were clustered using the JSD and PAM clustering. The optimal number of clusters was chosen by maximizing the Calinski–Harabasz index and this was validated based on the prediction strength (PS) and average silhouette width (SW). The clustering is displayed in the PCA plot. The center of gravity of each cluster is indicated by a rectangle filled with the name of microbiota type. The colored ellipse covers 67% of the samples belonging to a cluster. (d) The ratio of the P- and BB-type children in each city.
Figure 3
Figure 3. Genus composition of BB- and P-type bacterial communities.
(a) Pie charts represent mean relative ratio of the genera in BB- (upper) and P- (lower) type samples, respectively. (b) The box plots represent the relative abundance of the genera enriched in either the BB- (upper) or P- (lower) type. Genera showing the five lowest P values (<10-9) in the Mann-Whitney U-test are displayed, respectively. Refer to Fig. 1b for definition of box plot.
Figure 4
Figure 4. Comparison of alpha- and beta-diversities between BB- and P-type bacterial communities.
(a) Rarefaction curve of the number of OTUs observed in subjects for each type. The number of OTUs was determined in each participant at each sampling depth in 100-read increment. The means and standard deviation of the P-type group (n = 88) and the BB-type group (n = 215) are shown in the rarefaction plot. The number of phylotypes shared more than 50% within or across subjects in each group is represented in the inset Venn diagram. (b) Inter-individual similarity of fecal phylotype community between 303 subjects. Pairwise inter-individual similarity was calculated using the Morisita-Horn index and is represented by the heat map and boxplot. Each cell in the heat map, ordered according to BB- and P-type groups, represents the similarity level according to the color scale beside the box plot. Refer to Fig. 1b for definition of box plot.
Figure 5
Figure 5. Random forest clustering of 303 Asian children using species composition data.
(a) Multidimensional plot of the proximity matrix calculated using random forest analysis of the phylotype composition data of the 303 children. Relative-abundance data of all species in the children were subjected to random forest analysis to perform the machine-learning clustering to identify the country of origin of the samples. The ensemble included 5,000 trees. The calculated proximity matrices are plotted together with the corresponding city colors. (b) Heat map representation of species-level bacterial composition of the microbiota of the 303 Asian children. Top 30 species with the highest Gini score in the random forest analysis performed in (a) were chosen to create the heat map with dendrogram showing the clustering of the species. The relative abundances of these species in each participant were converted to log10 values and subjected to Pearson correlation analysis followed by hierarchical clustering using complete linkage. The population densities of species are scaled by color.
Figure 6
Figure 6. Comparison of fecal microbiota among children in the ten cities.
(a) Alpha-diversities of fecal bacterial community in individual samples in each city. Individual phylotype-composition data were rarified using 2,000 reads per participant in two iterations. The number of observed OTUs, PD_whole_tree, and Shannon Wiener index were calculated for each rarified OTU composition and averaged within the two iterations. The covariance of these calculated indices was computed for each country and is graphed as a box plot. (b) The inter-individual similarity indices presented in Fig. 4c were averaged in each block of city pairs and are displayed according to the indicated color scale. (c) Cell numbers of family Enterobacteriaceae determined by RT-qPCR. Refer to Fig. 1b for definition of box plot. Red symbols of “>”, “≫”, and “≫>” indicate significantly higher (P < 0.05) than other 2, 4, and 6 cities, respectively, in pairwise Wilcox test; Blue symbols of “<”, “≪”, and“≪≪” indicate significantly lower (P < 0.05) than other 2, 4, and 8 cities, respectively, in the pairwise Wilcoxon rank sum test with Bonferroni correction.
Figure 7
Figure 7. Predictive KEGG functions associated with stool bacterial community structure.
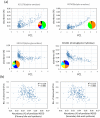
(a) Correlation between the abundance of predicted KEGG enzymes and the PC1 score of PCA calculated using the family-level bacterial compositions (see Fig. 2a). Inset pie charts represent the contribution of each bacteria family to this enzyme in our dataset (Refer to Fig. 1a for the color code of bacteria family). (b) Correlation between the abundance of the predicted primary or secondary bile acid synthesis pathway and the number of observed species.

References

    1. Kinross J. M., Darzi A. W. & Nicholson J. K. Gut microbiome-host interactions in health and disease. Genome Med 3, 14 (2011). - PMC - PubMed
    1. Qin J. et al. A metagenome-wide association study of gut microbiota in type 2 diabetes. Nature 490, 55–60 (2012). - PubMed
    1. Arumugam M. et al. Enterotypes of the human gut microbiome. Nature 473 (7346), 174–180 (2011). - PMC - PubMed
    1. Huse S. M., Ye Y., Zhou Y. & Fodor A. A. A core human microbiome as viewed through 16S rRNA sequence clusters. PLoS One 7, e34242 (2012). - PMC - PubMed
    1. Claesson M. J. et al. Gut microbiota composition correlates with diet and health in the elderly. Nature 488, 178–184 (2012). - PubMed

Publication types

MeSH terms

LinkOut - more resources