

Resolution of mixed site DNA complexes with dimer-forming minor-groove binders by using electrospray ionization mass spectrometry: compound structure and DNA sequence effects
- PMID: 25703690
- PMCID: PMC4732565
- DOI: 10.1002/chem.201406322
Resolution of mixed site DNA complexes with dimer-forming minor-groove binders by using electrospray ionization mass spectrometry: compound structure and DNA sequence effects
Abstract
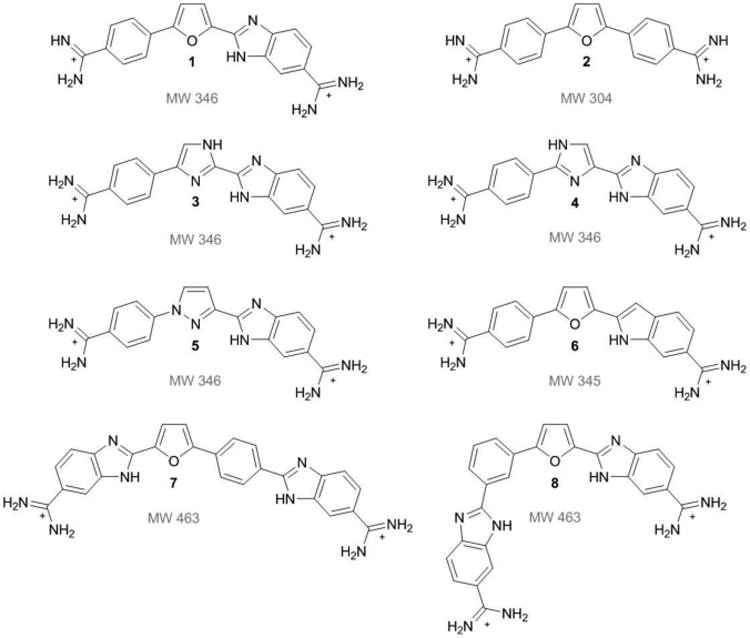
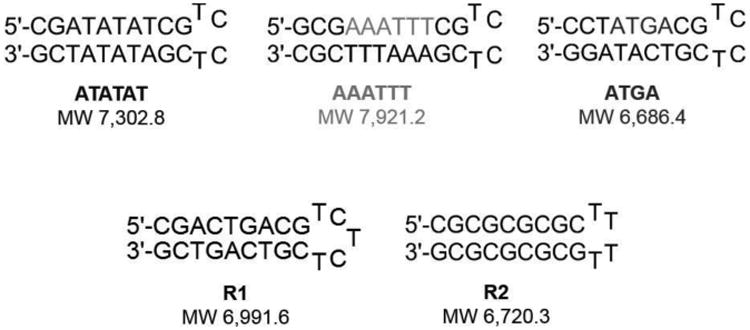
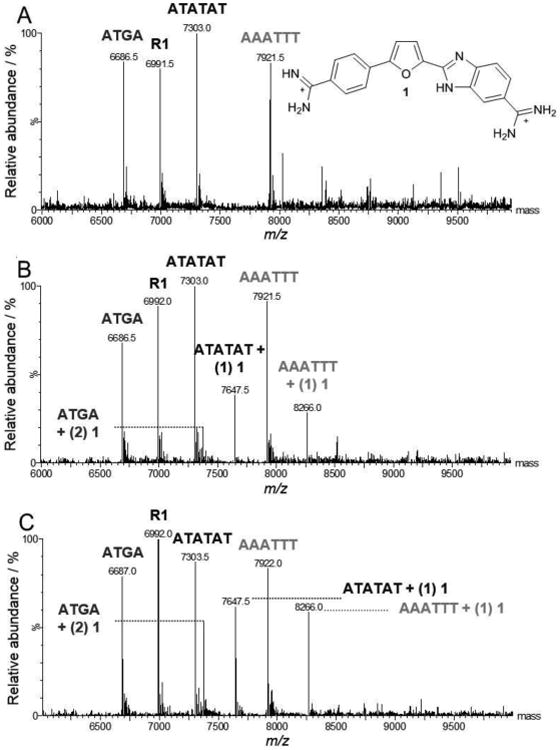
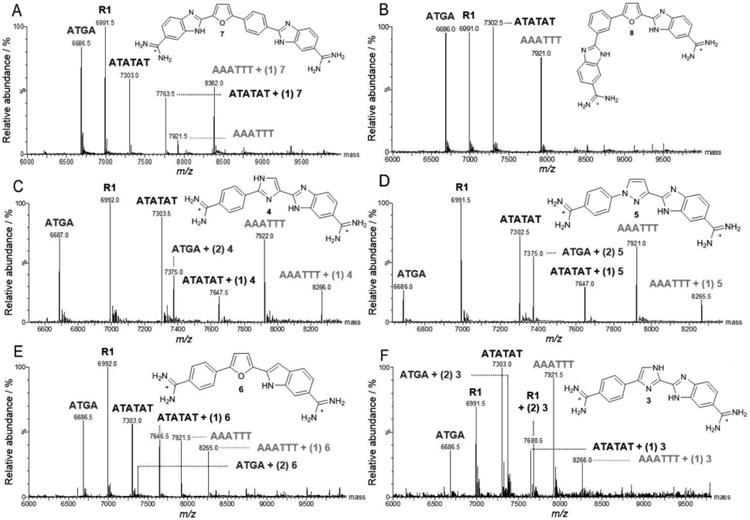
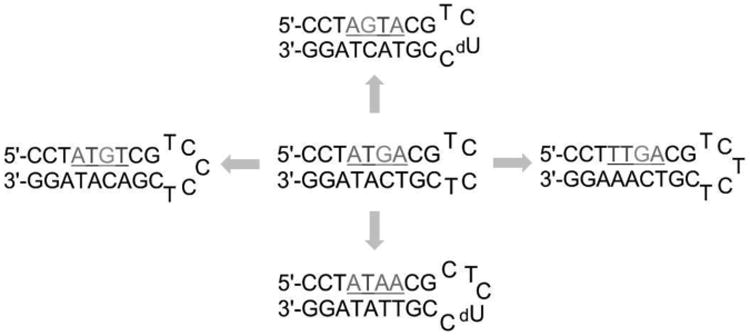
Small-molecule targeting of the DNA minor groove is a promising approach to modulate genomic processes necessary for normal cellular function. For instance, dicationic diamindines, a well-known class of minor groove binding compounds, have been shown to inhibit interactions of transcription factors binding to genomic DNA. The applications of these compounds could be significantly expanded if we understand sequence-specific recognition of DNA better and could use the information to design more sequence-specific compounds. Aside from polyamides, minor groove binders typically recognize DNA at A-tract or alternating AT base pair sites. Targeting sites with GC base pairs, referred to here as mixed base pair sequences, is much more difficult than those rich in AT base pairs. Compound 1 is the first dicationic diamidine reported to recognize a mixed base pair site. It binds in the minor groove of ATGA sequences as a dimer with positive cooperativity. Due to the well-characterized behavior of 1 with ATGA and AT rich sequences, it provides a paradigm for understanding the elements that are key for recognition of mixed sequence sites. Electrospray ionization mass spectrometry (ESI-MS) is a powerful method to screen DNA complexes formed by analogues of 1 for specific recognition. We also report a novel approach to determine patterns of recognition by 1 for cognate ATGA and ATGA-mutant sequences. We found that functional group modifications and mutating the DNA target site significantly affect binding and stacking, respectively. Both compound conformation and DNA sequence directionality are crucial for recognition.
Keywords: DNA recognition; dimerization; mass spectrometry; minor groove binder; mixed DNA sequence.
© 2015 WILEY-VCH Verlag GmbH & Co. KGaA, Weinheim.
Figures
Similar articles
-
Recognition of ATGA sequences by the unfused aromatic dication DB293 forming stacked dimers in the DNA minor groove.Biochemistry. 2001 Aug 21;40(33):9770-9. doi: 10.1021/bi0108453. Biochemistry. 2001. PMID: 11502170
-
A novel approach using electrospray ionization mass spectrometry to study competitive binding of small molecules with mixed DNA sequences.Anal Bioanal Chem. 2014 Oct;406(25):6441-5. doi: 10.1007/s00216-014-8044-9. Epub 2014 Jul 30. Anal Bioanal Chem. 2014. PMID: 25074546 Free PMC article.
-
Alternative Approach to Sequence-Specific Recognition of DNA: Cooperative Stacking of Dication Dimers─Sensitivity to Compound Curvature, Aromatic Structure, and DNA Sequence.ACS Chem Biol. 2025 Feb 21;20(2):489-506. doi: 10.1021/acschembio.4c00800. Epub 2025 Feb 7. ACS Chem Biol. 2025. PMID: 39920086 Free PMC article.
-
Binding to the DNA Minor Groove by Heterocyclic Dications: from AT Specific to GC Recognition Compounds.Curr Protoc. 2023 Apr;3(4):e729. doi: 10.1002/cpz1.729. Curr Protoc. 2023. PMID: 37071034 Review.
-
Binding to the DNA minor groove by heterocyclic dications: from AT-specific monomers to GC recognition with dimers.Curr Protoc Nucleic Acid Chem. 2012 Dec;Chapter 8:Unit8.8. doi: 10.1002/0471142700.nc0808s51. Curr Protoc Nucleic Acid Chem. 2012. PMID: 23255206 Free PMC article. Review.
Cited by
-
Thermodynamic Factors That Drive Sequence-Specific DNA Binding of Designed, Synthetic Minor Groove Binding Agents.Life (Basel). 2022 May 4;12(5):681. doi: 10.3390/life12050681. Life (Basel). 2022. PMID: 35629349 Free PMC article.
-
DNA microstructure influences selective binding of small molecules designed to target mixed-site DNA sequences.Nucleic Acids Res. 2017 Feb 17;45(3):1297-1306. doi: 10.1093/nar/gkw1232. Nucleic Acids Res. 2017. PMID: 28180310 Free PMC article.
-
Small Molecules Incorporating Privileged Amidine Moiety as Potential Hits Combating Antibiotic-Resistant Bacteria.Pharmaceuticals (Basel). 2023 Jul 22;16(7):1040. doi: 10.3390/ph16071040. Pharmaceuticals (Basel). 2023. PMID: 37513951 Free PMC article.
-
May the Best Molecule Win: Competition ESI Mass Spectrometry.Int J Mol Sci. 2015 Oct 15;16(10):24506-31. doi: 10.3390/ijms161024506. Int J Mol Sci. 2015. PMID: 26501262 Free PMC article. Review.
-
Mixed up minor groove binders: Convincing A·T specific compounds to recognize a G·C base pair.Bioorg Med Chem Lett. 2015 Nov 1;25(21):4927-4932. doi: 10.1016/j.bmcl.2015.05.005. Epub 2015 May 19. Bioorg Med Chem Lett. 2015. PMID: 26051649 Free PMC article.
References
-
- Peixoto P, Liu Y, Depauw S, Hildebrand MP, Boykin DW, Bailly C, Wilson WD, David-Cordonnier MH. Nucleic Acids Res. 2008;36:3341–3353. - PMC - PubMed
- Mapp AK, Ansari AZ, Ptashne M, Dervan PB. Proc Natl Acad Sci USA. 2000;97:3930–3935. - PMC - PubMed
- Dervan PB, Burli RW. Curr Opin Chem Biol. 1999;3:688–693. - PubMed
- Munde M, Poon GMK, Wilson WD. J Mol Biol. 2013;425:1655–1669. - PMC - PubMed
Publication types
MeSH terms
Substances
Grants and funding
LinkOut - more resources
Full Text Sources
Other Literature Sources
Miscellaneous
