. 2015 Jun:113:356-64.
doi: 10.1016/j.neuroimage.2015.02.026. Epub 2015 Feb 19.

Functional subdivision of the human periaqueductal grey in respiratory control using 7 tesla fMRI

Affiliations

Functional subdivision of the human periaqueductal grey in respiratory control using 7 tesla fMRI

Olivia K Faull et al. Neuroimage. 2015 Jun.

Abstract

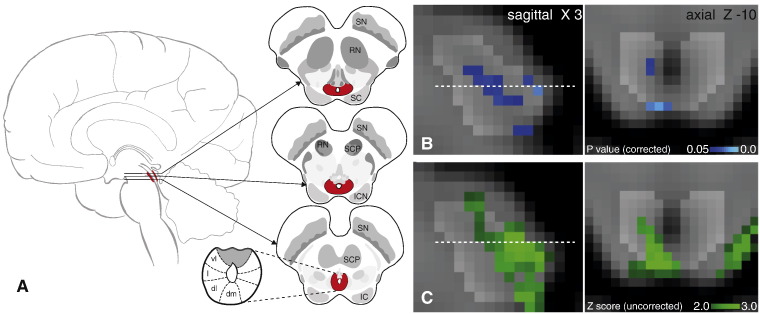
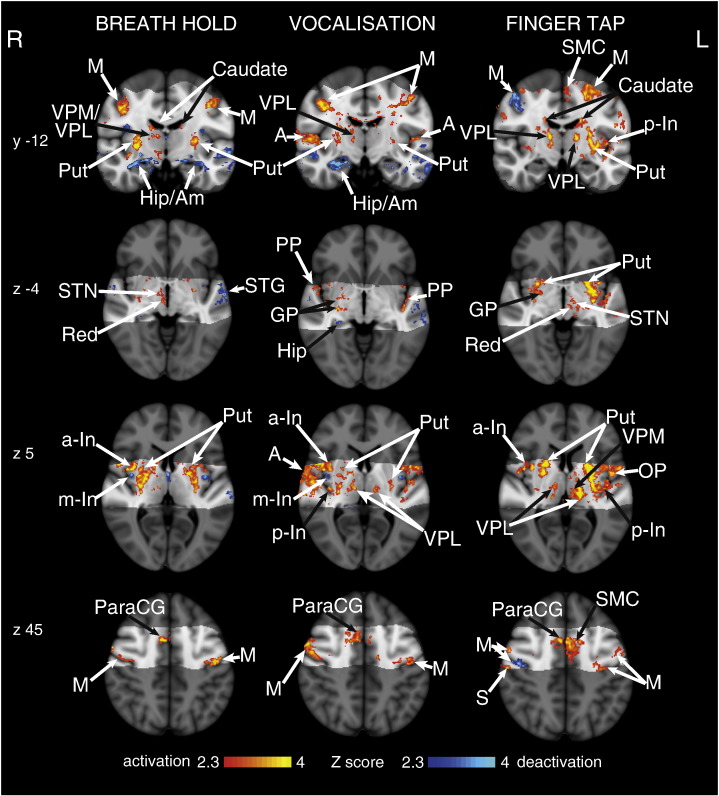
The periaqueductal grey (PAG) is a nucleus within the midbrain, and evidence from animal models has identified its role in many homeostatic systems including respiration. Animal models have also demonstrated a columnar structure that subdivides the PAG into four columns on each side, and these subdivisions have different functions with regard to respiration. In this study we used ultra-high field functional MRI (7 T) to image the brainstem and superior cortical areas at high resolution (1mm(3)voxels), aiming to identify activation within the columns of the PAG associated with respiratory control. Our results showed deactivation in the lateral and dorsomedial columns of the PAG corresponding with short (~10s) breath holds, along with cortical activations consistent with previous respiratory imaging studies. These results demonstrate the involvement of the lateral and dorsomedial PAG in the network of conscious respiratory control for the first time in humans. This study also reveals the opportunities of 7 T functional MRI for non-invasively investigating human brainstem nuclei at high-resolutions.

Keywords: Brainstem; Periaqueductal grey; Respiration; fMRI.


Figures

Fig. 1
Fig. 1
a) Schematic diagram of the venturi mask used in the breathing system. A: Loose plastic venturi mask B: Venturi entrainment device (1:1). b) A section of a respiratory trace from one subject demonstrating the tidal CO2 trace (top) and the tidal volume trace from the bellows (bottom). The end-tidal CO2 (PETCO2) trace was formed by interpolating between the end expiration peaks (dotted line, top trace). The breath hold duration was calculated from the time between the end of expiration CO2 trace and the beginning of the subsequent expiration trace, to minimise inclusion of head movement. The vocalisation duration was calculated from the duration between the beginning and end of a vocalisation expiration trace.
Fig. 2
Fig. 2
Example four minutes of the BOLD sequence, repeated throughout the acquisition. The order of the breath holds and vocalisations was semi-randomised between the finger opposition and CO2 stimuli.
Fig. 3
Fig. 3
Periaqueductal grey (PAG) response to breath hold. A. Representation of the location of the PAG within the brain, three sagittal slices and the current opinion of the subdivisions of the PAG. B. Localisation of the functional decreases in BOLD signal within the PAG (p < 0.05; small-volume-corrected for multiple comparisons using overlaid PAG mask), where the images consist of a colour-rendered statistical map superimposed on a standard (MNI 1 mm3) brain. Dashed line represents Z-10 location. C. Uncorrected Z score image of PAG deactivation from whole brain analysis, prior to masking. Abbreviations: SN, substantia nigra; RN, red nucleus; SC, superior colliculus; SCP, superior cerebellar peduncle; ICN, inter-colliculi nucleus; IC, inferior colliculus; vl, ventrolateral PAG, l, lateral PAG; dl, dorsolateral PAG; dm, dorsomedial PAG.
Fig. 4
Fig. 4
BOLD response to breath holds, vocalisations and finger opposition in 15 subjects, having accounted for CO2-induced vasodilation. The images consist of a colour-rendered statistical map superimposed on a standard (MNI 1 mm3) brain. The bright grey region represents the coverage of the coronal-oblique functional scan. Significant regions are displayed with a threshold Z > 2.3, with a cluster probability threshold of p < 0.05 (corrected for multiple comparisons). Abbreviations: M, motor cortex; Caudate, caudate nucleus; SMC, supplementary motor cortex; Put, putamen; A, auditory cortex; Hip, hippocampus; Am, amygdala; thalamic nuclei: VPM, ventral posteromedial nucleus; VPL, ventral posterolateral nucleus; MDN, medial dorsal nuclei; a-In, anterior insula; m-In, middle insula; p-In, posterior insula; PP, planum polare; STN, subthalamic nucleus; Red, Red nucleus; STG, superior temporal gyrus; GP, globus pallidus; OP, operculum; S, post central gyrus (sensory cortex); paraCG, paracingulate gyrus; activation, increase in BOLD signal; deactivation, decrease in BOLD signal. R (right) and L (left) indicate image orientation.
Fig. 5
Fig. 5
Demonstration of the use of finger opposition as a functional localiser in brainstem fMRI at 3 T and at 7 T, by imaging activation in the ipsilateral cuneate nucleus of the medulla (z -54). The 3 T data is derived from previously-published results (Pattinson et al., 2009a). This technique provides confidence in the analysis model and registration accuracy of the current 7 T study. The images consist of a colour-rendered statistical map superimposed on a standard (MNI 1 mm3) brain. Significant regions are displayed with a threshold Z > 2.3, with a cluster probability threshold of p < 0.05 (corrected for multiple comparisons). The sagittal image on the right displays the position of slices, for clarity only displayed from the 7 T acquisition. Abbreviations: R, raphe nuclei; ret, nuclei reticularis; VII, facial nucleus; Amb, nucleus ambiguous; IX, glossopharyngeal nucleus; NTS, nucleus tractus solitaries; GC, gracile (medial) and cuneate (lateral) nuclei (in blue). R (right) and L (left) indicate image orientation. Original line drawings adapted from Duvernoy (1995).

References

    1. Andersson J.L., Jenkinson M., Smith S. FMRIB Analysis Group of the University of Oxford; 2007. Non-linear Registration, aka SPATIAL Normalisation FMRIB Technical Report TR07JA2.
    1. Arthurs O.J., Boniface S. How well do we understand the neural origins of the fMRI BOLD signal? Trends Neurosci. 2002;25(1):27–31. - PubMed
    1. Bandler R., Shipley M.T. Columnar organisation in the midbrain periaqueductal gray: modules for emotional expression? Trends Neurosci. 1994;17(9):379–389. - PubMed
    1. Brooks J.C.W., Beckmann C.F., Miller K.L., Wise R.G., Porro C.A., Tracey I., Jenkinson M. Physiological noise modelling for spinal functional magnetic resonance imaging studies. Neuroimage. 2008;39(2):680–692. - PubMed
    1. Brooks J.C.W., Faull O.K., Pattinson K.T.S., Jenkinson M. Physiological noise in brainstem fMRI. Front. Hum. Neurosci. 2013;7:1–13. - PMC - PubMed

Publication types

MeSH terms