. 2015 Mar 5;16(3):302-13.
doi: 10.1016/j.stem.2015.01.017. Epub 2015 Feb 19.

CDK6 levels regulate quiescence exit in human hematopoietic stem cells

Affiliations

CDK6 levels regulate quiescence exit in human hematopoietic stem cells

Elisa Laurenti et al. Cell Stem Cell. .

Abstract

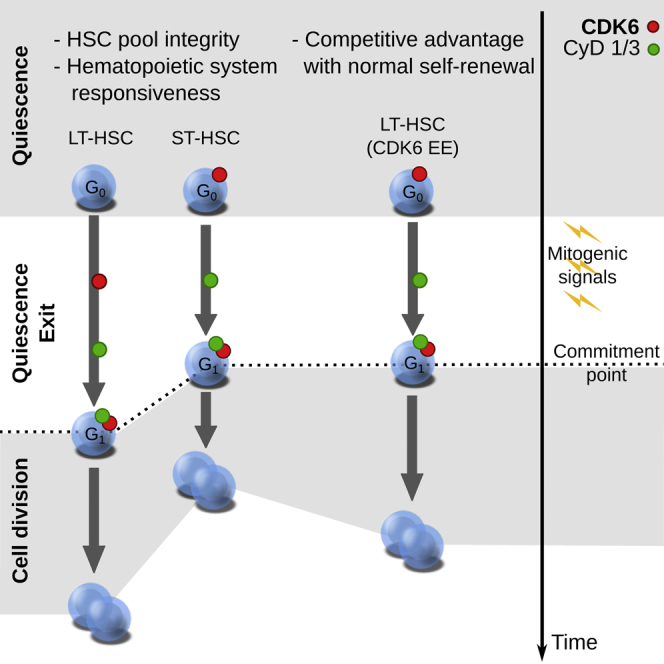
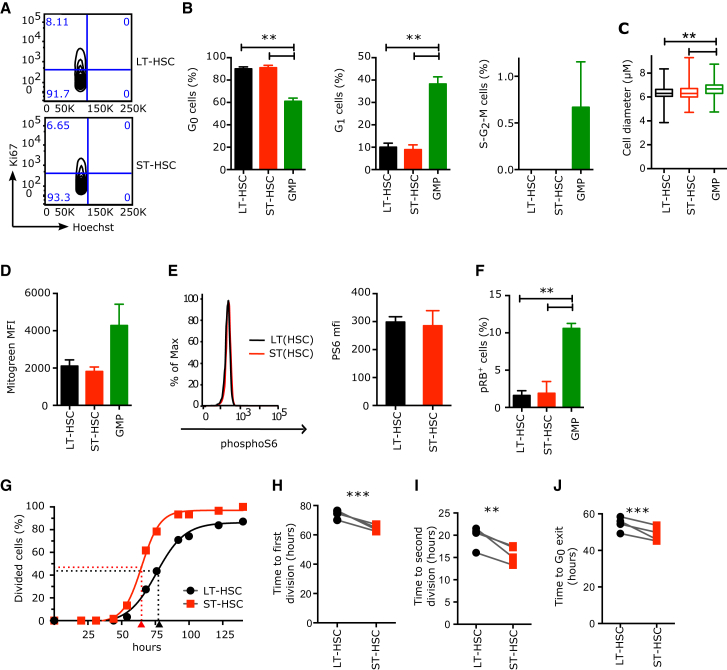
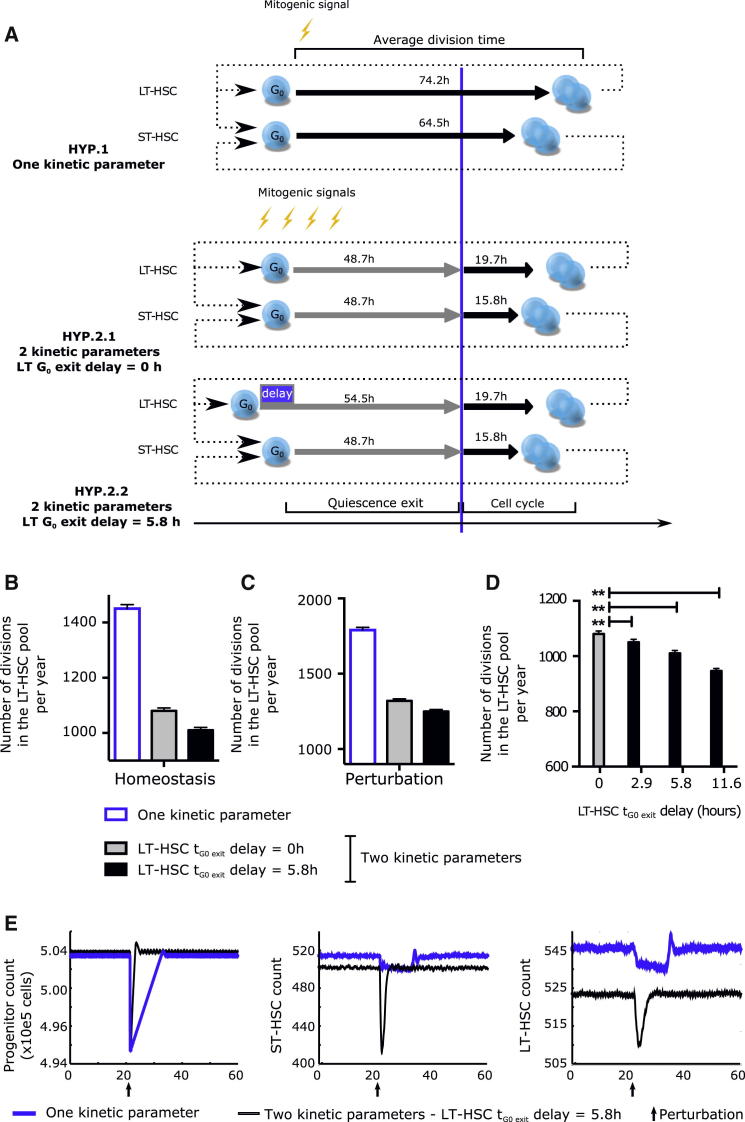
Regulated blood production is achieved through the hierarchical organization of dormant hematopoietic stem cell (HSC) subsets that differ in self-renewal potential and division frequency, with long-term (LT)-HSCs dividing the least. The molecular mechanisms underlying this variability in HSC division kinetics are unknown. We report here that quiescence exit kinetics are differentially regulated within human HSC subsets through the expression level of CDK6. LT-HSCs lack CDK6 protein. Short-term (ST)-HSCs are also quiescent but contain high CDK6 protein levels that permit rapid cell cycle entry upon mitogenic stimulation. Enforced CDK6 expression in LT-HSCs shortens quiescence exit and confers competitive advantage without impacting function. Computational modeling suggests that this independent control of quiescence exit kinetics inherently limits LT-HSC divisions and preserves the HSC pool to ensure lifelong hematopoiesis. Thus, differential expression of CDK6 underlies heterogeneity in stem cell quiescence states that functionally regulates this highly regenerative system.


Figures

None
Graphical abstract
Figure 1
Figure 1
Human HSC Subsets in the Xenograft Divide with Distinct Frequencies and Display Distinct Transcriptional Profiles (A) Number of cells per mouse of indicated populations in the bone marrow of the mice at indicated time points post-transplantation of 70,000 Lin CB (saturating number of LT-HSCs). Median and interquantile ranges are shown. ∗∗∗p < 0.01 by one-way ANOVA and Tukey test. (B) The number of repopulating LT-HSCs per mouse at indicated time points post-transplantation were calculated by multiplying the number of phenotypic LT-HSCs shown in (A) by the frequency of long-term repopulating cells indicated in Table S1. (C) BrdU incorporation kinetics over 12 days of LT-HSC (black) and ST-HSC (red) enriched populations isolated from pools of two to five mice engrafted with 70,000 Lin CB cells. BrdU was started either at 4 (left panel, expanding phase) or 20 weeks post-transplantation (right panel, equilibrium phase). n = 1–4 pools of three to five mice from six (4 weeks) or one (20 weeks) independent CB samples. Curve is least-squares fit. Left panel: R2 > 0.96; right panel: R2 > 0.98. Doubling times (half times of fit) in hours are shown in the insert. ∗∗∗p < 0.01 by extra-sum of squares test. (D and E) Derivation of a 241-gene signature distinguishing LT- and ST-HSCs in unperturbed CB over 20 weeks in a xenotransplant. (D) Examples of five expression profiles of genes with known HSC function over the course of 20 weeks of xenotransplant (black: LT-HSCs, red: ST-HSCs), mean ± S.E.M shown, n = 3 per time point. (E) Selected gene ontology terms significantly enriched in the 241-gene LT-HSC/ST-HSC core signature. Shown is the −log10 of the Benjamini-Hochberg adjusted p value. See also Figure S1.
Figure 2
Figure 2
LT- and ST-HSCs Are Equally Quiescent, but upon Mitogenic Stimulation They Differ in the Duration of Divisions Starting from G0 or G1 (A and B) Proportion of human CB HSC and progenitor cells in each phase of the cell cycle. Parameters were assessed by flow cytometry using Ki67 and Hoechst (Ki67 2n DNA content, G0; Ki67+ 2n DNA content, G1; Ki67+ > 2n DNA content, S-G2-M). (A) Representative flow cytometry cell cycle profiles of CB LT- and ST-HSCs and the percentage of cells in each gate. Event count: LT-HSCs (top panel), 1,320 cells; ST-HSCs (bottom panel), 1,143 cells. (B) Mean ± SEM is shown; n = 3 CB samples. (C) Cell diameter of indicated populations measured with ImageJ from microscopy pictures. n > 323 cells from four independent CB samples. (D) Mitochondrial mass as measured by flow cytometry with MitoGreen. MFI, Mean Fluorescence Intensity; mean ± S.E.M shown, n = 2 independent CB samples. (E) PhosphoS6 protein levels as measured by flow cytometry. Left panels: representative flow cytometry plots; black line, LT-HSCs; red line, ST-HSCs. Right panel: median fluorescence intensity of phosphoS6 staining. Mean ± SEM is shown. n = 2 CB samples. (F) Percentage of cells positive for phosphoRB (S807/S811) as measured by flow cytometry; mean ± S.E.M shown, n = 2 independent CB samples. GMP, granulocyte-monocyte progenitors. (G) Cumulative first division kinetics (excluding dead cells) of LT-HSCs (black) and ST-HSCs (red) from a representative CB example. Curve is least-squares sigmoid fit. R2 > 0.99. Arrowheads represent time to first division as estimated from sigmoid fit (tFirstDiv = logEC50). Time 0 is the time of exposure to mitogenic stimulus. (H) Mean time to first division (in hours). (I) Mean time of cell cycle transit (tSecondDiv = logEC50 of sigmoid fit of cumulative second division kinetics; see Figure S2E). (J) Mean time of G0 exit (in hours) (tG0exit = tFirstDiv – tSecondDiv). In (H)–(J), individual CB samples are shown; gray lines connect LT-HSC and ST-HSC parameters from the same CB. ∗∗p < 0.05, ∗∗∗p < 0.01 by paired t test. See also Figure S2.
Figure 3
Figure 3
Distinct CDK6 Levels Govern the G0 Exit Kinetics of LT- and ST-HSCs (A) Log2 signal intensity for CDK6 mRNA probe. Shown are individual measures (black circles: LT-HSCs, red squares: ST-HSCs, green triangles: GMPs) and the median and interquantile ranges (horizontal bars); n = 3. All multiple comparisons have been tested. (B) Immunofluorescence for CDK6 protein in LT- and ST-HSCs sorted from CB (left panel) or cultured for 4 days (right panel). Representative pictures and histograms of CDK6 fluorescence density are normalized to the fluorescence density of the IgG control in the same population. Positivity threshold was set over the median + 1 SD of the IgG control distribution and the percetnage of positive cells is indicated. 100–570 cells are analyzed with n = 3 CB samples. Scale bar represents 10 μM. (C) Normalized median CDK6 fluorescence density. Mean ± SEM is shown; n = 3 CB samples. GMPs, granulocyte-monocyte progenitors. (D) Immunofluorescence for CyclinD3 protein in LT-HSCs, ST-HSCs, and GMPs from freshly isolated CB (Day 0, left panel) or after 4 days of culture (Day 4, right panel). Shown are histograms of CyclinD3 fluorescence density normalized to the fluorescence density of the IgG control in the same population. Positivity threshold (dotted line) was set over the median + 1 SD of the IgG control distribution. n = 135–315 cells analyzed for day 0 and n = 49–245 cells for day 4. (E) Normalized median CyclinD3 fluorescence density at the indicated time points. Mean ± SEM is shown; n = 3 CB samples. ∗∗p < 0.05 by paired t test. (F) Time course analysis of CDK6 and CyclinD3 upon stimulation by mitogenic signals. Percentages of CDK6+ (top panel) or CyclinD3+ (bottom panel) cells in each of the indicated populations at the indicated time points after isolation from CB are shown. Mean ± S.E.M shown. n = 3 CB samples, except for day 2, where n = 2 CB samples. ∗∗p < 0.05 by paired t test. See also Figure S3.
Figure 4
Figure 4
CDK6 Levels Determine the Duration of Quiescence Exit in the HSC Pool (A–C) Cell division duration of single LT- and ST-HSCs after exposure to mitogenic signal in the presence or absence of PD033299 (50 nM). (A) Percentage of cells from the indicated populations that divided after 100 hr in culture. (B) Cumulative first division kinetics (excluding dead cells). Data from a representative CB example are shown. Curve is least-squares sigmoid fit. R2 > 0.99. (C) Mean time to first division (hours) (tfirstDiv = logEC50). (D–G) Cell division duration of single LT- and ST-HSCs after exposure to mitogenic signal with or without CDK6 EE. (D) Cumulative first division kinetics (excluding dead cells) of indicated populations transduced with indicated lentiviral vectors. Data from a representative CB are shown. Curve is least-squares sigmoid fit. R2 > 0.99. (E) Mean time to first division (hours) (tfirstDiv = logEC50). (F) Time of cell cycle transit of indicated populations in hours. (G) Expansion curves of LT- and ST-HSCs in culture. Shown is the average number of cells per single cell plated at the indicated time points after culture initiation. Data are from one representative experiment out of three. Time 0 represents the time of exposure to mitogenic stimulus. In (A), (C), (E), and (F), individual CB samples are shown; gray lines connect parameters from the same condition. ∗∗p < 0.05 by paired t test. See also Figure S4.
Figure 5
Figure 5
CDK6 EE LT-HSCs Outcompete Wild-Type HSCs without Exhaustion (A–D) NSG mice were injected with sorted Lin CD34+ CD38 cells transduced with CDK6 EE or control (LUC) lentiviral vectors (GFP+ cells) and untransduced competitive cells (GFP). Bone marrow was harvested at indicated time points post-transplantation and analyzed by flow cytometry. (A) Percentage of GFP+ cells among engrafted human hematopoietic cells (CD45+). Time 0 corresponds to percentage of GFP+ cells before injection in four independent CB samples. 4 weeks post-transplantation: n = 13 LUC and 14 CDK6 EE mice; 20 weeks post-transplantation: n = 25 LUC and 23 CDK6 EE mice. (B) Lymphoid to myeloid ratio (percentage of CD19+/CD33+) among GFP+ cells at 20 weeks post-transplantation. n = 25 LUC and 23 CDK6 EE mice. In (A) and (B), boxplots represent median, 25th, and 75th percentiles and whiskers represent min and max. Gray boxes, LUC; white boxes, CDK6 EE. (C) Percentage of GFP+ cells among LT-HSCs at 20 weeks post-transplantation. (D) Absolute number of LT-HSCs at 20 weeks post-transplantation. In (C) and (D), n = 6 mice from two CB samples. Individual mice, median, and interquantile range are shown. In (A)–(D), p < 0.1, ∗∗p < 0.05, ∗∗∗p < 0.01 by Mann-Whitney test. (E and F) CDK6 EE LT-HSCs expand over serial transplantation. LUC, CDK6 EE (GFP+), or untransduced (GFP) LT-HSCs were sorted from primary transplanted mice (n = 2 pools of three to five mice) and injected at four different doses into secondary NSG mice. (E) Engraftment levels (percentage of CD45+ cells) 12 weeks after secondary transplantation (>0.01% CD45+ GFP+ or CD45+ GFP) at the two highest doses (200 and 400 cells/mouse). Individual mice, median, and interquantile range are shown. (F) Summary table of number of mice engrafted at each dose tested and estimation of LT-HSC frequencies in each group by the ELDA statistical method. See also Figure S5.
Figure 6
Figure 6
Simulation of the Impact of Delayed G0 Exit in LT-HSCs on the HSC Pool with an Agent-Based Model (A) Comparison between the three hypotheses tested by the modeling strategy. Earlier modeling strategies of homeostasis assumed that all HSCs started division upon receiving a mitogenic signal with one characteristic cycling time per HSC subtype (HYP. 1). Rather, we propose that G0 exit and cell cycle progression are differentially and independently regulated. This results in two characteristic cycling times per HSC subtype without (HYP. 2.1) or with (HYP. 2.2) a delay in G0 exit between LT- and ST-HSCs. Cycling times indicated are as measured in Figures 2G–2J. (B and C) Simulated number of LT-HSC divisions per year in the HSC pool at homeostasis (B) and after perturbation (C). (D) Effect of changing the LT-HSC G0 exit delay parameter on the number of LT-HSC divisions. Shown is the number of divisions in the LT-HSC pool per year when the delay of G0 exit of LT-HSCs (compared to ST-HSCs) is inputted at 0 (no delay), 2.9, 5.8 (experimental value), or 11.6 hr. (E) Perturbation model: 1% of the progenitor compartment was eliminated at the time indicated by an arrow to simulate injury. Number of progenitor cells (left panel), ST-HSCs (middle panel), and LT-HSCs (right panel) are displayed as a function of time. In (B)–(E), data represent the mean ± SD of 256 runs. The simulations were run with a noise parameter of 5% and an HSC pool exit rate of 24 cells per day. How parameters were chosen and results with different parameters are shown in Figure S6 and discussed in the Supplemental Experimental Procedures.

References

    1. Aryee M.J., Gutiérrez-Pabello J.A., Kramnik I., Maiti T., Quackenbush J. An improved empirical bayes approach to estimating differential gene expression in microarray time-course data: BETR (Bayesian Estimation of Temporal Regulation) BMC Bioinformatics. 2009;10:409. - PMC - PubMed
    1. Benveniste P., Frelin C., Janmohamed S., Barbara M., Herrington R., Hyam D., Iscove N.N. Intermediate-term hematopoietic stem cells with extended but time-limited reconstitution potential. Cell Stem Cell. 2010;6:48–58. - PubMed
    1. Bradford G.B., Williams B., Rossi R., Bertoncello I. Quiescence, cycling, and turnover in the primitive hematopoietic stem cell compartment. Exp. Hematol. 1997;25:445–453. - PubMed
    1. Catlin S.N., Busque L., Gale R.E., Guttorp P., Abkowitz J.L. The replication rate of human hematopoietic stem cells in vivo. Blood. 2011;117:4460–4466. - PMC - PubMed
    1. Cheshier S.H., Morrison S.J., Liao X., Weissman I.L. In vivo proliferation and cell cycle kinetics of long-term self-renewing hematopoietic stem cells. Proc. Natl. Acad. Sci. USA. 1999;96:3120–3125. - PMC - PubMed

Publication types

MeSH terms

Substances

Associated data