. 2015 Feb 24;10(7):1096-109.
doi: 10.1016/j.celrep.2015.01.043. Epub 2015 Feb 19.

Analysis of p53 transactivation domain mutants reveals Acad11 as a metabolic target important for p53 pro-survival function

Affiliations

Analysis of p53 transactivation domain mutants reveals Acad11 as a metabolic target important for p53 pro-survival function

Dadi Jiang et al. Cell Rep. .

Abstract

The p53 tumor suppressor plays a key role in maintaining cellular integrity. In response to diverse stress signals, p53 can trigger apoptosis to eliminate damaged cells or cell-cycle arrest to enable cells to cope with stress and survive. However, the transcriptional networks underlying p53 pro-survival function are incompletely understood. Here, we show that in oncogenic-Ras-expressing cells, p53 promotes oxidative phosphorylation (OXPHOS) and cell survival upon glucose starvation. Analysis of p53 transcriptional activation domain mutants reveals that these responses depend on p53 transactivation function. Using gene expression profiling and ChIP-seq analysis, we identify several p53-inducible fatty acid metabolism-related genes. One such gene, Acad11, encoding a protein involved in fatty acid oxidation, is required for efficient OXPHOS and cell survival upon glucose starvation. This study provides new mechanistic insight into the pro-survival function of p53 and suggests that targeting this pathway may provide a strategy for therapeutic intervention based on metabolic perturbation.


Figures

Figure 1
Figure 1. p53 promotes cell survival and OXPHOS in HrasV12 MEFs upon glucose starvation
(A) Relative survival of HrasV12;p53+/+ and HrasV12;p53−/− MEFs in 1 mM glucose normalized to cell survival in 25 mM glucose after 72 hours. The ratio of HrasV12;p53+/+ MEFs is set to 1.0. (B) Percentages of surviving HrasV12;p53+/+ and HrasV12;p53−/− MEFs in the presence of varying concentrations of 2-deoxyglucose (2-DG) relative to cell survival in 0 mM 2-DG, which is set to 100%, after 72 hours. For (A) and (B), results represent the mean ± SEM from direct cell counts with the Coulter counter. (C) Average OCR ± SEM of HrasV12;p53+/+ and HrasV12;p53−/− MEFs determined by the Seahorse XF assay. (D) Average OCR ± SEM by the Seahorse XF assay ± the specific FAO inhibitor etomoxir (100 μM) in the presence of uncoupler FCCP. The decrease in OCR upon etomoxir treatment represents the proportion of the OCR due to FAO. p-values from the Student’s t-test are indicated. N. S.: not significant. See also Figure S1 and S2.
Figure 2
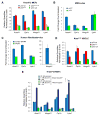
Figure 2. p53 transactivation potential is critical for cell survival and OXPHOS under metabolic stress
(A) Schematic view of p53 TAD mutants used in this study. TAD: transcriptional activation domain. DBD: DNA-binding domain. OD: oligomerization domain. (B) Left: In HrasV12 MEFs homozygous for each p53 allele, efficiency of Ad-Cre-mediated recombination of the Lox-stop-Lox (LSL) element to induce wild-type or mutant p53 expression was determined by p53 immunofluorescence staining and counting the percentage of p53-positive cells out of 200 DAPI-positive cells in each experiment. Right: p53 protein levels in HrasV12-expressing MEFs of different p53 genotypes. β-actin served as loading control. (C) Relative survival by direct cell counts of HrasV12 MEFs expressing wild-type p53, p53 TAD mutants, or no p53 in 1 mM glucose normalized to cell survival in 25 mM glucose after 72 hours. The ratio of HrasV12;p53+/+ MEFs is set to 1.0. (D) Relative survival by SRB staining of HrasV12;p53+/+, HRasV12;p53−/− and HRasV12;p53R172H/R172H MEFs cultured in 1 mM glucose normalized to cell survival in 25 mM glucose after 72 hours. The ratio of HrasV12;p53+/+ MEFs is set to 1.0. (E) Relative OCRs of HrasV12 MEFs expressing wild-type p53 or different p53 TAD mutants, determined by the Seahorse XF assay. Results represent normalized OCRs (OCR of Ad-Cre-infected HrasV12;p53LSL/LSL MEFs to OCR of the same Ad-Empty-infected HrasV12;p53LSL/LSL MEF line). Solid bars show basal OCR measurements and hatched bars show OCR measurements after adding FCCP. Histogram results in all panels represent the mean ± SEM. p-values from the Student’s t-test are indicated. N. S.: not significant.
Figure 3
Figure 3. Gene expression profiling to identify genes activated by both wild-type p53 and p5325,26 in HrasV12 MEFs
(A) Experimental scheme. Primary MEFs homozygous for the various Lox-stop-Lox (LSL) p53 TAD mutant alleles were retrovirally transduced with HrasV12, then infected with Ad-Cre to recombine the LSL element and express the p53 alleles. Empty adenoviruses (Ad-Empty) were used to generate p53-null control MEFs. Wild-type (p53+/+) and p53−/− MEFs provided additional controls. (B) Top enriched biological processes (P < 0.05) by Panther Analysis of the top 50 unique genes identified as being efficiently activated by both wild-type p53 and p5325,26. p-values are calculated by the binominal statistic. (C) Heat map analysis of Acad11 (2 probe sets) and Hmgcll1 (1 probe set), genes within the Acyl-CoA Metabolic Process category (lower panel). The numbers above the heat maps represent the different biological replicates within each genotypic group of MEFs. Cpt1c (1 probe set) and Lpin1 (2 probe sets), which fail to meet the stringent cutoff, are shown in the upper panel. Red and blue represent higher and lower expression, respectively.
Figure 4
Figure 4. Induction of metabolic target genes depends on p53 transactivation function
(A) Validation of Acad11, Cpt1c, Hmgcll1 and Lpin1 expression levels using qRT-PCR analysis on HrasV12 MEFs homozygous for p53 mutant alleles. (B) qRT-PCR analysis of Acad11, Cpt1c, Hmgcll1 and Lpin1 expression levels in p53+/+ and p53−/− MEFs either left untreated or treated with 0.2 μg/ml doxorubicin (dox) for 6 hours. (C) qRT-PCR analysis of Acad11, Cpt1c, Hmgcll1 and Lpin1 expression levels in normal human fibroblasts expressing a p53 shRNA or control shRNA. Cells were left untreated or treated with 0.2 μg/ml doxorubicin (dox) for 6 hours. (D) qRT-PCR analysis of Acad11, Cpt1c, Hmgcll1 and Lpin1 expression levels in KrasG12D-expressing mouse NSCLC cells of different p53 genotypes. For all panels, colors represent the different p53 genotypes. (E) qRT-PCR analysis of Acad11, Cpt1c, Hmgcll1 and Lpin1 expression levels in HrasV12;p53+/+ and HRasV12;p53−/− MEFs cultured in normal glucose (25 mM), low glucose (1 mM) or 0.2 μg/ml doxorubicin (dox) as a positive control for induction, for 6 hours. For (A), (D) and (E), values are average quantities of technical triplicates normalized to β-actin ± c.v. (coefficient of variation). For (B) and (C), the ratios of treated/untreated normalized to β-actin ± c.v. are graphed. See also Figure S3.
Figure 5
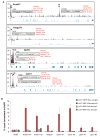
Figure 5. ChIP analysis of direct p53 binding to metabolic genes
(A) ChIP-sequencing profiles and identified peak-associated p53 binding sites for each metabolism-related gene. Exons are shown as blue boxes and introns are marked by blue dashed lines. Inverted red triangles point to the called peaks. Arrows indicate the transcription start site (TSS). Uppercase letters in binding site represent bases matching the consensus p53-binding sequence and lowercase letters represent mismatches. Underlined letters highlight the critical bases in the p53 response element. Grey lowercase letters represent spacers between the two half-sites. The position of the site (intronic or exonic), the number of base pairs in individual half-sites matching the consensus sequence, and the length of the spacers between half sites are summarized in red. The numbers above the sites show the distance in base pairs from the TSS. (B) qPCR analysis confirming enrichment of p53 binding at the sites shown in (A) after ChIP using either a p53-specific antibody or IgG control, from doxorubicin (dox)-treated p53+/+ (red and blue bars, respectively) and p53−/− MEFs (negative control, purple and green bars, respectively). Percentages of ChIP relative to input were calculated for individual sites, then normalized to that of Nc6R, which is set to 1%. The results are then plotted ± SEM. Nc6R represents a random “gene desert” region selected as a negative control. See also Figure S4.
Figure 6
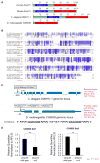
Figure 6. Regulation of Acad11 by p53 is evolutionarily conserved
(A) The organization of the domains in the ACAD proteins is conserved across species, as determined by the NCBI Conserved Domain Database (CDD). Blue denotes the ACAD10_11_like domain, which is unique to the Acad10 and Acad11 members of the ACAD protein family and has similarity to phosphotransferases catalyzing intramolecular transfer of phosphate groups. Red denotes the ACAD_FadE2 FAD-binding domain identified in FadE2-like Acyl-CoA dehydrogenases within the ACAD family of proteins in Homo sapiens, Mus musculus and C. elegans, and the IVD FAD-binding domain (identified in Isovaleryl-CoA dehydrogenase, IVD) within the D. melanogaster homologue. The numbers above each protein denote amino acid positions. (B) Protein sequence alignment of the ACAD_FadE2 domains in Homo sapiens, Mus musculus and C. elegans, and the IVD domain in D. melanogaster using the ClustalW2 program. Blue shading indicates the identities of residues between proteins of different species, generated by the Percentage Identity option in Jalview, with darker blue signifying identity in more species. (C) The genomic organization of the K09H11.1 (C. elegans Acad11 homolog) and CG6638 (D. melanogaster Acad11 homolog) loci and the sequences of the identified p53-binding sites within these loci. The number of base pairs in individual half-sites matching the consensus sequence and the length of the spacers between the two half sites are summarized in red. The consensus p53-binding sequence is shown below. (D) qRT-PCR analysis of CG6638 expression in cells from wild-type or Dmp53 null D. melanogaster embryos. Levels represent mean quantities of technical triplicates from two independent sets of total RNAs normalized to β-actin ± c.v. p-values from the Student’s t-test are indicated. See also Figure S5.
Figure 7
Figure 7. Acad11 is required for the pro-survival and OXPHOS-promoting functions of p53
(A) Knockdown of Acad11 was confirmed by Western blotting (top) and qRT-PCR (bottom). β-actin served as loading control. qRT-PCR data represent the mean quantities from technical triplicates normalized to β-actin ± c.v. (B) Fractions of surviving HrasV12;p53+/+ MEFs expressing Acad11 or GFP control shRNAs in the presence of 5 or 20 mM 2-deoxyglucose (2-DG) compared to cell survival in 0 mM 2-DG, which is set to 100%, after 72 hours. Results represent the mean ± SEM of direct cell counts. (C) Average OCR ± SEM of HrasV12;p53+/+ MEFs expressing Acad11 or GFP control shRNAs, by the Seahorse XF assay. (D) Relative survival of HrasV12;p53−/− cells overexpressing Acad11, Hmgcll1, Cpt1c (black boxes), GFP (open boxes), or the combination of Acad11 and another gene (black boxes) in 1 mM glucose normalized to 25 mM glucose after 48 hours. Data are relative to the GFP control, which is set to 1.0. Results represent the mean ± SEM by SRB staining. (E) Overexpressed protein levels were assessed by Western blotting using anti-HA and anti-Acad11 antibodies. β-actin serves as a loading control. Red triangles point to the bands corresponding to the overexpressed proteins based on their molecular weight. (F) Effect of glucose starvation on HrasV12;p53−/− xenograft tumor growth. Two weeks after tumor cell injection, mice were maintained on a ketogenic diet (glucose-starved) or a regular diet. Average tumor volume ± SEM was plotted as a function of time starting from the first measurement. (G) Average mouse weights ± SEM in both dietary groups on specific days are graphed. p-values from the Student’s t-test are indicated. See also Figure S6.

References

    1. Assaily W, Rubinger DA, Wheaton K, Lin Y, Ma W, Xuan W, Brown-Endres L, Tsuchihara K, Mak TW, Benchimol S. ROS-mediated p53 induction of Lpin1 regulates fatty acid oxidation in response to nutritional stress. Mol Cell. 2011;44:491–501. - PubMed
    1. Belyi VA, Ak P, Markert E, Wang H, Hu W, Puzio-Kuter A, Levine AJ. The origins and evolution of the p53 family of genes. Cold Spring Harb Perspect Biol. 2010;2:a001198. - PMC - PubMed
    1. Bensaad K, Tsuruta A, Selak MA, Vidal MN, Nakano K, Bartrons R, Gottlieb E, Vousden KH. TIGAR, a p53-inducible regulator of glycolysis and apoptosis. Cell. 2006;126:107–120. - PubMed
    1. Berkers CR, Maddocks OD, Cheung EC, Mor I, Vousden KH. Metabolic regulation by p53 family members. Cell Metab. 2013;18:617–633. - PMC - PubMed
    1. Bieging KT, Mello SS, Attardi LD. Unravelling mechanisms of p53-mediated tumour suppression. Nat Rev Cancer. 2014;14:359–370. - PMC - PubMed

Publication types

MeSH terms

Associated data