. 2015 Feb 24;10(7):1158-72.
doi: 10.1016/j.celrep.2015.01.049. Epub 2015 Feb 19.

Vascular endothelial growth factor receptor 3 controls neural stem cell activation in mice and humans

Affiliations

Vascular endothelial growth factor receptor 3 controls neural stem cell activation in mice and humans

Jinah Han et al. Cell Rep. .

Abstract

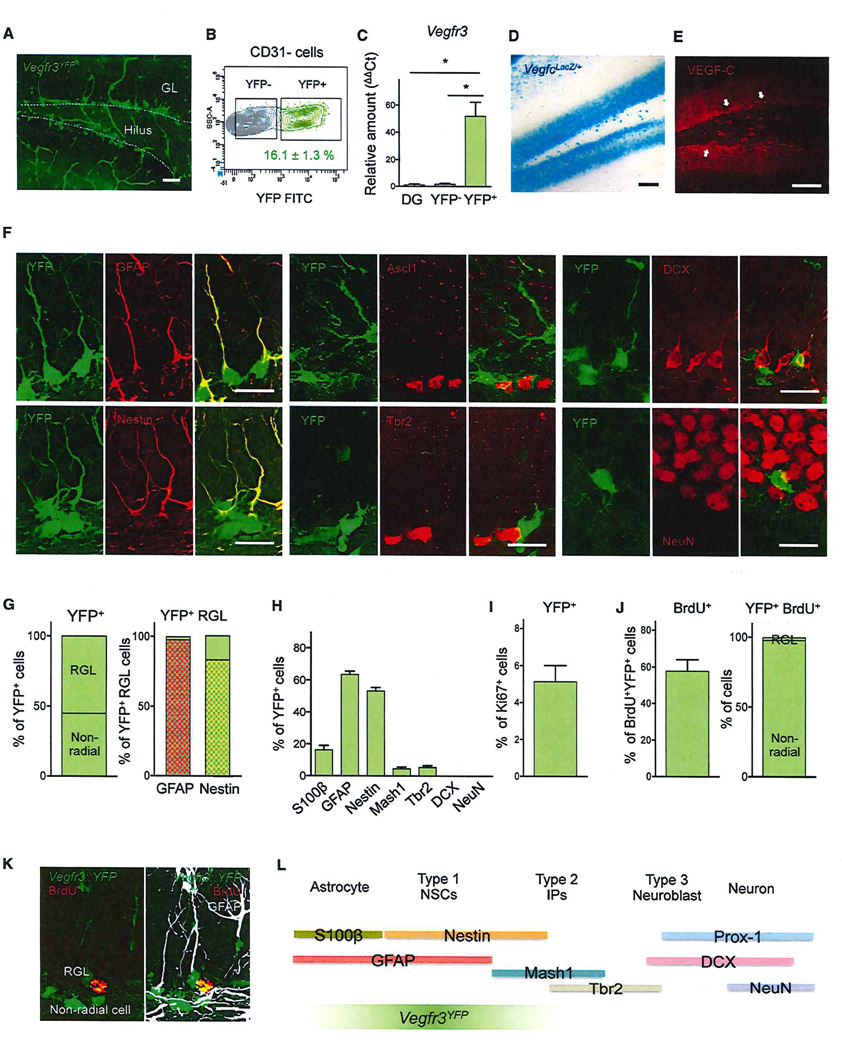
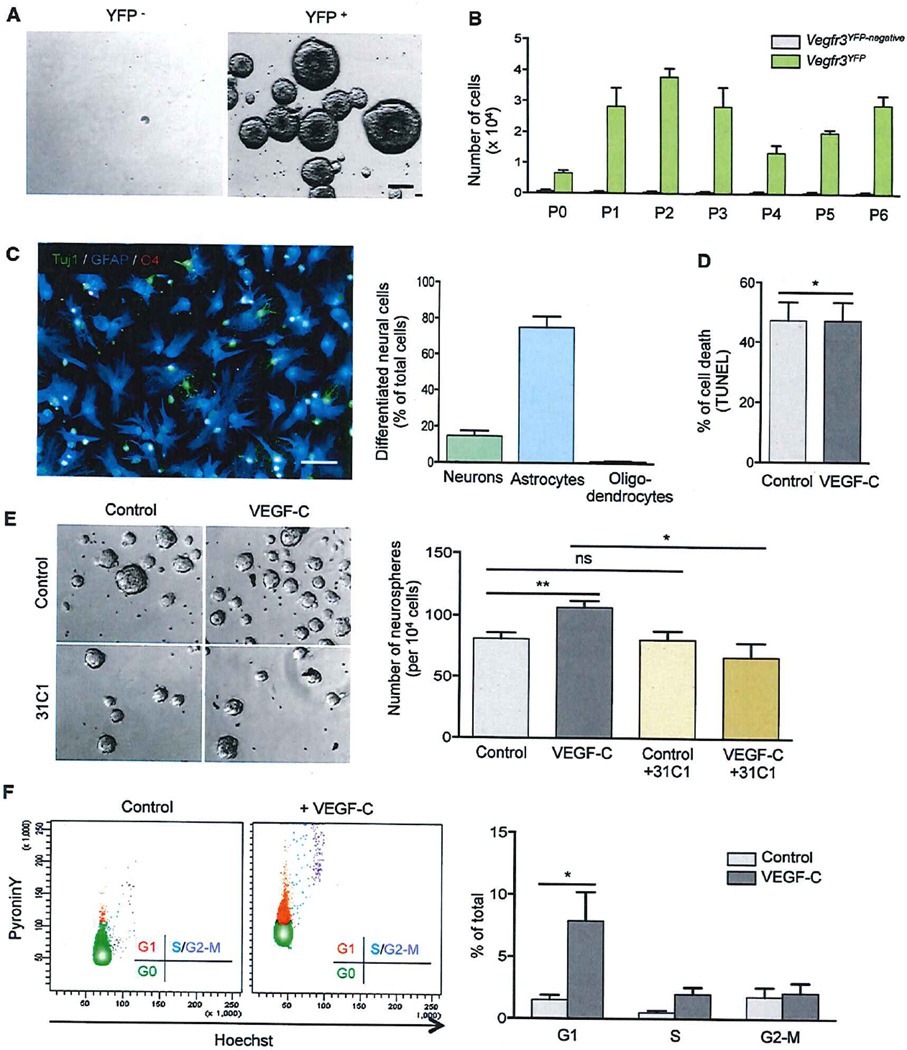
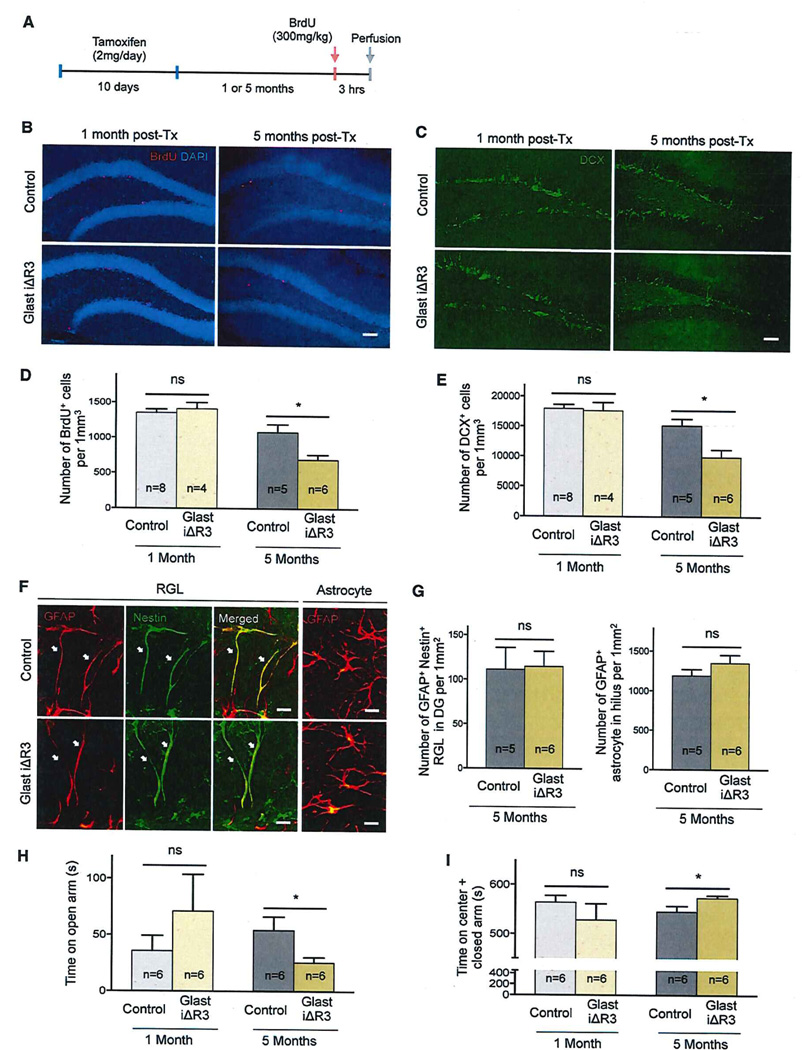
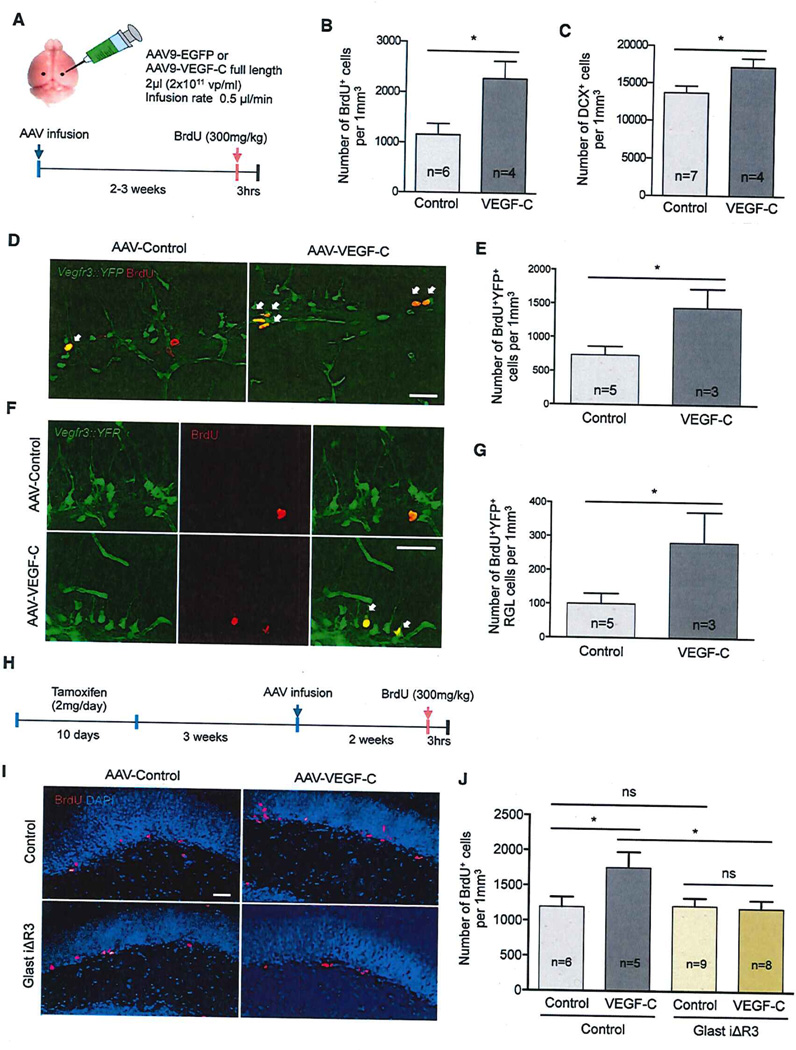
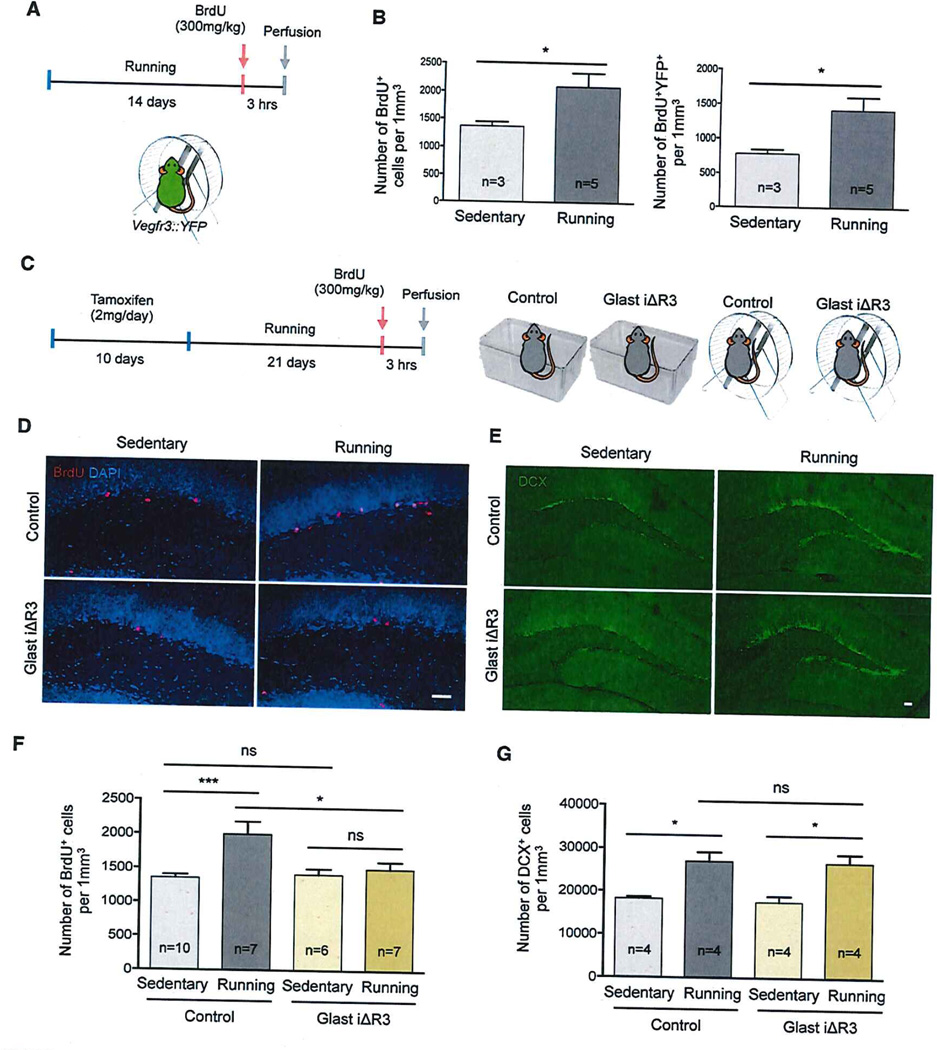
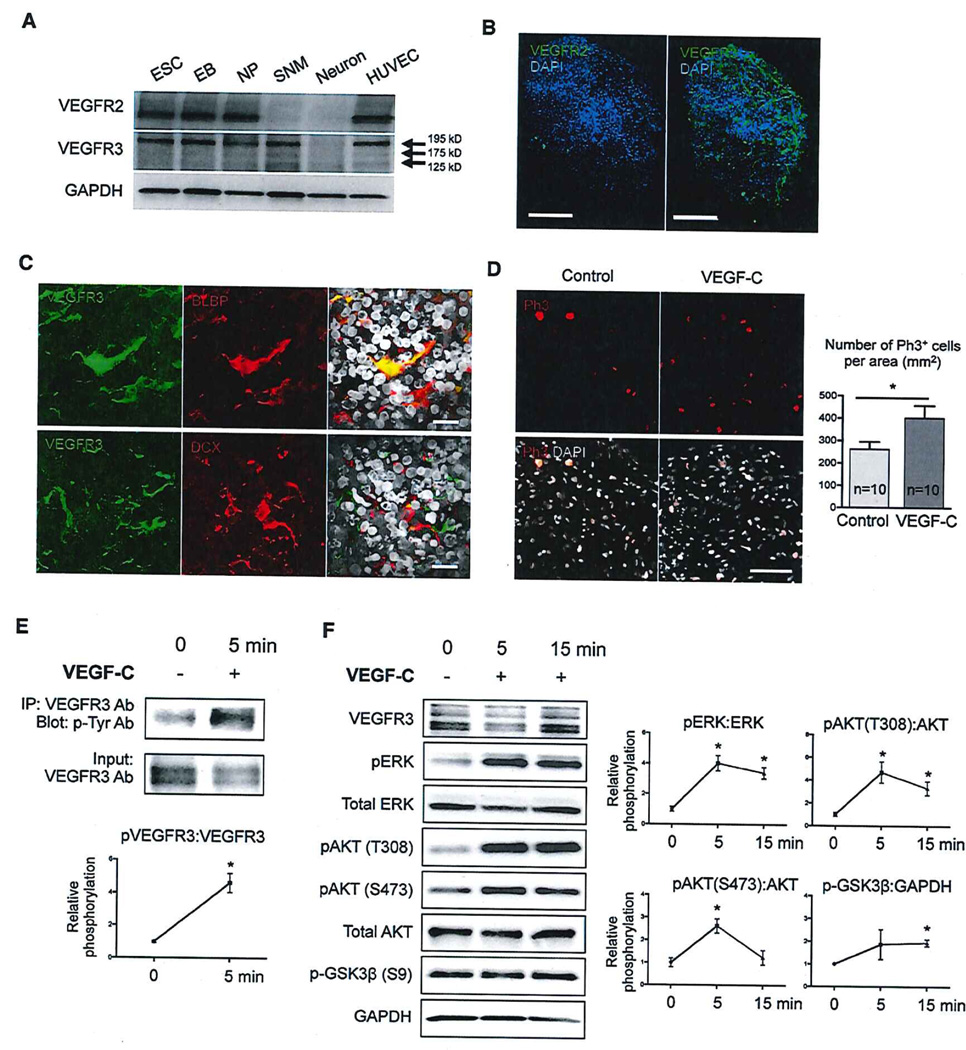
Neural stem cells (NSCs) continuously produce new neurons within the adult mammalian hippocampus. NSCs are typically quiescent but activated to self-renew or differentiate into neural progenitor cells. The molecular mechanisms of NSC activation remain poorly understood. Here, we show that adult hippocampal NSCs express vascular endothelial growth factor receptor (VEGFR) 3 and its ligand VEGF-C, which activates quiescent NSCs to enter the cell cycle and generate progenitor cells. Hippocampal NSC activation and neurogenesis are impaired by conditional deletion of Vegfr3 in NSCs. Functionally, this is associated with compromised NSC activation in response to VEGF-C and physical activity. In NSCs derived from human embryonic stem cells (hESCs), VEGF-C/VEGFR3 mediates intracellular activation of AKT and ERK pathways that control cell fate and proliferation. These findings identify VEGF-C/VEGFR3 signaling as a specific regulator of NSC activation and neurogenesis in mammals.


Figures

Figure 1
Figure 1. Vegf-c/Vegfr3 Are Expressed by Adult Hippocampal Stem Cells
(A) Coronal DG section of an adult Vegfr3::YFP mouse. YFP expression is detected both in vessels and SGZ cells. White dotted line indicates SGZ. (B) isolation of Vegfr3YFP cells from the DG of adult Vegfr3::YFP mice. After exclusion of CD31+ endothelial cells, a subset of Vegfr3YFP cells were sorted by FACS. (C) qRT-PCR analysis of FACS-sorted cells from the DG of Vegfr3::YFP adult mice. Vegfr3 transcripts are specifically enriched in Vegfr3YFP cells compared to total DG neural cells (non-endothelial DG cells) and Vegfr3YFP-negative cells, n = 3 independent experiments; bars: mean ± SEM; Student’s t test: p < 0.05 (*). (D and E) Coronal DG section of adult VegfclacZ/+ mouse stained with X-gal and of wild-type mouse labeled with anti-VEGF-C Ab (E). White arrows indicate a higher level of VEGF-C expression in SGZ. (F) Representative images of coronal DG sections in adult Vegfr3::YFP mice stained with Abs against markers of RGL (GFAP and Nestin), progenitor cells (Ascl1 and Tbr2), neuroblasts (DCX), and neurons (NeuN) (red). (G) Quantification of Vegfr3YFP SGZ cells by their morphology. Percentage of Vegfr3YFP RGL cells expressing GFAP and Nestin. (H) Quantification of Vegfr3YFP SGZ cell subtypes according to their antigen expression. y axis: % of YFP+ marker+ cells/YFP+ cells. Total 30–500 cells were counted from three to six sections. (I) 5% of Vegfr3YFP SGZ cells has entered the cell cycle (Ki67+). n = 100–150 cells/section, counted from seven sections. Bars: mean ± SEM. (J) Vegfr3YFP cells represent 60% of BrdU+ SGZ cells. Most BrdU+Vegfr3YFP cells are non-radial cells (98%), and only a few of them are RGL cells (2%). n = 30–50 cells counted from five sections. (K) Vegfr3YFP SGZ cell morphology and activity. An anti-GFAP Ab labels RGLs (white), but not YFP+-non-radial cells. A 3-hr pulse of BrdU (red) labels exclusively non-radial YFP+ cells. (L) Comparison of the expression of Vegfr3YFP and other stage-specific markers in SGZ cells. Vegfr3YFP expression is specific to NSCs and progenitor cells. The scale bars represent 100 µm (A, D, and E) and 16 µm (F and K). See also Figure S1.
Figure 2
Figure 2. VEGF-C/VEGFR3 Signaling Activates Hippocampal NSCs In Vitro
(A and B) Neurosphere cultures derived from sorted Vegfr3YFP and Vegfr3YFP-negativecells. The formation of neurospheres was only observed in Vegfr3YFP cell cultures that can self-renew for at least six successive passages. (C) Representative images and quantification of neurosphere differentiation. Vegfr3YFP cells differentiate into TuJ1+ neuron (green), GFAP+ astrocyte (blue), and very few 04+ oligodendrocyte (red). (D) Cell death was quantified by TUNEL staining. (E) Representative images and quantification of neurospheres after treatment with VEGF-C (50 ng/ml) and a VEGFR3-function-blocking antibody (31C1). (F) FACS profile and cell cycle analysis of control Vegfr3YFP cells and VEGF-C-treated Vegfr3YFP cells after Pyronin Y/Hoechst 33342 staining. The scale bars represent 50 µm (A and C). Student’s t test: p < 0.05 (*); p < 0.005 (**); not significant (ns). Bars: mean ± SEM; n = 3–5 independent experiments. See also Figure S2.
Figure 3
Figure 3. Vegfr3 Deletion in Adult Hippocampal NSPCs
(A) Schedule of Tx and BrdU administration to induce Vegfr3 deletion in NSCs and label-activated NSCs. (B and C) Representative images of coronal DG sections from control (upper panel) and Glast iΔR3 mice (lower panel) at indicated time points. Sections are stained for BrdU (red), DAPI (blue), and DCX (green). The scale bars represent 70 µm. (D and E) Quantification of BrdU+ cells and DCX+ cells in the DG of control and Glast iΔR3 mice at 1 month and 5 months post-Tx administration. (F and G) Representative images and quantification of RGL cells (GFAP+Nestin+ cells in SGZ, white arrow) and astrocytes (GFAP+ cells in hilus) of control and Glast iΔR3 mice at 5 months post-Tx administration. The scale bars represent 16 µm. (H and I) Quantification of and EPM test. Student’s t test: p < 0.05 (*); not significant (ns). Bars: mean ± SEM. See also Figure S3.
Figure 4
Figure 4. VEGFR3 Mediates VEGF-C-Induced Proliferation in Hippocampal NSCs
(A) Intra-hippocampal injection of AAV9-GFP (control) and -VEGF-C. At 2 to 3 weeks after AAV infection, mice were given a 3-hr pulse of BrdU and analyzed to quantify proliferation and neuroblast production in the DG. (B and C) Quantification of BrdU+ cells and DCX+ cells in the SGZ of control and VEGF-C-treated mice. (D and E) Representative images and quantification of BrdU+Vegr3YFP cells after VEGF-C overexpression in Vegfr3::YFP mice. VEGF-C treatment increases BrdU+Vegr3YFP cells in SGZ (white arrows). The scale bars represent 35 µm. (F and G) Representative images and quantification of BrdU+Vegr3YFP RGL cells after VEGF-C overexpression in Vegfr3::YFP mice. VEGF-C treatment increases BrdU+Vegr3VFP RGL cells in SGZ (white arrows). The scale bars represent 35 µm. (H) Schedule of Tx treatment, AAV9 infection, and BrdU administration in control and Glast iΔR3 mice. (I and J) Representative images and quantification of BrdU+ SGZ cells in control (upper panel) and -Glast iΔR3 mice (lower panel) after VEGF-C treatment. VEGF-C overexpression increases BrdU+ SGZ cells (red) in control mice, but not in Glast iΔR3 mice. The scale bar represents 35 µm. Student’s t test: p < 0.05 (*); ns, not significant. Bars: mean ± SEM. See also Figure S4.
Figure 5
Figure 5. VEGFR3 Is Required for Exercise-Induced NSPC Proliferation
(A) Schedule of voluntary running activity and BrdU administration for Vegfr3::YFP mice. (B) Quantification of BrdU+ cells and BrdU+Vegfr3YFP cells in the SGZ of sedentary control and running Vegfr3::YFP mice. (C) Schedule of Tx treatment, voluntary running activity, and BrdU administration in control and Glast iΔR3 mice. (D–G) Representative images and quantification of BrdU+ SGZ cells and DCX+ cells in control (upper panel) and Glast iΔR3 mice (lower panel), either sedentary (left) or running (right). BrdU+ cells (red), DAPI (blue), and DCX+ cells (green) are shown. Running induces proliferation of NSCs in control mice, but not in Glast iΔR3 mice. A similar number of neuroblasts is generated in control and Glast iΔR3 mice. The scale bar represents 35 µm. Student’s t test: p < 0.05 (*); p < 0.001 (***); not significant (ns). Bars: mean ± SEM. See also Figure S5.
Figure 6
Figure 6. VEGFR3-Signaling Pathway in Human NSCs
(A) Western blot analysis of VEGFR2 and VEGFR3 expression in H1 human-ESC-derived NSCs. VEGFR3 migrates as three molecular weight species: 195,175, and 125 kDa (arrows). EB, embryoid bodies; ESC, embryonic stem cells; HUVEC, human umbilical vein endothelial cells; NP, neural progenitors; SNM, spherical neural mass. (B) SNMs stained with anti-hVEGFR2 and -hVEGFR3 antibodies as indicated. The scale bars represent 100 µm. (C) SNMs stained for VEGFR3 (green), BLBP (red; astroglia/NSC), or DCX (red; neuron) and DAPI (gray). The scale bars represent 20 µm. (D) Representative image of phospho-histone H3 staining. The scale bar represents 100 µm. (E) Phospo-VEGFR3 analysis by immunoprecipitation. (F) Western blot analysis of the phosphorylation state of ERK, AKT (tyrosine 398 and serine 473), and GSK3β in SNMs after VEGF-C stimulation. Student’s t test: p < 0.05 (*). Bars/lines: mean ± SEM. See also Figure S6.

Comment in

Similar articles

Cited by

References

    1. Abies JL, Decarolis NA, Johnson MA, Rivera PD, Gao Z, Cooper DC, Radtke F, Hsieh J, Eisch AJ. Notch1 is required for maintenance of the reservoir of adult hippocampal stem cells. J. Neurosci. 2010;30:10484–10492. - PMC - PubMed
    1. Abrajano JJ, Qureshi IA, Gokhan S, Molero AE, Zheng D, Bergman A, Mehler MF. Corepressor for element-1-silencing transcription factor preferentially mediates gene networks underlying neural stem cell fate decisions. Proc. Natl. Acad. Sci. USA. 2010;107:16685–16690. - PMC - PubMed
    1. Aguirre A, Rubio ME, Gallo V. Notch and EGFR pathway interaction regulates neural stem cell number and self-renewal. Nature. 2010;467:323–327. - PMC - PubMed
    1. Allegrucci C, Young LE. Differences between human embryonic stem cell lines. Hum. Reprod. Update. 2007;13:103–120. - PubMed
    1. Altman J, Das GD. Autoradiographic and histological evidence of postnatal hippocampal neurogenesis in rats. J. Comp. Neurol. 1965;724:319–335. - PubMed

Publication types

MeSH terms

Substances