Review
. 2015 Mar-Apr;4(2):59-84.
doi: 10.1002/wdev.168. Epub 2014 Dec 29.

Identifying transcriptional cis-regulatory modules in animal genomes

Affiliations
Review

Identifying transcriptional cis-regulatory modules in animal genomes

Kushal Suryamohan et al. Wiley Interdiscip Rev Dev Biol. 2015 Mar-Apr.

Abstract

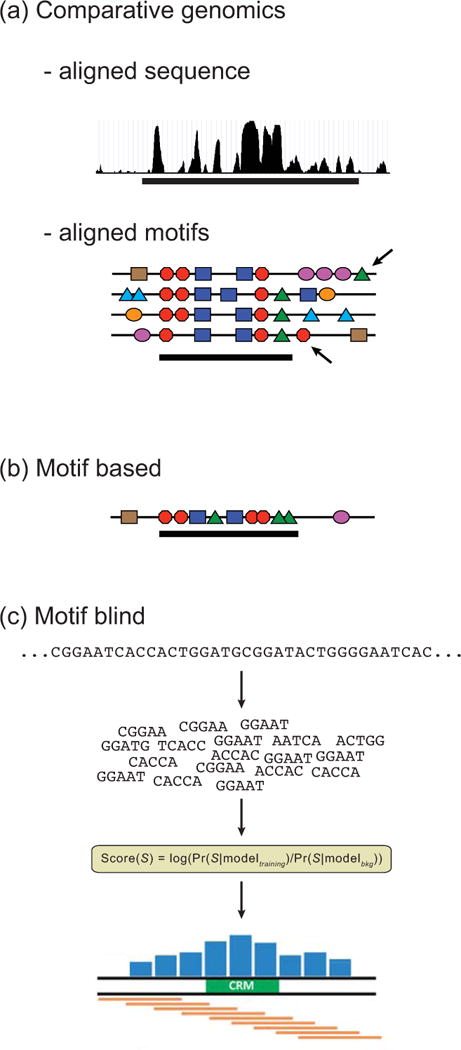
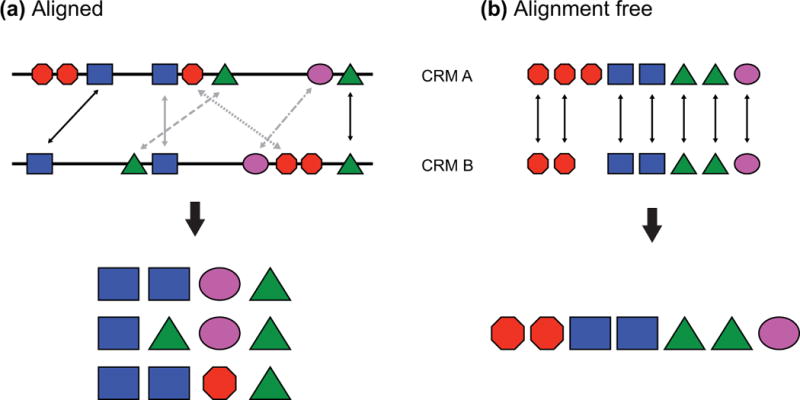
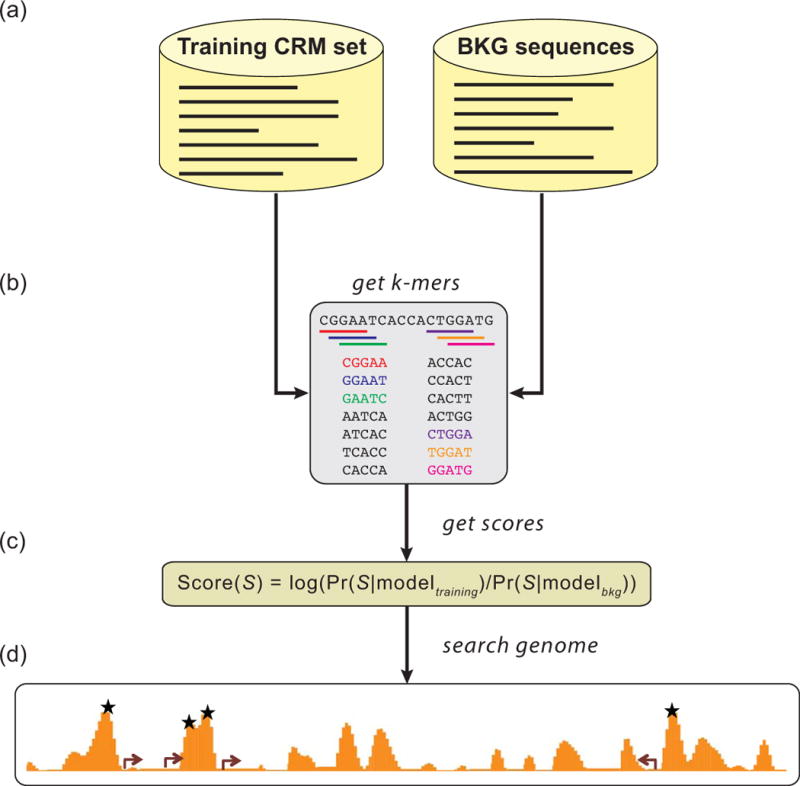
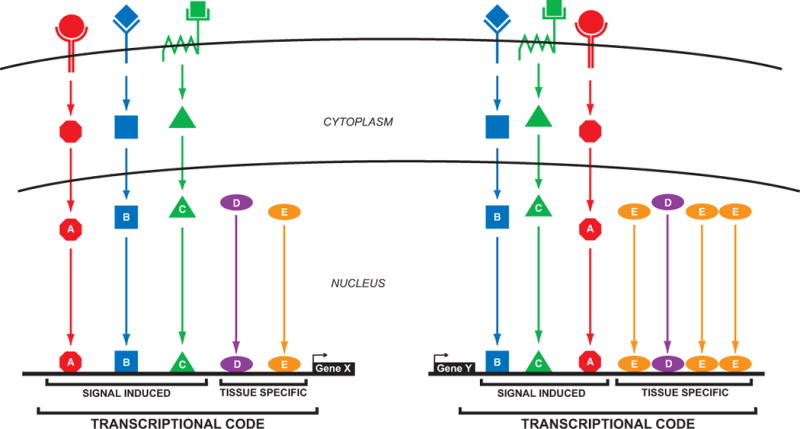
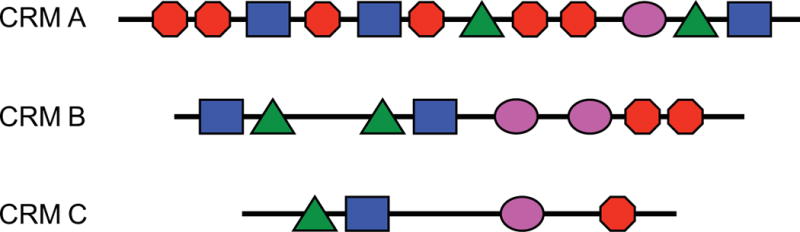
Gene expression is regulated through the activity of transcription factors (TFs) and chromatin-modifying proteins acting on specific DNA sequences, referred to as cis-regulatory elements. These include promoters, located at the transcription initiation sites of genes, and a variety of distal cis-regulatory modules (CRMs), the most common of which are transcriptional enhancers. Because regulated gene expression is fundamental to cell differentiation and acquisition of new cell fates, identifying, characterizing, and understanding the mechanisms of action of CRMs is critical for understanding development. CRM discovery has historically been challenging, as CRMs can be located far from the genes they regulate, have few readily identifiable sequence characteristics, and for many years were not amenable to high-throughput discovery methods. However, the recent availability of complete genome sequences and the development of next-generation sequencing methods have led to an explosion of both computational and empirical methods for CRM discovery in model and nonmodel organisms alike. Experimentally, CRMs can be identified through chromatin immunoprecipitation directed against TFs or histone post-translational modifications, identification of nucleosome-depleted 'open' chromatin regions, or sequencing-based high-throughput functional screening. Computational methods include comparative genomics, clustering of known or predicted TF-binding sites, and supervised machine-learning approaches trained on known CRMs. All of these methods have proven effective for CRM discovery, but each has its own considerations and limitations, and each is subject to a greater or lesser number of false-positive identifications. Experimental confirmation of predictions is essential, although shortcomings in current methods suggest that additional means of validation need to be developed. For further resources related to this article, please visit the WIREs website.

Conflict of interest: The authors have declared no conflicts of interest for this article.


Figures

Figure 1
Figure 1. cis-Regulatory Modules
(a) Modular nature of CRMs. The region downstream of the Drosophila even skipped (eve) gene has numerous CRMs (pink boxes), each of which controls a different portion of the gene’s expression pattern. Reporter gene expression directed by individual CRMs (black) is shown superimposed on Eve protein expression (brown). During the early blastoderm stages, individual stripes are regulated by separate CRMs (S1, S4–6, S5), as is later embryonic expression in the somatic musculature (M). Expression from other CRMs including those in the 5′ flanking region are not pictured. Photos courtesy of James Jaynes and Miki Fujioka. (b) Generalized mechanisms of CRM function. Active CRMs (orange), bound by multiple transcription factors (TF), contact their associated promoter by DNA looping. Either through direct contact or via bridging interactions from coactivators, the CRMs help to recruit and/or stabilize RNApolII and the general transcription factors (GTFs). TSS, transcription start site.
Figure 2
Figure 2. Reporter Genes
The “gold-standard” test for CRM function is the reporter gene assay, in which a putative CRM sequence is cloned upstream of a minimal promoter-reporter cassette sequence that on its own has little or no transcription. The reporter gene can be any gene whose expression is easily assayed. Current common reporters include luciferase, ß-galactosidase (the E. coli lacZ gene), and fluorescent proteins such as the A. victoria green fluorescent protein (GFP) and its derivatives. lacZ and the fluorescent protein genes are particularly suitable for use as in vivo reporters as they are readily assayed in whole animals or histological sections, whereas luciferase provides high sensitivity in cell culture assays. The recent availability of affordable next-generation sequencing has enabled the development of methods using DNA barcodes or even the CRM sequence itself as a reporter (see main text). While high-throughput, these approaches however lose the valuable ability possessed by visible reporter genes to spatially localize domains of CRM activity. Mouse embryo photo courtesy of VISTA Enhancer Browser, cell culture photo courtesy of Satrijat Sinha.
Figure 3
Figure 3. Transcription factor binding site motifs
A TFBS motif describes the sequences to which a TF can bind, and can be represented in various ways, each with its own advantages and disadvantages. (a) A subset of sequences to which the Drosophila TF Paired binds in a bacterial one-hybrid assay, drawn from FlyFactorSurvey. The simplest representation is as a single text string consensus sequence (b). In the consensus sequence, a single base is shown when it occurs in more than half of the binding site sequences and at least twice as much as the next most frequently occurring base at that position; otherwise, degenerate symbols are used. The example in (b) has H = {A, C, T} in the first column and Y = {C,T} in the final position. Consensus sequences have the advantage of being simple to portray and easy to search for, but convey limited information about the range of individual sequences comprising the motif. (c) A better sense of nucleotide variability at each position is seen with a motif logo. Logos can be derived from a position frequency matrix (d), which totals the presence of each base at each position and which can also be used to develop position weight matrices (PWMs) such as the logodds-adjusted matrix in (e). PWMs reflect the probability distributions of the four possible nucleotides at each location and relate closely to the binding energy of TFs to the DNA motifs. PWMs lend themselves well to sophisticated sequence-search algorithms and are the basis for most bioinformatics approaches to TFBS detection., –
Figure 4
Figure 4. Experimental methods for CRM discovery
(a) Genomic DNA to be tested for CRM function can be isolated in an unbiased way through shearing or digestion (small arrows), or in a more directed way by PCR amplification. The fragments are then tested for regulatory activity through one of several assays (d-f). (b) CRMs can also be predicted through assays for accessible chromatin, in which “open” chromatin regions (small arrows) can be distinguished from regions of less accessible chromatin. (c) An additional method used for CRM discovery is ChIP-seq directed against histone modifications (pink) or one or more TFs (blue). For both chromatin accessibility and ChIP-seq assays, predicted CRM regions identified by next-generation sequencing (boxed orange peak in b, c) can be cloned and validated by the assays in panels d-f. (d) Cloned sequences can be tested individually by traditional reporter gene assays in transgenic animals or cells (middle), or in a higher-throughput fashion following FACS sorting and next-generation sequencing. (e) Alternatively, reporter constructs can be built to contain unique sequence “barcodes” which can then be matched to the associated CRMs subsequent to RNA-seq analysis. (f) In STARR-seq, the CRM serves as its own reporter, allowing for direct identification following RNA-seq analysis.
Figure 5
Figure 5. Computational approaches to CRM discovery
Computational methods for CRM discovery fall into three basic classes. (a) Comparative genomics methods find regions of conservation between two or more species, either by sequence alignment (“aligned sequence”, shown here as a PhastCons score over multiple species) or by alignment of TFBS motifs (“aligned motifs”). A horizontal bar indicates predicted CRMs. Note that a method based on alignment of motifs may miss important unaligned compensatory sites (arrows). (b) Motif-based methods identify clusters of TFBS motifs, usually with some foreknowledge of which TFBSs are expected for the CRMs being sought (the “transcriptional code”). Here, a tight cluster of multiple red octagonal, blue square, and green triangle motifs predicts the CRM (horizontal bar). (c) Motif-blind methods rely on statistical models of the DNA sequence rather than identification of motifs. Regions of the genome that receive high scores based on a particular model are predicted as CRMs (green box).
Figure 6
Figure 6. TFBS conservation in aligned vs. alignment-free settings
Each colored polygon represents a binding site. (a) When considering conservation based on sequence alignment only a fraction of the binding sites are seen to be conserved (4/8 for CRM A, 4/7 for CRM B), and several different alignments can be proposed. Arrows represent aligned sites, with gray arrows indicating alternative alignments. Note that choosing the proper alignment is significant, as the identities of the conserved sites are sensitive to the chosen alignment; in this example, presence of the sites represented by the purple oval and the red octagon depends on alignment choice. (b) In an alignment-free setting, TFBSs are identified and considered conserved if they appear in both sequences, regardless of how they are ordered. Using this approach, 7/8 sites from CRM A and all seven sites from CRM B are conserved. Moreover, the full complement of different sites is conserved, with merely a small reduction in the number of sites represented by the red octagon. The same principle applies to nucleotide-based (rather than motif-based) alignments, where subsequence (k-mer) composition can be substituted for motifs (see text).
Figure 7
Figure 7. Supervised motif-blind CRM discovery
(a) A set of CRMs with related activity (e.g., midbrain, heart, wing, muscle) is selected as a training set, and a set of similarly-sized non-CRMs as a background (BKG) set. The training set can also include orthologous sequences from related species. (b) The k-mer profile of the sequence sets is obtained and used to train one of several statistical models. (c) The score for a given sequence S is the log-likelihood ratio of the models for the positive (“training”) and negative (“background”) sets on S. (d) Overlapping sequence windows are scored throughout the genome. High-scoring windows (stars) are predicted CRMs.
Figure 8
Figure 8. CLARE: Cracking the Language of Regulatory Elements
Flowchart of the CLARE method. Figure from Taher et al. (2012), © Oxford University Press, used with permission.
Figure
Figure. Transcriptional codes for developmental CRMs
TFs downstream of intercellular signaling pathways (A, B, C) mix with tissue-specific TFs (D, E) to form a “transcriptional code” to activate gene transcription. CRMs for two genes are pictured. Both respond to the same transcriptional code, but the arrangement of the TFBSs is different between the two, and the Gene Y CRM (right) has gained additional binding sites for TF “E”.
Figure
Figure. Degrees of homotypic TFBS clustering
The three pictured CRMs each have a different level of homotypic TFBS clustering ranging from high (CRM A) to low (CRM B) to none (CRM C). All three CRMs have an identical degree of heterotypic site clustering. TFBS are represented by colored polygons.

Similar articles

Cited by

References

RELATED ARTICLES

    1. Cho KW. Enhancers. Wiley Interdiscip Rev Dev Biol. 2012;1(4):469–478. - PMC - PubMed
    1. Kadonaga JT. Perspectives on the RNA polymerase II core promoter. Wiley Interdiscip Rev Dev Biol. 2012;1(1):40–51. - PMC - PubMed
    1. Noordermeer D, Duboule D. Chromatin looping and organization at developmentally regulated gene loci. Wiley Interdiscip Rev Dev Biol. 2013;2(5):615–630. - PubMed

References

    1. Pick L, Heffer A. Hox gene evolution: multiple mechanisms contributing to evolutionary novelties. Ann N Y Acad Sci. 2012;1256:15–32. - PubMed
    1. Smith E, Shilatifard A. Enhancer biology and enhanceropathies. Nat Struct Mol Biol. 2014;21:210–219. - PubMed
    1. Bulger M, Groudine M. Functional and mechanistic diversity of distal transcription enhancers. Cell. 2011;144:327–339. - PMC - PubMed
    1. Maston GA, Landt SG, Snyder M, Green MR. Characterization of enhancer function from genome-wide analyses. Annu Rev Genomics Hum Genet. 2012;13:29–57. - PubMed
    1. Ong CT, Corces VG. Enhancers: emerging roles in cell fate specification. EMBO Rep. 2012;13:423–430. - PMC - PubMed

Publication types

Substances

LinkOut - more resources