. 2015 Sep;230(9):2281-98.
doi: 10.1002/jcp.24961.

Nexavar/Stivarga and viagra interact to kill tumor cells

Affiliations

Nexavar/Stivarga and viagra interact to kill tumor cells

Mehrad Tavallai et al. J Cell Physiol. 2015 Sep.

Abstract

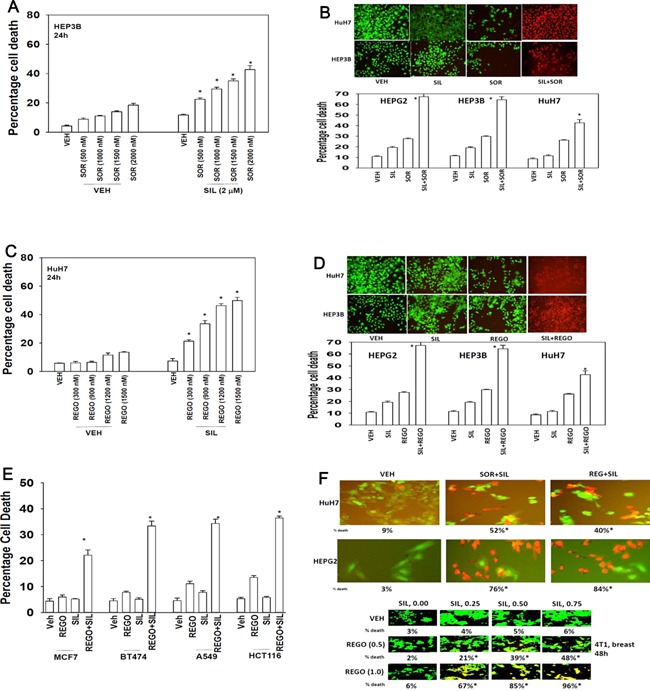
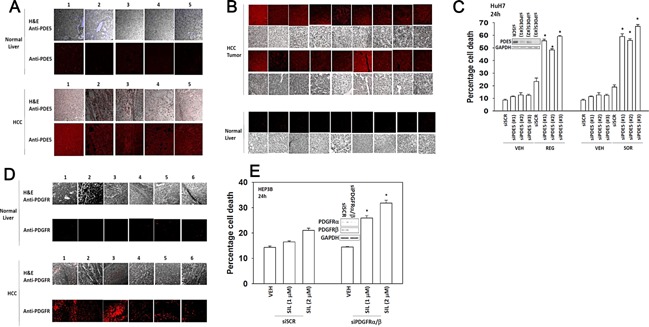
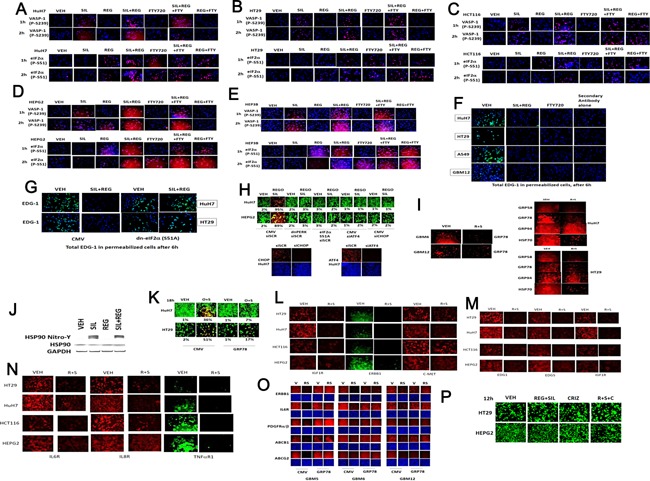
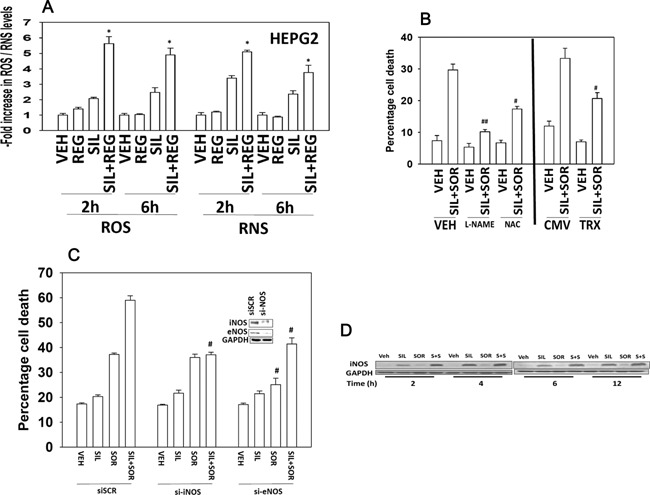
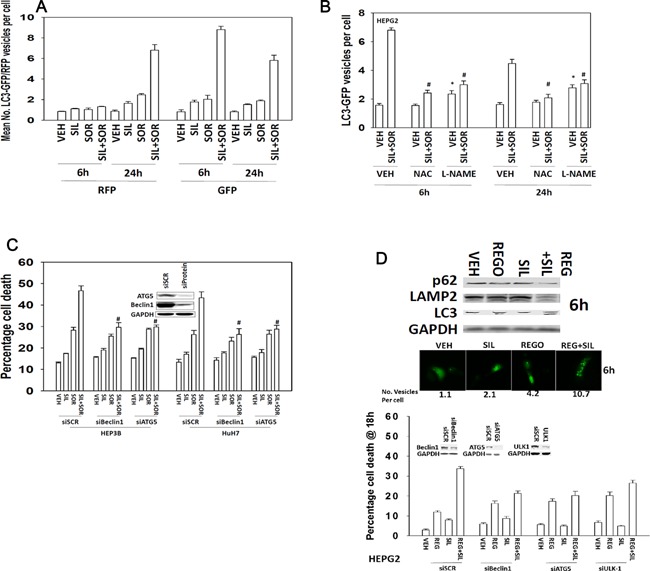
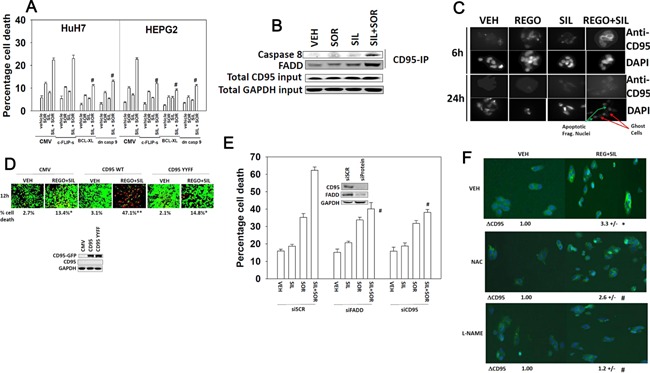
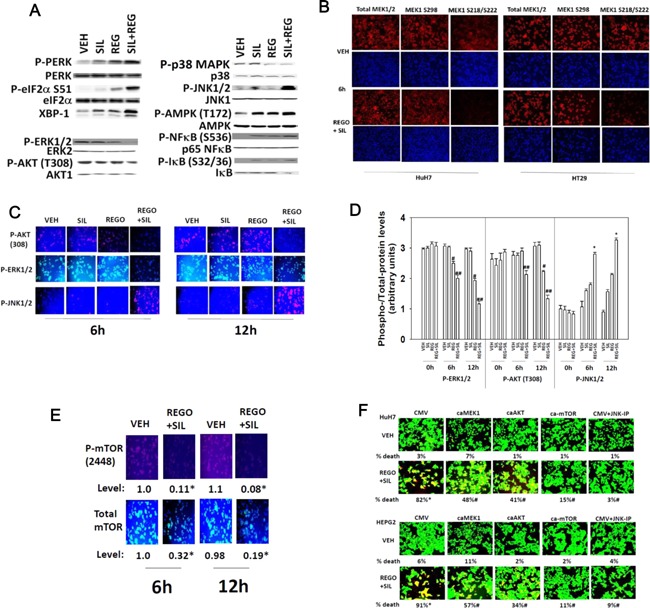
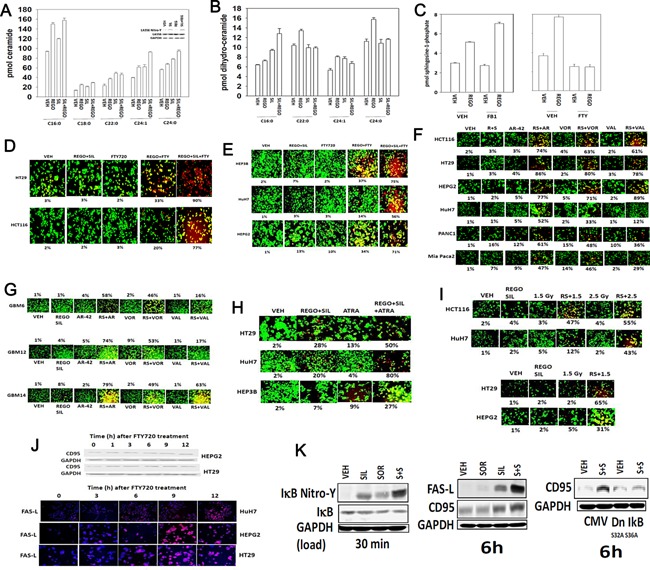
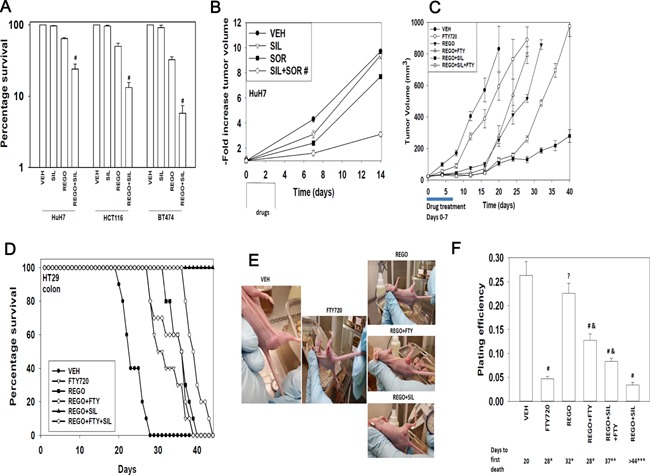
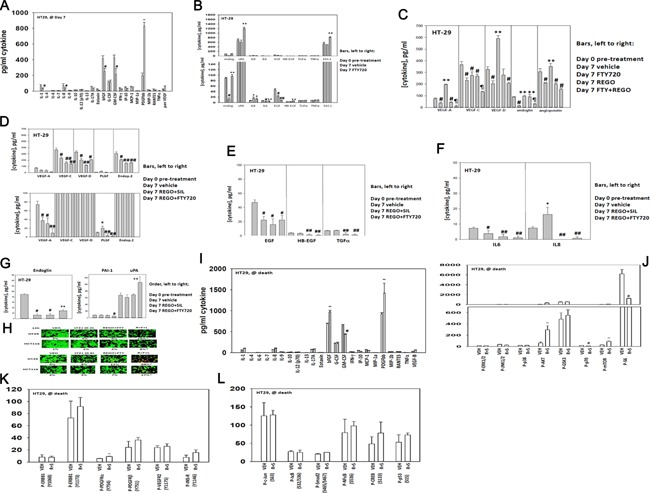
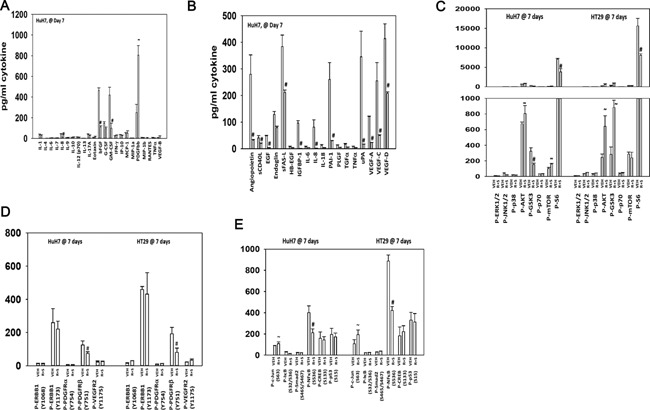
We determined whether the multi-kinase inhibitor sorafenib or its derivative regorafenib interacted with phosphodiesterase 5 (PDE5) inhibitors such as Viagra (sildenafil) to kill tumor cells. PDE5 and PDGFRα/β were over-expressed in liver tumors compared to normal liver tissue. In multiple cell types in vitro sorafenib/regorafenib and PDE5 inhibitors interacted in a greater than additive fashion to cause tumor cell death, regardless of whether cells were grown in 10 or 100% human serum. Knock down of PDE5 or of PDGFRα/β recapitulated the effects of the individual drugs. The drug combination increased ROS/RNS levels that were causal in cell killing. Inhibition of CD95/FADD/caspase 8 signaling suppressed drug combination toxicity. Knock down of ULK-1, Beclin1, or ATG5 suppressed drug combination lethality. The drug combination inactivated ERK, AKT, p70 S6K, and mTOR and activated JNK. The drug combination also reduced mTOR protein expression. Activation of ERK or AKT was modestly protective whereas re-expression of an activated mTOR protein or inhibition of JNK signaling almost abolished drug combination toxicity. Sildenafil and sorafenib/regorafenib interacted in vivo to suppress xenograft tumor growth using liver and colon cancer cells. From multiplex assays on tumor tissue and plasma, we discovered that increased FGF levels and ERBB1 and AKT phosphorylation were biomarkers that were directly associated with lower levels of cell killing by 'rafenib + sildenafil. Our data are now being translated into the clinic for further determination as to whether this drug combination is a useful anti-tumor therapy for solid tumor patients.


Figures

Figure 1
Figure 1
Sorafenib and PDE5 inhibitors interact to kill multiple tumor cell types. (A) HEP3B cells were treated with vehicle (DMSO), sorafenib (SOR, 500 nM–2.0 μM) and/or sildenafil (2.0 μM) as indicated. Cells were isolated 24 h after exposure and viability determined by trypan blue exclusion (n = 3, ±SEM) *P 0.05 < greater than vehicle control. (B) Hepatoma cells 24 h after plating were treated with vehicle (DMSO), sorafenib (SOR, 2.0 μM), PDE5 inhibitor (sildenafil, 2 μM); or the drugs in combination. Twenty‐four hours after treatment cells were isolated and viability determine by trypan blue (n = 3, ±SEM). *P 0.05 < greater than vehicle control. Upper images were generated using a live/dead assay using a Hermes WiScan instrument. (C) HuH7 cells were treated with vehicle (DMSO), regorafenib (REGO, 300–1,500 nM) and/or sildenafil (2.0 μM) as indicated. Cells were isolated 24 h after exposure and viability determined by trypan blue exclusion (n = 3, ±SEM) *P 0.05 < greater than vehicle control. (D) Hepatoma cells 24 h after plating were treated with vehicle (DMSO), regorafenib (REGO, 0.5 μM), PDE5 inhibitor (sildenafil, 2 μM); or the drugs in combination. Twenty‐four hours after treatment cells were isolated and viability determined by trypan blue (n = 3, ±SEM). *P 0.05 < greater than vehicle control. Upper images were generated using a live/dead assay using a Hermes WiScan instrument. (E) Tumor cells 24 h after plating were treated with vehicle (DMSO), regorafenib (REGO, 0.5 μM), sildenafil (2 μM) or the drugs in combination. Twenty‐four hours after treatment cells were isolated and viability determined by trypan blue (n = 3, ±SEM). *P 0.05 < greater than vehicle control. (F) Tumor cells were cultured in 100% heat inactivated human serum. Cells were treated with vehicle; sorafenib (5 μM) and sildenafil (2 μM); or with regorafenib (2 μM) and sildenafil (0–0.75 μM). Cells were isolated 24 h after drug exposure and viability determined using a live/dead assay using a Hermes WiScan instrument. Studies were performed in triplicate in 96‐well plates with the percentage numbers of live/dead cells being determined in three images per well (n = 3, ±SEM). *P 0.05 < greater than vehicle control.
Figure 2
Figure 2
Molecular manipulation of regorafenib and sildenafil targets recapitulates the effects of drug combination treatment. (A) Tissue microarrays of normal and tumor tissue matched from the same patients were stained for expression of PDE5 followed by H&E. The panels show five matched normal liver and hepatocellular tumor sections, each from the same patient (five patients). (B) Further normal liver and liver tumor sections stained to determine the expression of PDE5. (C) HuH7 cells were transfected with a control scrambled siRNA (siSCR) or three different siRNA molecules to knock down expression of PDE5 (siPDE5 #1, #2, #3). Thirty‐six hours after transfection were treated with vehicle (DMSO) or regorafenib (REG, 0.5 μM) or with sorafenib (SOR, 2.0 μM). Twenty‐four hours after treatment cells were isolated and viability determine by trypan blue (n = 3, ±SEM). *P < 0.05 greater than corresponding value in siSCR cells. (D) Tissue microarrays were stained for expression of PDGFRα/β followed by H&E. The parts show six matched normal liver and hepatocellular tumor sections, each from the same patient (six patients). (E) HEP3B cells were transfected with a control scrambled siRNA (siSCR) or siRNA molecules to knock down expression of PDGFRα and PDGFRβ. Thirty‐six hours after transfection were treated with vehicle (DMSO) or sildenafil (SIL, 1.0–2.0 μM). Twenty‐four hours after treatment cells were isolated and viability determine by trypan blue (n = 3, ±SEM). *P < 0.05 greater than corresponding value in siSCR cells.
Figure 3
Figure 3
Identification of tumor cell biomarkers that respond to regorafenib and sildenafil treatment. (A–D) Cells were grown in 96‐well plates and treated for the indicated amounts of time with regorafenib (0.5 μM), sildenafil (2 μM), FTY720 (50 nM), and the drugs in combination as indicated in each part. Cells were gently fixed in situ using 2% (v/v) para‐formaldehyde with Triton ×100 for permeabilization and probed for the phosphorylation of VASP‐1 (S239); eIF2α (S51); and the expression of the sphingosine‐1‐phosphate receptor (EDG‐1). (G) HuH7 and HT29 cells were transfected with empty vector plasmid (CMV) or to express dominant negative eIF2α (S51A). Twenty‐four hours after transfection cells were treated with regorafenib (0.5 μM) and sildenafil (2 μM) for 6 h. Cells were gently fixed in situ using 2% (v/v) para‐formaldehyde with Triton ×100 for permeabilization and probed for the expression of the sphingosine‐1‐phosphate receptor (EDG‐1). (E and F) Cells were grown in 96‐well plates and treated for the indicated amounts of time with regorafenib (0.5 μM), sildenafil (2 μM), FTY720 (50 nM), and the drugs in combination as indicated in each part. Cells were gently fixed in situ using 2% (v/v) para‐formaldehyde with Triton ×100 for permeabilization and probed for the phosphorylation of VASP‐1 (S239), eIF2α (S51), and the expression of the sphingosine‐1‐phosphate receptor (EDG‐1). (G) HuH7 and HT29 cells were transfected with empty vector plasmid (CMV) or to express dominant negative eIF2α (S51A). Twenty‐four hours after transfection cells were treated with regorafenib (0.5 μM) and sildenafil (2 μM) for 6 h. Cells were gently fixed in situ using 2% (v/v) para‐formaldehyde with Triton ×100 for permeabilization and probed for the expression of the sphingosine‐1‐phosphate receptor (EDG‐1). (H) Tumor cells were transfected with scrambled siRNA (siSCR) or siRNA molecules to knock down expression of ATF4 or CHOP (siATF4, siCHOP); or tumor cells were transfected with plasmids to express dominant negative PERK or eIF2α S51A. Thirty‐six hours after transfection cells were treated with regorafenib (0.5 μM) and sildenafil (2 μM) for 6 h. Cells were gently fixed in situ using 2% (v/v) para‐formaldehyde with Triton ×100 for permeabilization and probed for the expression of the sphingosine‐1‐phosphate receptor (EDG‐1). (I) Cells were treated with vehicle, regorafenib (0.5 μM), and sildenafil (2.0 μM) for 6 h. Cells were then fixed and the expression levels of HSP70 + HSC70, GRP78, GRP94, and GRP58 determined. (J) HuH7 cells were treated with vehicle, regorafenib (0.5 μM), and sildenafil (2.0 μM) for 3 h. HSP90 was immuno‐precipitated and the levels of total and nitrosylated HSP90 in the precipitates determined. (K) Cells were transfected with empty vector CMV or with a plasmid to express GRP78. Twenty‐four hours later cells were treated with vehicle or with [regorafenib (0.5 μM) + sildenafil (2.0 μM)] for a further 24 h. Cells were isolated and viability determine by a live/dead assay (n = 3, ±SEM). #P < 0.05 lower than corresponding value in CMV transfected cells. (L) Tumor cells as indicated in each part were treated with regorafenib (0.5 μM) and sildenafil (2 μM) together for 6 h. Cells were gently fixed in situ using 2% (v/v) para‐formaldehyde with Triton ×100 for permeabilization and probed for the total expression of each of the indicated growth factor receptors. (M and N) Tumor cells as indicated in each part were treated with regorafenib (0.5 μM) and sildenafil (2 μM) together for 6 h. Cells were gently fixed in situ using 2% (v/v) para‐formaldehyde with Triton ×100 for permeabilization and probed for the total expression of each of the indicated growth factor receptors. (O) Cells were transfected with empty vector plasmid or a plasmid to express GRP78. Twenty‐four hours after transfection cells were treated with vehicle or with regorafenib (0.5 μM) and sildenafil (2 μM) together for 6 h. Cells were gently fixed in situ using 2% (v/v) para‐formaldehyde with Triton ×100 for permeabilization and probed for the total expression of each of the indicated growth factor receptors and plasma membrane pumps. (P) Cells were treated with vehicle or with [regorafenib (0.5 μM) + sildenafil (2.0 μM)] and crizotinib (1.5 μM), as indicated. Cell death was assessed 12 h later using live/dead assays.
Figure 4
Figure 4
The generation of ROS/RNS following regorafenib and sildenafil treatment is a key mediator of tumor cell killing. (A) HEPG2 cells in 96‐well plates were loaded for 30 min with either dihydro‐DCF (10 μM) which is sensitive to oxidation by hydroxyl radicals and peroxynitrite directly and hydrogen peroxide (i.e., reactive oxygen species, ROS); or 3‐amino,4‐aminomethyl‐2′,7′‐difluorescein (DAF‐FM DA, 4 μM) which is sensitive to oxidation by NO (i.e., reactive nitrogen species, RNS). Cells were treated with vehicle (DMSO), regorafenib (1 μM), sildenafil (2 μM); or the drugs in combination. Cells—ROS/RNS measurements—were made in a Vector 3 plate reader at the indicated times after drug treatment (n = 3, ±SEM). *P 0.05 < greater than vehicle control. (B) Left portion of the graph: HEPG2 cells were pre‐treated with vehicle, the NOS inhibitor L‐NAME (1 μM) or the ROS quenching agent N‐acetyl cysteine (10 mM). Cells were then treated with vehicle or with sildenafil (2 μM), and sorafenib (2 μM) in combination. Twenty‐four hours after treatment cells were isolated and viability determined by trypan blue (n = 3, ±SEM). Right portion of the graph: HEPG2 cells were transfected with either an empty vector plasmid (CMV) or a plasmid to express thioredoxin (TRX). Twenty‐four hours after transfection cells were treated with vehicle or with sildenafil (2 μM), and sorafenib (2 μM) in combination. Twenty‐four hours after treatment cells were isolated and viability determined by trypan blue (n = 3, ±SEM). #P < 0.05 less than corresponding value in VEH/CMV cells; ##P < 0.05 less than corresponding value in NAC cells. (C) HEPG2 cells were transfected with a control scrambled siRNA (siSCR) or siRNA molecules to knock down expression of eNOS or iNOS. Thirty six hours after transfection cells were treated with vehicle or with sildenafil (2 μM), and sorafenib (2 μM) in combination. Twenty‐four hours after treatment cells were isolated and viability determined by trypan blue (n = 3, ±SEM). #P < 0.05 less than corresponding value in siSCR cells. (D) HEPG2 cells were treated with vehicle or with sildenafil (2 μM), and/or sorafenib (2 μM) in combination. Cells were isolated at the indicated time points and western immunoblotting performed to determine the expression of iNOS.
Figure 5
Figure 5
ROS/RNS regulate the induction of autophagy by drug treatment. (A and B) HEPG2 cells were transfected with a plasmid to express LC3‐GFP‐RFP. Twenty‐four hours after transfection cells were, as indicated pre‐treated with L‐NAME (1 μM) or NAC (10 mM), then treated with vehicle (DMSO), sorafenib (2 μM), sildenafil (2 μM); or the drugs in combination. The number of GFP vesicles (early autophagosomes) and RFP vesicles (late autolysosomes) were determined 6 and 24 h after drug treatment (n = 3, ±SEM). #P < 0.05 less than corresponding value in cells not treated with L‐NAME or NAC. (C) HEP3B and HuH7 cells were transfected with a control scrambled siRNA (siSCR) or siRNA molecules to knock down expression of Beclin1 or ATG5. Thirty‐six hours after transfection were treated with vehicle or with sildenafil (2 μM), and/or sorafenib (2 μM). Twenty‐four hours after treatment cells were isolated and viability determined by trypan blue (n = 3, ±SEM). #P < 0.05 less than corresponding value in siSCR cells. (D) Lower graph: HEPG2 cells were transfected with a control scrambled siRNA (siSCR) or siRNA molecules to knock down expression of Beclin1, ULK1, or ATG5. Thirty‐six hours after transfection were treated with vehicle or with sildenafil (2 μM), and/or regorafenib (0.5 μM). Twenty‐four hours after treatment cells were isolated and viability determine by trypan blue (n = 3, ±SEM); Middle images: Cells expressing LC3‐GFP were treated with vehicle or with sildenafil (2 μM), and/or regorafenib (0.5 μM) and the number of intense GFP+ vesicles counted in 40 cells and the mean number of vesicles per cell is presented (n = 3, ±SEM); Upper blots: Cells were treated with vehicle or with sildenafil (2 μM), and/or regorafenib (0.5 μM) and isolated after 6 h. Cell lysates were western blotted for the expression of the indicated proteins (n = 3).
Figure 6
Figure 6
Death receptor‐dependent and independent induction of cell death by sorafenib and sildenafil treatment. (A) HuH7 and HEPG2 cells were infected with recombinant adenoviruses to express empty vector (CMV); dominant negative caspase 9, BCL‐XL, or c‐FLIP‐s. Twenty‐four hours after infection cells were then treated with sorafenib (SOR 2.0 μM) and/or sildenafil (SIL, 2.0 μM). Twenty‐four hours after drug treatment cells were isolated and viability determined by trypan blue exclusion assay (n = 3, ±SEM). #P < 0.05 less than corresponding value in CMV infected cells. (B) HEPG2 cells were treated with sorafenib (SOR 2.0 μM) and/or sildenafil (SIL, 2.0 μM). Six hours after treatment cells were lysed and prepared for immunoprecipitation of CD95. After immunoprecipitation, immunoblotting was performed to determine the levels of caspase 8 and FADD in the immunoprecipitate. Total levels of CD95 and GAPDH in the lysate are also presented. (C) HEPG2 cells grown on microscope slides were treated with vehicle (DMSO), regorafenib (0.5 μM), sildenafil (2 μM), or the drugs in combination. Cells were fixed (but not permeabilized) 6 and 24 h after drug exposure. IHC was performed to determine the plasma membrane levels of CD95 and death by DAPI staining. (D) HuH7 cells were transfected with either an empty vector plasmid (CMV); a plasmid to express CD95‐GFP or a plasmid to express CD95‐GFP‐Y232F Y291F. Twenty‐four hours after transfection cells were then treated with sorafenib (SOR 2.0 μM) and/or sildenafil (SIL, 2.0 μM). Twenty‐four hours after drug treatment cells were isolated and viability determined by using a live/dead viability assay (n = 3, ±SEM). *P < 0.05 greater than corresponding value in CMV transfected cells. (E) HEP3B cells were transfected with a control scrambled siRNA (siSCR) or siRNA molecules to knock down expression of CD95 or FADD. Thirty‐six hours after transfection were treated with vehicle or with sildenafil (2 μM), and/or sorafenib (2 μM). Twenty‐four hours after treatment cells were isolated and viability determine by trypan blue (n = 3, ±SEM). #P < 0.05 less than corresponding value in siSCR transfected cells. (F) HEP3B cells grown on microscope slides were pre‐treated with L‐NAME (1 μM) or NAC (10 mM), then treated with vehicle (DMSO), sorafenib (2 μM), sildenafil (2 μM), or the drugs in combination. Cells were fixed (but not permeabilized) 6 h after drug exposure. IHC was performed to determine the plasma membrane levels of CD95.
Figure 7
Figure 7
Activation of JNK and inhibition of mTOR, ERK1/2, and AKT plays key roles in regorafenib and sildenafil toxicity. (A) HuH7 cells were treated with vehicle, regorafenib (0.5 μM), sildenafil (2 μM), or the drugs in combination for 3 h. Cells were isolated and the phosphorylation/expression of the indicated proteins determined by western immunoblotting. (B and C) HuH7 and HT29 cells growing in 96‐well plates were treated with vehicle, regorafenib (0.5 μM), sildenafil (2 μM), or the drugs in combination for 6 h or for 12 h. At each time point cells were fixed in place and probed for the expression and phosphorylation of MEK1, AKT, ERK1/2, and JNK1/2 and images obtained using a Hermes WiScan system. (D) Pictorial data shown in part C was analyzed and quantified using software provided with the WiScan system. The intensity of immuno‐staining fluorescence using each Phospho‐Antibody and in parallel total expression antibody was determined and the arbitrary “specific activity” of each kinase determine in multiple wells from multiple experiments (n = 3, ±SEM). #P < 0.05 less than vehicle control value; ##P < 0.05 less than regorafenib value; *P < 0.05 greater than regorafenib value. (E) HuH7 cells growing in 96‐well plates were treated with vehicle, regorafenib (0.5 μM), sildenafil (2 μM), or the drugs in combination for 6 h or for 12 h. At each time point, cells were fixed in place and probed for the expression and phosphorylation of mTOR/mTOR (S2448) and images obtained using a Hermes WiScan system. *P < 0.05 expression/phosphorylation of mTOR lower than corresponding vehicle control. (F) HuH7 and HEPG2 cells were transfected with plasmids: CMV (empty vector); to express activated MEK1, caMEK1; to express activated AKT, caAKT; or to express activated mTOR, ca‐mTOR. Twenty‐four hours after transfection a portion of vehicle control cells were treated with the JNK inhibitory peptide (JNK‐IP, 10 μM). Cells were then treated with vehicle or with regorafenib (0.5 μM) and sildenafil (2.0 μM) and cell viability determined after 24 h using a live/dead assay using a Hermes WiScan instrument (n = 3, ±SEM). *P < 0.05 greater than vehicle control; #P < 0.05 lower than corresponding value in CMV transfected cells.
Figure 8
Figure 8
Regorafenib and sildenafil interact to increase ceramide levels. (A and B) HuH7 cells were treated with vehicle control or with regorafenib (REGO 0.5 μM) and/or sildenafil (SIL, 2.0 μM). Six hours after treatment cells were isolated and bioactive lipids extracted. Multiple bioactive lipid species were analyzed using GC/MS techniques (n = 2 in triplicate ±SEM). *P < 0.05 greater than corresponding value in VEH cells; #P < 0.05 less than corresponding value in VEH treatment; % P < 0.05 greater than value in regorafenib alone treatment. Part A, upper inset part: Treatment of cells with sildenafil (2 μM) for 3 h increases nitro‐tyrosine (Y) levels in ceramide synthase 6 (LASS6). (C) HuH7 cells were treated with vehicle control or with regorafenib (REGO 0.5 μM) and/or Fumonisin B1 (FB1, 25.0 μM) or FTY720 (50 nM). Six hours after treatment cells were isolated and bioactive lipids extracted. Multiple bioactive lipid species were analyzed using GC/MS techniques (n = 2 in triplicate ±SEM). (D and E) Tumor cells were treated with vehicle control or with regorafenib (REGO 0.5 μM) and/or sildenafil (SIL, 2.0 μM) and/or FTY720 (50 nM). Cells were examined 9 h after treatment using a live/dead assay in a Hermes WiScan instrument (n = 3, ±SEM). (F and G) Tumor cells were treated with vehicle, [regorafenib (0.5 μM) + sildenafil (2.0 μM)], the HDAC inhibitors vorinostat (500 nM), AR‐42 (250 nM), Valproate (0.1 mM), or regorafenib + sildenafil + HDAC inhibitor. Cells were examined 9 h after treatment using a live/dead assay in a Hermes WiScan instrument (n = 3, ±SEM). (H) Tumor cells were treated with vehicle control or with regorafenib (REGO 0.5 μM) and/or sildenafil (SIL, 2.0 μM) and/or ATRA (150 nM). Cells were examined 18 h after treatment using a live/dead assay in a Hermes WiScan instrument (n = 3, ±SEM). (I) Tumor cells were treated with vehicle control or with regorafenib (REGO 0.5 μM) and/or sildenafil (SIL, 2.0 μM) followed 30 min later by exposure to ionizing radiation. Cells were examined 12 h after treatment using a live/dead assay in a Hermes WiScan instrument (n = 3, ±SEM). (J) Upper blots: Tumor cells were treated with 50 nM FTY720 for the indicated times and cell lysates western blotted to determine expression of the death receptor CD95 (n = 3); Lower IHC: Tumor cells in situ in a 96‐well plate were treated with FTY720 (50 nM) for the indicated times, and cells fixed and probed for expression of FAS ligand (FAS‐L) (n = 3). (K) HEPG2 cells were treated with vehicle (DMSO), sorafenib (2 μM), sildenafil (2 μM); or the drugs in combination. Left: Cells were isolated after 30 min and immuno‐precipitation of IκB was performed in duplicate. On separate blots assessment of IκB nitro‐tyrosine and total IκB was performed. Center: Cells were isolated after 6 h and the expression of FAS‐L and CD95 determined. Right: HEPG2 cells were transfected with empty vector plasmid or plasmid to express dominant negative IκB S32A S36A. Twenty‐four hours after transfection cells were treated with vehicle (DMSO), sorafenib (2 μM), sildenafil (2 μM); or the drugs in combination. Cells were isolated after 6 h and the expression of CD95 determined.
Figure 9
Figure 9
Sorafenib/regorafenib interact in vivo to suppress tumor growth. (A) HuH7 (hepatoma), HCT116 (colorectal) and BT474 (breast) tumors were formed in the flanks of athymic mice (∼150 mm3). Animals were treated PO with vehicle diluent (cremophore); sildenafil (5 mg/kg); regorafenib (25 mg/kg); or the drug combination for 24 h. Tumors were isolated and single cell suspensions of tumor cells derived. Cells were plated and colonies permitted to form for 7 days. Colonies were fixed, stained and counted, and the survival value in vehicle treated tumors defined as 100% (n = 3 × 6, ±SEM). #P < 0.05 less than survival in regorafenib treated cells. (B) HuH7 tumors were formed in the flanks of athymic mice (~150 mm3). Animals were treated PO with vehicle diluent (cremophore); sildenafil (5 mg/kg); sorafenib (25 mg/kg); or the drug combination for 3 days. Tumor volumes were measured 7 days and 14 days after the start of drug treatment (n = 2 studies, eight animals per group ± SEM). #P < 0.05 less growth than sorafenib treated cells. (C) HT29 tumors were formed in the flanks of athymic mice (∼30 mm3). Animals were treated PO with vehicle diluent (cremophore); sildenafil (5 mg/kg) and regorafenib (25 mg/kg); FTY720 (0.05 mg/kg) or the drugs in combination for 7 days. Tumor volumes were measured every 4 days after the end of drug treatment (n = 2 studies, eight animals per group ± SEM). (D) Kaplan Meier survival plot of animals treated in part C; animals were humanely sacrificed when tumor volumes exceeded 1,500 mm3. (E) Representative images of tumors from each condition, taken when tumors were of approximately the same volume (between days 15 and 30). (F) HT29 tumors, at the time of sacrifice were isolated from the animals and gently digested to obtain a single cell suspension of tumor cells. Cells were plated as single cells (100‐10,000) per well of a 6‐well plate. Colonies were permitted to form for 7–10 days after which they were fixed, stained and counted, and the plating efficiency for tumor cells ex vivo for each treatment determined (n = 8, ±SEM). (G) Athymic mice carrying pre‐formed HT29 tumors (50 mm3) were treated PO with vehicle diluent (cremophore) or sildenafil (10 mg/kg) and regorafenib (50 mg/kg) for 7 days after which animals were sacrificed, their normal tissues obtained and fixed and sealed in paraffin wax. Ten micron slices of each tissue were taken and H&E stained and examined under 10× magnification.
Figure 10
Figure 10
Treatment of HT29 tumors with regorafenib, sildenafil and FTY720 alters the cytokine expression levels in mouse plasma. (A–G) HT29 tumors (∼30 mm3) were formed in the flanks of athymic mice. Aliquots (∼75 μl) of mouse blood were obtained in a heparin/EDTA coated Eppendorf tube. Animals were then treated PO with vehicle diluent (cremophore); sildenafil (5 mg/kg) and regorafenib (25 mg/kg); FTY720 (0.05 mg/kg) or the drugs in combination as indicated for 7 days. Data in part A are vehicle control and [regorafenib + sildenafil] tumor data. After 7 days aliquots of mouse blood were again obtained (∼75 μl). Clarified mouse plasma free of cells was then subjected to multiplex assays in a Bio‐Rad MAGPIX system to define the expression of the noted cytokines in each part before and following treatment (n = 2 studies, eight animals per group ± SEM). *P < 0.05 greater than Day 0 pre‐treatment value; **P < 0.05 greater than Day 7 vehicle control; #P < 0.05 less than Day 0 pre‐treatment value; ##P < 0.05 less than Day 7 vehicle value; ¶P < 0.05 less than Day 7 regorafenib treatment value. (H) HT29 and HCT116 tumor cells in vitro were treated with vehicle control; [regorafenib (0.5 μM) + FTY720 (50 nM)]; the TGF β receptor inhibitor LY2157299 (0.2, 0.6 μM) or the drugs in combination as indicted for 9 h. After 9 h cell viability was determined in a Hermes WiScan instrument using a live/dead assay (n = 3, ±SEM). *P < 0.05 greater than REGO + FTY value. (I–L) HT29 tumors isolated from vehicle control treated or (regorafenib + sildenafil) treated tumors at the time of animal nadir were subjected to multiplex assays in a Bio‐Rad MAGPIX analyzer to determine the expression of cytokines in plasma and the phosphorylation of the indicated signal transduction proteins (n = 8, ±SEM). ~P < 0.05 greater than vehicle control treated tumor value; #P < 0.05 less than vehicle control treated tumor value. (M) HuH7 cells were treated with vehicle control; regorafenib (0.5 μM) and sildenafil (2 μM); BGJ398 (1 μM); Lapatinib (1 μM); MK2206 (1 μM) or in the combinations indicated in the part. Cells were examined 12 h after treatment using a live/dead assay in a Hermes WiScan instrument. Red/yellow cells = dead; green cells = alive (n = 3, ±SEM). *P < 0.05 greater than corresponding value in (regorafenib + sildenafil) treatment alone.
Figure 11
Figure 11
Regorafenib/sildenafil treatment alter multiple cell signaling processes in drug treated tumors at cessation of drug treatment. Parts (A–E) HuH7 and HT29 tumors, treated as described in Figures 9 and 10, were isolated 7 days after the start of drug exposure or were isolated at the time of sacrifice, when tumor volume was >1,500 mm3 (n.b. tumor mass for REGO + SIL treated tumors was only ∼500 mm3). Tumors were freeze‐thawed and lysed according to established procedures/manufacturer instructions. Tumors were subjected to multiplex assays to determine the levels of plasma cytokines/growth factors and the phosphorylation/expression of multiple membrane and intracellular signal transduction proteins (n = 8, ±SEM). #P < 0.05 lower value than vehicle control treated tumors; ~P < 0.05 greater value than in vehicle control treated tumors. (F) HuH7 cells were treated with vehicle control; regorafenib (0.5 μM) and sildenafil (2 μM); BGJ398 (1 μM); Lapatinib (1 μM); MK2206 (1 μM) or in the combinations indicated in the part. Cells were examined 12 h after treatment using a live/dead assay in a Hermes WiScan instrument. Red/yellow cells = dead; green cells = alive (n = 3, ±SEM). *P < 0.05 greater than corresponding value in (regorafenib + sildenafil) treatment alone.

References

    1. Benavides GA, Liang Q, Dodson M, Darley‐Usmar V, Zhang J. 2013. Inhibition of autophagy and glycolysis by nitric oxide during hypoxia‐reoxygenation impairs cellular bioenergetics and promotes cell death in primary neurons. Free Radic Biol Med 65:1215–1228. - PMC - PubMed
    1. Black KL, Yin D, Ong JM, Hu J, Konda BM, Wang X, Ko MK, Bayan JA, Sacapano MR, Espinoza A, Irvin DK, Shu Y. 2008. PDE5 inhibitors enhance tumor permeability and efficacy of chemotherapy in a rat brain tumor model. Brain Res 1230:290–302. - PMC - PubMed
    1. Booth L, Roberts JL, Cruickshanks N, Conley A, Durrant DE, Das A, Fisher PB, Kukreja RC, Grant S, Poklepovic A, Dent P. 2014. Phosphodiesterase 5 inhibitors enhance chemotherapy killing in gastrointestinal/genitourinary cancer cells. Mol Pharmacol 85:408–419. - PMC - PubMed
    1. Booth L, Roberts JL, Cruickshanks N, Tavallai S, Webb T, Samuel P, Conley A, Binion B, Young HF, Poklepovic A, Spiegel S, Dent P. 2015. PDE5 inhibitors enhance Celecoxib killing in multiple tumor types. J Cell Physiol 230:1115–1127. - PMC - PubMed
    1. Carr BI, D'Alessandro R, Refolo MG, Iacovazzi PA, Lippolis C, Messa C, Cavallini A, Correale M, Di Carlo A. 2013. Effects of low concentrations of regorafenib and sorafenib on human HCC cell AFP, migration, invasion, and growth in vitro. J Cell Physiol 228:1344–1350. - PMC - PubMed

Publication types

MeSH terms

LinkOut - more resources